

The purpose of this paper is to propose a minimum set of indicators to be measured by industrial companies to represent the triple bottom line (TBL) approach.
The research is both descriptive and quantitative. Three hypotheses establish associations among the degrees of use of TBL indicators and their different degrees of use in firms. The authors used confirmatory factor analysis (CFA) to validate the scale and structural equation modelling to represent the final measurement model. The survey gathered 149 industrial companies.
The results pointed out that there are positive associations among the degree of use of environmental indicators and social indicators, economic, environmental and social indicators have different degrees of use in firms, a positive association between the degree of use of environmental and social indicators and the use of economic indicators was not confirmed. The findings suggest how to measure sustainable performance for industrial companies and highlight the differences in the degree of use for the three dimensions of TBL.
The limitations refer to the non-probabilistic sample, applied in a specific context, industrial companies.
This set of indicators is intended to be used by industrial companies as a reliable instrument to sustainable performance assessment of the current stage of the TBL deployment and provide alternative approaches to address specific issues related to the environmental, social and economic sustainability.
The results offer tangible results for measuring and reporting firm’s social and environmental performance.
This paper intends to offer an integrated and consistent way of measuring sustainability in industrial companies.
1. Introduction
Sustainability, despite its inherent difficult to be properly defined (Lélé, 1991; Glavič and Lukman, 2007), has become a major issue when seen from an organisational perspective. As previously pointed out by several authors (e.g. Atkinson et al., 1997; Neely et al., 2002; Epstein and Roy, 2003), since sustainability has had its role increased in several aspects of management, one issue has arisen: how to better understand the way sustainability has been taken into account in terms of performance measurement by the firms? In order to find an answer to this question, numerous studies have dealt with how companies could turn firm’s sustainability performance into a systematic and effective way (Veleva and Ellenbecker, 2001; Warhust, 2002; Azapagic, 2004; Singh et al., 2012; Krajnc and Glavič, 2005; Searcy, 2009).
Once it has become clear the need for a paradigm shift towards a sustainable performance measurement, a new way to define organisation’s sustainable performance has advanced, the triple bottom line (TBL) approach (Elkington, 1998; Harris et al., 2001; Pava, 2007; Norman and McDonald, 2004; Colbert and Kurucz, 2007). The TBL adds both social and environmental dimensions to the traditional economic results to measure a firm’s performance from a sustainable perspective.
Accordingly, many studies that aim to study sustainability and performance in organisations use TBL as their conceptual basis, mentioning Elkington’s proposal as their conceptual reference (e.g. Cinelli et al., 2014; Deng, 2015; Ekins and Vanner, 2007; Krajnc and Glavič, 2005; Pádua and Jabbour, 2015).
Given the importance of the theme and the need for differentiation for unequal realities, several scholars have tried to shed some light on how to integrate sustainability measurement in organisations from different sectors. Thus, studies depict sectors such as minerals (Azapagic, 2004); textiles (Zamcopé et al., 2012); agricultural (Guttenstein et al., 2010); oil and gas (Infante et al., 2013; Hourneaux et al., 2017); and steel (Singh et al., 2007).
In this fashion, this paper aims to propose a minimum set of indicators to be measured by industrial companies to represent their performance according to the TBL approach. To do so, the instrument for data collection was threefold: for the economic dimension, we used 20 BSCs typical indicators, according to Henri (2009); 9 and 22 indicators from Global Reporting Initiative (GRI) (2008) for environmental and social dimensions, respectively. The empirical research had a sample that summed up 149 companies in Brazil.
The paper is structured as follows. Section 2 enfolds the main concepts of sustainability, sustainable performance measurement and indicators, followed by the study hypotheses. In the subsequent part, we describe the research methodology. In the sequence, we show the main results and analyses that were carried out and the paper ends with the conclusions and recommendations.
2. Theoretical background
2.1 Sustainability and the triple bottom line approach
Possibly the most known definition related to this theme is the Brundtland Commission’s, that states that sustainable development “meets the needs of the present without compromising the ability of future generations to meet their own needs” (World Commission on Environment and Development, 1987). Despite its importance, there have been some difficulty and controversy in defining what sustainability is (Lélé, 1991; Doppelt, 2008), especially on how to translate it into business frameworks and practices.
Possibly, due to its complexity, organisational sustainability is most known as represented by the “TBL”. According to Elkington (1998), the TBL approach could lead an organisation to perform economic prosperity, environmental quality and social justice simultaneously. McDonough and Braungart (2002) emphasise that many executives are getting to know these three concepts, including TBL issues as a way to add value to their products or services. Later, Lacy et al. (2010) and Berns et al. (2009) reinforce the importance of TBL as the main proxy to represent and measure sustainability in organisations.
In the search for a consensus, among countless definitions and terminologies, the three-pillar approach called the TBL has been a widely accepted perspective for sustainability not only by scholars but also by society and organisations (Lacy et al., 2010), although the TBL has not been exempt from criticism and contention (Norman and McDonald, 2004; Macdonald and Norman, 2007).
Despite some researchers’ resistance to this concept, to whom the concept is impossible to be put into operation (Norman and McDonald, 2004; Macdonald and Norman, 2007; Hubbard, 2009; Smith and Sharicz, 2011), the TBL has gradually been accepted among organisations (Elkington, 1998). Some studies reinforce this movement (Ho and Taylor, 2007; Hubbard, 2009).
2.2 Sustainability performance through indicators
In some sense, performance measurement has been noticed as a fundamental key to the managerial control process in any business (Olson and Slater, 2002). One point of departure for measuring organisation’s – whether sustainability-oriented or not – performance is the use of indicators. As seen before, they can be split into economic, social and environmental, according to the TBL approach.
2.2.1 Economic indicators: the balanced scorecard
The balanced scorecard (BSC) was created by Kaplan and Norton, in the early 1990s. The BSC is defined as a way to integrate strategy and action, through a communication process, including objectives, goals, initiatives and indicators, both financial and non-financial (Kaplan and Norton, 1996). Kaplan and Norton (1996) created the BSC as a new management system that “emphasises that financial and non-financial measures must be part of the information system for employees at all levels of the organisation” (p. 8).
BSC consists of four perspectives, setting the interrelationships among performance indicators that could lead to a complete view of a company’s activities (Kaplan and Norton, 1996). As per Kaplan and Norton (1996, p. 150), “[a] good Balanced Scorecard should have a mix of outcome measures and performance drivers. Outcome measures without performance drivers do not communicate how the outcomes are to be achieved”. Simons (2000) also stresses that a well-designed BSC should allow a balance between short and long-term objectives and outcome (lagging) and process (leading) measures, besides establishing both objective and subjective measures for firm’s performance.
Some authors explored BSC through statistical analysis, assessing the validity and reliability of the model (Bouliane, 2006; Henri, 2009). In one of these studies, Henri (2009), investigating 383 top management teams of Canadian manufacturing firms, establishes a set of 20 indicators that would be representative of a typical BSC composition. Table I presents these indicators, according to Henri’s (2009) proposal, used as a proxy for representing economic indicators in this study.
Economic indicators used in the survey
| Perspective | Indicators | Codea |
|---|---|---|
| Finance | (1) Operational income | OperIncF |
| (2) Sales growth | SalesGrowF | |
| (3) Return-on-investment (ROI) | ROIF | |
| (4) Return-on-equity (ROE) | ROEF | |
| (5) Net cash flows | CashFlowF | |
| (6) Cost per unit produced | CostUnitF | |
| Customer | (1) Market share | MShareC |
| (2) Customer response time | RespTimeC | |
| (3) On-time delivery | OnTimeDelC | |
| (4) Number of customer complaints | NComplC | |
| (5) Number of warranty claims | NWaClaimC | |
| (6) Survey of customer satisfaction | SurveySatC | |
| Internal processes | (1) Materials efficiency variance | MatEffVarP |
| (2) Manufacturing lead time | ManTimeP | |
| (3) Rate of material scrap loss | MatLossP | |
| (4) Labour efficiency variance | LabEffVarP | |
| Learning and development | (1) Number of new patents | NNewPatL |
| (2) Number of new product launches | NNewProdL | |
| (3) Time-to-market for new products | TimeNewPrL | |
| (4) Employee satisfaction | EmplSatL |
Note: aCodes created for the purposes of this research
Source: Based on Henri (2009)
2.2.2 Social and environmental indicators: Global Reporting Initiative
The Global Reporting Initiative (GRI) Reporting Framework is intended to perform as an accepted framework for reporting on an organisation’s economic, environmental and social performance (GRI, 2008). The GRI is a network with experts and representatives from various sectors of society present in over 40 countries around the world, and it has been determining the guidelines to sustainability reporting with the participation of several important stakeholders (GRI, 2008).
Table II presents the social and environmental aspects defined by the GRI guidelines. These aspects are “the general types of information that are related to a specific indicator category, e.g., energy use, child labour, customers” (GRI, 2008) and will be used as a proxy for the data gathering in this research.
Social and environmental indicators used in the survey
| TBL dimension | Indicator | Codea |
|---|---|---|
| Environmental indicators | Materials | GRI_ENV_A |
| Energy | GRI_ENV_B | |
| Water | GRI_ENV_C | |
| Biodiversity | GRI_ENV_D | |
| Emissions, effluents and waste | GRI_ENV_E | |
| Environmental aspects of products and services | GRI_ENV_F | |
| Environmental compliance | GRI_ENV_G | |
| Transporting | GRI_ENV_H | |
| General environmental issues | GRI_ENV_I | |
| Social indicators | Employment | GRI_SOC_A |
| Labour/management relations | GRI_SOC_B | |
| Occupational health and safety | GRI_SOC_C | |
| Training and education | GRI_SOC_D | |
| Diversity and equal opportunity | GRI_SOC_E | |
| Investment and procurement practices | GRI_SOC_F | |
| Non-discrimination | GRI_SOC_G | |
| Freedom of association and collective bargaining | GRI_SOC_H | |
| Child labour | GRI_SOC_I | |
| Forced and compulsory labour | GRI_SOC_J | |
| Security practices | GRI_SOC_K | |
| Indigenous rights | GRI_SOC_L | |
| Community | GRI_SOC_M | |
| Corruption | GRI_SOC_N | |
| Public policy | GRI_SOC_O | |
| Anti-competitive behaviour | GRI_SOC_P | |
| Compliance | GRI_SOC_Q | |
| Customer health and safety | GRI_SOC_R | |
| Product and service labelling | GRI_SOC_S | |
| Marketing communications | GRI_SOC_T | |
| Customer privacy | GRI_SOC_U | |
| Compliance of products and services | GRI_SOC_V |
Note: aCodes created for the purposes of this research
Source: Created by the authors, based on GRI (2008)
3. Study hypotheses
This study aims to describe how TBL approach has had been taking into account regarding the firm’s performance measurement. Figure 1 presents the research’s conceptual model and the hypotheses.
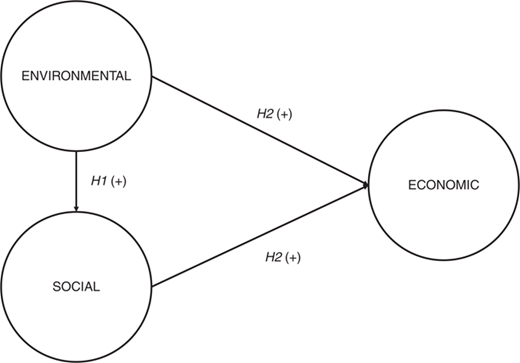
Two hypotheses refer to the relationship among the different types of indicators, commonly presented as the three dimensions of the TBL. These hypotheses are:
There is a positive association between the degree of use of environmental indicators and social indicators in industrial firms.
There is a positive association between the degree of use of environmental and social indicators and the use of economic indicators in industrial firms.
A third hypothesis refer to an overall analysis of the TBL and challenges the common understanding that the three dimensions would be equal. This hypothesis is:
Economic, environmental and social indicators have different degrees of use in industrial firms.
4. Methodological aspects
This sections aims to define and describe the main methodological aspects considered in the empirical research. Besides the content of this section, a detailed explanation on the statistical procedures was given also in Section 5.
4.1 Research definitions
The study is both descriptive and quantitative, using a survey-type research approach, conducted with managers of industrial companies. Despite the non-probabilistic sampling, this can be considered as a homogeneous group, with at least one common characteristic, as belonging to the same industry, as recommended by Flynn et al. (1990).
The research universe was the set of companies associated with the Centre of Industries of São Paulo State (CIESP). To each company, an invitation letter was sent by the board of social responsibility from CIESP with instructions to access the electronic questionnaire.
In order to reach the purposes of the study, the instrument for data gathering was threefold: for economic dimension, 20 BSCs indicators, according to Henri (2009); 9 and 22 indicators from GRI (2008) environmental and social dimensions, respectively, and questions regarding companies’ characteristics, as shown before in Tables I and II. To each of these indicators, the respondent should identify its degree of use, respecting a seven-point scale, with “1” being “not at all” and “7” as “at a great extent”, with verbal anchors at the extremes.
4.2 Statistics
In this study, the chosen indicators were used as observed variables of latent variables (constructs) and were treated as a scale. Moreover, the relationship between constructs were hypothesised and defined. The multivariate technique used was partial least squares–structural equation modelling (PLS–SEM or PLS path modelling), a second-generation technique primarily used to develop theories in exploratory research (Hair, Gabriel, and Patel, 2014; Hair, Hult, Ringle and Sarstedt, 2014).
From Shook et al. (2004) initial analysis of SEM usage in strategy research to Robins’s editorial (2012) in a special issue of Long Range Planning devoted to the use of PLS–SEM, this technique is growing in importance and relevance in strategy research. An SEM model is composed of two main components: the measurement model (or outer model) and the structural model (or inner model). The measurement model is used to show the relationships between the constructs and the indicators, and the structural model displays the relationships between the constructs (Hair, Gabriel and Patel, 2014).
In any SEM approach, the measurement model is validated using confirmatory factor analysis (CFA). CFA is useful to test a hypothesis based on past evidence and/or theory and requires a strong knowledge of observed measures that define the latent variable. Conversely from exploratory factor analysis (EFA), CFA provides a greater emphasis on theory testing and also offers a robust set of analytic procedures, not available on EFA (Brown, 2006). Since CFA is focussed only on the link between the factors and their measured variables, in the context of a SEM represents the measurement model (Byrne, 2009).
PLS–SEM was used for model measurement, and the constructs were hypothesised as reflective. Reflective models are the most used measurement model in social sciences and have its roots in classical test theory. This measurement model is useful when the hypothesis of causality is generated from the construct to the indicators. The structural model was assessed in their key results: significance and relevance of relationships, predictive accuracy, effect size and predictive relevance. Data were analysed using SmartPLS 2.0 (M3) (Ringle et al., 2005).
5. Results
5.1 Sample characteristics
Brazil has the largest economy in Latin America. It is also known for representing the first letter of the five countries from the BRICS acronym. São Paulo State is one of the 27 Brazilian federative units and responsible for more than 31 per cent of Brazilian GDP. It is also known as the best infrastructure, the largest labour force and the most powerful technological and industrial park. Its industrial sector is the largest employer in the country, with more than 2.5m people.
The survey gathered 149 companies. We can highlight their main characteristics as: the predominance of transformational industrial companies (87.2 per cent); mostly of them are micro, small and medium companies, with annual revenues less than USD60m (73.2 per cent) and a number of employees less than 99 (59.1 per cent). Of these companies, mostly, only 11.4 per cent are negotiated in the open market. They mostly have domestic (79.9 per cent) and private capital (99.3 per cent).
On variance based structural equation modelling, as PLS–SEM used in this study, normality is not a required assumption as in co-variance-based structural equation modelling (e.g. using software like LISREL, AMOS, EQS, MPLUS, LAVAAN, and others). Hair, Gabriel, and Patel (2014)/Hair, Hult, Ringle and Sarstedt (2014) considered worthwhile to evaluate the data distribution. Following this suggestion, data were tested using theory-driven methods (Razali and Wah, 2011), namely, Shapiro–Wilk test (SK) for univariate normality and Mardia’s skewness and kurtosis, Henze–Zirkler and Doornik–Hansen for multivariate normality. The results for univariate normality are presented in Table III.
Univariate normality test
| Shapiro–Wilk test | ||||
|---|---|---|---|---|
| TBL dimension | Indicator | Statistic | df | Sig. |
| Economic indicators | OperIncF | 0.750 | 149 | 0.000 |
| SalesGrowF | 0.720 | 149 | 0.000 | |
| ROIF | 0.868 | 149 | 0.000 | |
| ROEF | 0.923 | 149 | 0.000 | |
| CashFlowF | 0.779 | 149 | 0.000 | |
| CostUnitF | 0.815 | 149 | 0.000 | |
| MShareC | 0.893 | 149 | 0.000 | |
| RespTimeC | 0.861 | 149 | 0.000 | |
| OnTimeDelC | 0.733 | 149 | 0.000 | |
| NComplC | 0.782 | 149 | 0.000 | |
| NWaClaimC | 0.831 | 149 | 0.000 | |
| SurveySatC | 0.846 | 149 | 0.000 | |
| MatEffVarP | 0.895 | 149 | 0.000 | |
| ManTimeP | 0.819 | 149 | 0.000 | |
| MatLossP | 0.872 | 149 | 0.000 | |
| LabEffVarP | 0.893 | 149 | 0.000 | |
| NNewPatL | 0.855 | 149 | 0.000 | |
| NNewProdL | 0.930 | 149 | 0.000 | |
| TimeNewPrL | 0.919 | 149 | 0.000 | |
| EmplSatL | 0.874 | 149 | 0.000 | |
| Environmental indicators | Materials | 0.920 | 149 | 0.000 |
| Energy | 0.884 | 149 | 0.000 | |
| Water | 0.872 | 149 | 0.000 | |
| Biodiversity | 0.872 | 149 | 0.000 | |
| Emissions, effluents and waste | 0.881 | 149 | 0.000 | |
| Environmental aspects of products and services | 0.896 | 149 | 0.000 | |
| Environmental compliance | 0.855 | 149 | 0.000 | |
| Transporting | 0.914 | 149 | 0.000 | |
| General environmental issues | 0.906 | 149 | 0.000 | |
| Social indicators | Employment | 0.904 | 149 | 0.000 |
| Labour/management relations | 0.920 | 149 | 0.000 | |
| Occupational health and safety | 0.859 | 149 | 0.000 | |
| Training and education | 0.893 | 149 | 0.000 | |
| Diversity and equal opportunity | 0.933 | 149 | 0.000 | |
| Investment and procurement practices | 0.921 | 149 | 0.000 | |
| Non-discrimination | 0.885 | 149 | 0.000 | |
| Freedom of association and collective bargaining | 0.906 | 149 | 0.000 | |
| Child labour | 0.810 | 149 | 0.000 | |
| Forced and compulsory labour | 0.812 | 149 | 0.000 | |
| Security practices | 0.840 | 149 | 0.000 | |
| Indigenous rights | 0.768 | 149 | 0.000 | |
| Community | 0.900 | 149 | 0.000 | |
| Corruption | 0.857 | 149 | 0.000 | |
| Public policy | 0.885 | 149 | 0.000 | |
| Anti-competitive behaviour | 0.868 | 149 | 0.000 | |
| Compliance | 0.878 | 149 | 0.000 | |
| Customer health and safety | 0.864 | 149 | 0.000 | |
| Product and service labelling | 0.885 | 149 | 0.000 | |
| Marketing communications | 0.903 | 149 | 0.000 | |
| Customer privacy | 0.804 | 149 | 0.000 | |
| Compliance of products and services | 0.869 | 149 | 0.000 | |
Source: Created by the authors
The results for multivariate normality are presented in Table IV.
Multivariate normality test
| Test | Statistics | χ2 | df | Sig. |
|---|---|---|---|---|
| Mardia | ||||
| mSkewness | 1,304.384 | 33,069.838 | 23,426 | 0.000 |
| mKurtosis | 3,012.019 | 657.991 | 1 | 0.000 |
| Henze–Zirkler | ||||
| 1.000388 | 2.34e+07 | 1 | 0.000 | |
| Doornik–Hansen | ||||
| 523.317 | 0.000 | |||
Source: Created by the authors
The null hypothesis of all normality tests performed is not supported, which support the statement of non-parametric data, and it is suitable for PLS–SEM.
5.2 Assessment of measurement model
The estimation of a measurement model implies in the definition of relationships between the indicators (observed variables) and the construct (the latent variable). To assess a certain measurement model, several criteria of reliability and validity must be evaluated. The complete assessment of a measurement model includes the composite reliability to evaluate internal consistency, individual indicator reliability and average variance extracted (AVE) to check convergent validity, Fornell–Larcker criteria and cross-loadings to assess discriminant validity (Hair, Hult, Ringle and Sarstedt, 2014).
Composite reliability (ρc) is measured from 0 to 1, and higher values are equal to higher levels of reliability. As a rule of thumb, values between 0.7 and 0.9 are considered satisfactory. Indicator reliability and AVE are common measures of convergent validity. Indicator reliability is measured by its outer loading, and the expected measure is above 0.7. AVE should be above 0.50. These values are shown in Table V.
AVE and composite reliability for each construct
| AVE | ρc | R2 | Cronbach’s α | |
|---|---|---|---|---|
| BSC_FULL | 0.5698 | 0.88796 | 0.282 | 0.853 |
| GRI_ENV | 0.6440 | 0.9418 | 0.930 | |
| GRI_SOC | 0.6026 | 0.9577 | 0.555 | 0.915 |
| Reference values | >0.50 | >0.708 | Weak=0.25 Moderate=0.50 Substantial=0.75 | >0.708 |
Source: Created by the authors
Finally, discriminant validity is assessed by three measures: Fornell–Larcker criteria cross-loadings and disattenuated correlation. Fornell–Larcker criteria compare the squared root of the AVE of each construct to the correlations with other latent variables (or constructs), and the value of AVE should be greater. Also, an indicator’s outer loading on the associated construct should be greater than any of its loadings in other constructs (cross-loaded), and the disattenuated correlation approach is an estimate of what is the true correlation between two constructs if they were perfectly measured. Disattenuated correlation between two constructs close to 1 indicates the lack of discriminant validity (Hair, Gabriel, and Patel, 2014; Hair, Hult, Ringle and Sarstedt, 2014).
All indicators present outer loading above 0.7 and cross-loading confirmed discriminant validity. All parameters fitted or exceeded the minimum threshold. Table VI shows the squared root AVE (italics) compared to the latent variable correlations, according to Fornell–Larcker criteria.
Correlations among constructs
| BSC_FULL | GRI_ENV | GRI_SOC | |
|---|---|---|---|
| BSC_FULL | 0.7725 | ||
| GRI_ENV | 0.5310 | 0.8025 | |
| GRI_SOC | 0.4550 | 0.6921 | 0.7763 |
Source: Created by the authors
The next step was to identify disattenuated correlations, which was calculated for each pair of constructs, as shown in Table VII.
Disattenuated correlations among constructs
| Original correlation | Disattenuated correlation | Discriminant validity | |
|---|---|---|---|
| BSC_FULL–GRI_ENV | 0.8879 | 0.5866 | Supported |
| BSC_FULL–GRI_SOC | 0.4550 | 0.4934 | Supported |
| GRI_ENV–GRI_SOC | 0.6921 | 0.7287 | Supported |
Note: Reference values<0.90
Source: created by the authors
All parameters fitted or exceeded the minimum threshold suggested by the literature, what validates the proposed scale. Thus, the results suggest that it is possible to consider a firm’s sustainable performance through a set of 24 indicators, six for the economic dimension, nine for the environmental and nine for social performance, as presented in Table VIII.
Triple bottom line performance measurement and representative indicators for each dimension
| Economic Dimension | Environmental dimension | Social dimension |
|---|---|---|
| On-time delivery | Materials | Labour/management relations |
| Number of customer complaints | Energy | Occupational health and safety |
| Survey of customer satisfaction | Water | Training and education |
| Materials efficiency variance | Biodiversity | Non-discrimination |
| Rate of material scrap loss | Emissions, effluents and waste | Freedom of association and collective bargaining |
| Labour efficiency variance | Environmental aspects of products and services | Child labour |
| Environmental compliance | Forced and compulsory labour | |
| Transporting | Security practices | |
| General environmental issues | Compliance |
Source: Created by the authors
5.3 Assessment of structural model
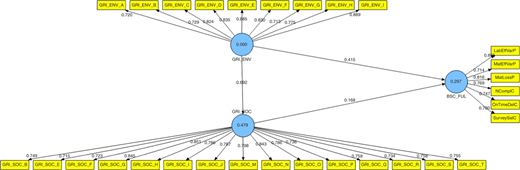
In SEM, the structural model is used to confirm the relationships hypothesised between the constructs. Several results are used to confirm or reject the hypothesis of a certain relationship, and the most common are the size and significance of path coefficients, the coefficients of determination (R2), predictive relevance (Q2) and effect sizes (f2). The structural model is presented in Figure 2.
Both the size and significance of a structural model in PLS–SEM are assessed by bootstrapping that generates an empirical t-value. Table IX presents the results of bootstrapping for each indicator.
Bootstrapping results for each indicator
| Latent variable | Indicator | Outer weight | t-value | Sig. level | p-value |
|---|---|---|---|---|---|
| Economic | BSCF1 | 0.678 | 7.587 | *** | 0.000 |
| BSCF2 | 0.715 | 8.493 | *** | 0.000 | |
| BSCF3 | 0.855 | 36.384 | *** | 0.000 | |
| BSCF4 | 0.813 | 25.948 | *** | 0.000 | |
| BSCF5 | 0.690 | 7.386 | *** | 0.000 | |
| BSCF6 | 0.753 | 13.029 | *** | 0.000 | |
| Environmental | GRI_ENV_A | 0.731 | 14.745 | *** | 0.000 |
| GRI_ENV_B | 0.744 | 16.042 | *** | 0.000 | |
| GRI_ENV_C | 0.832 | 24.624 | *** | 0.000 | |
| GRI_ENV_D | 0.830 | 26.534 | *** | 0.000 | |
| GRI_ENV_E | 0.887 | 46.394 | *** | 0.000 | |
| GRI_ENV_F | 0.828 | 19.445 | *** | 0.000 | |
| GRI_ENV_G | 0.705 | 12.365 | *** | 0.000 | |
| GRI_ENV_H | 0.764 | 16.525 | *** | 0.000 | |
| GRI_ENV_I | 0.885 | 38.134 | *** | 0.000 | |
| Social | GRI_SOC_B | 0.766 | 20.352 | *** | 0.000 |
| GRI_SOC_C | 0.777 | 26.504 | *** | 0.000 | |
| GRI_SOC_D | 0.744 | 19.918 | *** | 0.000 | |
| GRI_SOC_G | 0.799 | 22.637 | *** | 0.000 | |
| GRI_SOC_H | 0.825 | 26.083 | *** | 0.000 | |
| GRI_SOC_I | 0.787 | 19.057 | *** | 0.000 | |
| GRI_SOC_J | 0.793 | 20.541 | *** | 0.000 | |
| GRI_SOC_K | 0.710 | 14.397 | *** | 0.000 | |
| GRI_SOC_Q | 0.742 | 16.007 | *** | 0.000 |
Note: ***p<0.001
Source: Created by the authors
The results for the significance testing results of structural model path coefficients are presented in Table X.
Significance testing results of structural model path coefficients
| Path coefficients | t-values | Significance level | Hypothesis | |
|---|---|---|---|---|
| GRI_ENV→BSC_FULL | 0.415 | 3.863 | p>0.01 | Confirmed |
| GRI_ENV→GRI_SOC | 0.692 | 15.183 | p>0.01 | Not confirmed |
| GRI_SOC→BSC_FULL | 0.168 | 1.556 | p>0.10 | Confirmed |
Source: Created by the authors
The path coefficients in a PLS–SEM can be interpreted as the hypothesised relationships between the constructs and must be interpreted relatively to one another. In this study, two of the relationships are significant at a level of 1 per cent, and the effect of GRI_ENV on GRI_SOC is higher than the effect of GRI_ENV on BSC_FULL and the smallest effect occurs on GRI_SOC related to BSC_FULL.
To assess the predictive relevance (Q2) in PLS–SEM, the common procedure is blindfolding. Values of Q2 higher than 0 suggest that the model has predictive relevance for certain endogenous constructs. The coefficient of determination R2 (the most commonly used measure to evaluate the structural model) is also a measure of the predictive accuracy of a certain model. The value of R2 ranges from 0 to 1 and values of 0.75, 0.50 and 0.25 can be described as substantial, moderate or weak (Hair, Gabriel, and Patel, 2014; Hair, Hult, Ringle and Sarstedt, 2014). Table XI presents the values of Q2 and R2 for the hypothesised model.
Results of R2 and Q2 values
| R2 | Q2 | |
|---|---|---|
| BSC_FULL | 0.282 | 0.1619 |
| GRI_SOC | 0.555 | 0.2724 |
Source: created by the authors
The final assessment of a PLS–SEM structural is the effect size (f2). Effect size is useful to analyse the relevance of constructs in explaining how much a predictor construct contributes to the R2 value of a target construct in the structural model. Results from 0.02, 0.15 and 0.35 can be interpreted as small, medium and large effect sizes (Hair, Gabriel, and Patel, 2014; Hair, Hult, Ringle and Sarstedt, 2014). Effect sizes are presented in Table XII.
5.4 Hypotheses results
6. Discussion and conclusions
6.1 General remarks
As our results show, a set of indicators that covers the main aspects of sustainability performance can be useful for industrial companies’ management, according to the TBL approach. Within the economic dimension, on-time delivery, number of customer complaints and survey of customer satisfaction are typical indicators related to the firm’s value proposition and emphasise the importance of the client as a major stakeholder for companies in the industrial sector (Kärkkäinen et al., 2001; Hourneaux, Siqueira, Telles and Correa, 2014). On the other hand, materials efficiency variance, rate of material scrap loss and labour efficiency variance are economic indicators directly related to the efficiency of the industrial process – crucial for industrial companies – and may have a high impact on firm’s economic performance.
In the environmental dimension, the indicators materials, energy and water are the ones that have the highest priority on the measurement of production costs (Hourneaux Jr, Hrdlicka, Gomes and Kruglianskas, 2014). Other indicators such as emissions, effluents and waste, environmental aspects of products and services, environmental compliance, and general environmental issues are also typical in industrial process and should be measured, as well. Transporting also has important impacts on industrial companies (González-Benito and González-Benito, 2006). Finally, biodiversity has been considered as a relevant issue for companies in an ecosystem like Brazil, one of the richest in the world (Ramalho et al., 2016). It is important to state that it may lose its importance in other industrial contexts.
In the social dimension, the indicators labour/management relations, occupational health and safety, training and education, non-discrimination, freedom of association and collective bargaining, child labour, forced and compulsory labour, and security practices emphasise the importance of the employees as another major stakeholder for industrial companies (Shields and Young, 1992; Galeazzo and Klassen, 2015; Maia et al., 2018). Therefore, the social dimension can be seen as critical and complex for sustainability performance. Compliance, the other indicator is broader and can address the attempts to fit the regulations and possible ethical conflicts, sometimes with grave and unintended consequences to the companies (De Cremer and Lemmich, 2015).
Regarding the study’s hypotheses, the results pointed out that there are positive associations between the degree of use of environmental indicators and social indicators for H1. These findings emphasise that companies that have social and environmental orientation can achieve some synergy in these two aspects of sustainability. As mentioned before, the multidimensionality of sustainability and its intrinsic overlapping within measures underpins these relationships between environmental and social dimensions.
For H2, we conclude that economic, environmental and social indicators have different degrees of use in firms. Despite this logical deduction, companies can be misled to try to achieve the so-called balanced among the three sustainability dimensions, as we can recall some ideas like the three-legged stool as a representative figure for the TBL approach.
On the other hand, in H3, a positive association between the degree of use of environmental and social indicators and the use of economic indicators was not confirmed. This result suggests that companies can follow environmental and social performance regardless of their economic performance and vice versa. Again, the idea of a TBL approach as balanced as understood by common sense can be trick or misunderstood.
6.2 Academic implications
In brief, performance measurement is multidimensional and complex (Bourne et al., 2000; Chenhall and Langfield-Smith, 2007; Richard et al., 2009). As a logical consequence, sustainability performance should present different dimensionalities and levels for its measurement (Van Marrewijk and Werre, 2003). Trying to find new and better ways to deal with these issues have been seen as of increasing importance (Searcy, 2012).
Although our suggestion – or any other framework, actually – could not be considered as a complete or ideal solution to measure a firm’s sustainable performance, it can be seen as another path to recognise the importance of sustainability for companies’ management.
Thus, this study aims to propose and validate a framework for measuring a firm’s performance from TBL perspective. The proposed model is not expected to be considered as the only possible approach to support the assessment of TBL in organisations. Furthermore, the so-called balance on the TBL dimensions is rarely discussed, and it seems to be something highly important to be done.
We also emphasise the need for more clarification on the “balance” of the TBL approach to avoid misconceptions or misunderstandings among scholars.
6.3 Practical implications
This research indicates that the use of the TBL performance indicators can be done in different ways and degrees. It is also important to emphasise that several other factors can also influence the sustainable performance assessment, such as: industry, company size, local regulation, stakeholders’ efforts, competitive scenario, company lifecycle, amongst many others that could be used as moderators and/or mediators in the proposed model, generating a broader comprehension of TBL in practice and its impact on managerial aspects of every company, given an unique nature of every business.
This framework is supposed to work as a minimum set of indicators that could provide managers, policymakers and researchers subsidies to identify gaps and opportunities to enhance the overall performance of a certain organisation on regard of sustainability. This minimum set of indicators is intended to be used by industrial companies as a reliable instrument to sustainable performance assessment of the current stage of the TBL deployment and provide alternative approaches to address specific issues related to the environmental, social and economic sustainability.
6.4 Limitations and further research
This study has its limitations, mainly related to the non-probabilistic sample and to the specific context in which it was done, Brazilian industrial companies. Additionally, those indicators used as proxies are generic indicators employed as a way to make it possible for all the firms to participate in the research, instead of specific ones that could lead to missing data. Future research works could also investigate the fitness of the model for companies, and also take into consideration variables that could moderate or mediate the sustainable performance assessment.
As a sequence to this work, besides the possibility of counting on a larger sample and replicating this instrument in other circumstances, we suggest an investigation on the reasons for the use of this or that set of indicators over others, and on what basis it occurs, in order to enhance the quality and robustness of these indicators, as suggested by Singh et al. (2012).
