


The purpose of this paper is to contribute to empirical evidence by recognizing the importance of stock markets in the financial system and consequently its causality to economic growth and vice versa.
The study used the autoregressive distribute lag model (ARDL) with bound testing procedures, the sample covered quarterly time-series data from 2001q1 to 2019q2 in Tanzania.
The results suggest that stock market development have both negative and positive causality for both short-run dynamics and long-run relationship with economic growth. Economic growth is found to only cause and relate negatively to liquidity both in the short-run and in the long-run. The results show predominantly a unidirectional causality flow from stock market development to economic growth and finds partial causality flow from economic growth to stock market development, as represented by stock market turnover which proxied liquidity.
The use of quarterly data to reflect more realistically the dynamics of the variables because yearly data may sometimes cover-up specific dynamics that may be useful for prediction and policy planning. The study uses indices to capture general aspects within the stock market against economic growth as an intuitive way to aggregate the stock market development effects.
1. Introduction
The debate on causality between financial development and economic growth have hatched more questions than solutions. This debate has its genesis in the work of Schumpeter (1911), he theorized that a healthy financial system allocates economic resources efficiently among technologically innovative entities which in turn spur economic growth. The debate is still growing and is inconclusive (Khatun and Bist, 2019). First, effective financial markets are increasingly considered as crucial in propelling economic growth (Bayraktar, 2014). Firms borrow from these markets to finance their investments which in turn contribute to national gross domestic product (GDP) growth. Second, economic growth may as well propel financial markets development, as a result of increases in financial services demand in the economy (Ho and Njindan Iyke, 2017).
Efforts to explain economic growth and financial development come from all sectors and factors in the economy; however, majority of studies in finance-growth nexus have focused on the relationship between the banking system development (as a fit proxy for financial system development) and economic growth (Adu et al., 2013; Choong and Chan, 2011; Hou and Cheng, 2010), a review of literature done by Choong and Chan (2011) contends that the research on finance-growth nexus have beyond doubt produced empirical evidences for both a positive long-run effect and positive short-run causation between financial development and economic growth, and further noted that these effects are important in both developed as well as developing countries. Similarly, few studies have dwelt on the relationship between stock markets and economic growth (Owusu and Odhiambo, 2014; Wang and Ajit, 2013; Beck and Levine, 2004; Demirgüç-Kunt and Levine,1996). The obvious reason cited in literature (Hou and Cheng, 2010; Rousseau and Wachtel, 2000; Levine and Zervos, 1998) for this asymmetry is the relatively low issuance of equity compared to size of the banking system.
It is generally considered that the financial system, especially its stock markets, influence economic growth (Bayraktar, 2014; Hou and Cheng, 2010). There is a myriad of evidences for example for short-run causality and long-run causality between both variables, for example, Hou and Cheng (2010) found that stock market capitalization contribution to economic growth is substantially large and statistically significant in Taiwan. On the other hand, they found that economic growth promotes stock market development. This current study seeks to explore the mutual causality between stock market development and economic growth in a Tanzanian setting.
The sections in the article are organized as follows: Section 2 presents the literature review, Section 3 presents the data, model and methods used in the study, Section 4 covers the analysis and empirical results and Section 5 ends the article with conclusion and recommendations.
2. Literature review
2.1 Theoretical and empirical review
Traditionally, economic theory had put much emphasis on macroeconomic factors in explaining economic growth as well as financial system development. They included factors such as economic stability, income growth, institutional development and financial markets, among the factors, financial markets development has in recent decades received considerable attention (Khan, 2008) in explaining economic growth. Much of the attention emanates from the function that these markets play in the economy. These functions are transfer of resources over time, across borders and between economic entities; resource mobilization and pooling of savings; and allocation of capital efficiently and competitively (Levine and Zervos, 1996).
Finance and economic theorists have envisaged both positive and negative links between financial development and economic growth. Certain researchers have found a positive link between them (Khatun and Bist, 2019; Chauvet and Jacolin, 2017; Deltuvaitė and Sinevičienė, 2014; Hondroyiannis et al., 2005). Similarly, other have evidences for a positive link for some indicators (Adu et al., 2013). Although, a positive effect between them is predominant (Levine and Zervos, 1996), surprisingly, others have witnessed arguments and evidences for a negative effect between stock market development and economic growth (Levine and Zervos, 1996).
The debate on how financial development causes economic growth is ever growing (Adu et al., 2013). The empirical literature provides in many cases bi-directional causalities between financial development and economic development, both in developing and developed countries (Khan, 2008; Luintel and Khan, 1999). Other related evidences show that this effect is only in the long-run (Masoud and Hardaker, 2012; Hou and Cheng, 2010; Khan, 2008). However, notable results have tended to differ substantially across economies due to different institutional features and size of markets (Hondroyiannis et al., 2005), these have led to two general lines of theoretical arguments that are proposed in the literature as regards to the causality in the finance-growth nexus as follows:
2.1.1 The demand-side causality.
The “demand-following” hypothesis contends that financial development follows economic development (Hou and Cheng, 2010). Stated differently, economic growth causes financial development, implying that growth in demand for financial services is an outcome of economic development. This hypothesis is expected to work in countries with high economic development, where the growing financial services demand leads to the country to introduce new financial institutions, markets and products (Naik and Padhi, 2015). Some studies support this hypothesis both theoretically and empirically (Pradhan et al., 2013; Apergis et al., 2007; Levine and Zervos, 1998).
Economic growth implies an increase in services and goods produced by an economy over time. The theoretical position on the causality of economic growth on financial development (particularly stock markets development) remains less developed compared to the causality of financial system on economic growth (Ho and Njindan Iyke, 2017). When economic growth increases, the financial system is enabled to sustain sufficient activities making it cost-effective. Economists (Greenwood and Smith, 1997) contend that fixed costs are assumed in the process of formation of financial intermediaries in early development of the financial system. These fixed costs decline as the economy develops, allowing more financial inclusion in the financial system. This among other issues implies the presence of threshold effects in the development of financial markets. In support of this line of argument, empirical evidences for positive short-term causality flowing from economic growth to stock market development is well established in the work of Hou and Cheng (2010). They evidenced a demand leading hypothesis, implying the antecedence and causation of economic growth over stock market development.
With a special focus on Africa, Habiyaremye (2013) contends that over a decade preceding 2013 not less than six sub-Saharan economies were among the top ten fastest growing economies around the world. He further shows that based on IMF data projections which indicated that between 2011 and 2015, seven out of the top ten world fastest growing economies would come from sub-Sahara Africa. The projection has not changed much, in each of these cases Tanzania is also listed as among the top ten world growing economies. To what extent the growth effect can be felt in the development of its stock market remains a quest for research. This study will among other issues tests for this effect.
2.1.2 The supply-side causality.
The “supply-leading” hypothesis supports the idea that economic development follows financial development (Hou and Cheng, 2010). Stated differently, financial development causes economic development; thus, there is a proactive causality from financial development to economic development. Several studies support this hypothesis both theoretically and empirically (Naik and Padhi, 2015; Levine and Zervos, 1998; Demirgüç-Kunt and Levine, 1996).
Theoretically, a financial system, especially its’ stock market that is well-developed promotes savings and allocate productive capitals to investments efficiently which in turn promote economic growth (Naik and Padhi, 2015). Specifically, Levine and Zervos (1998) argue for stock markets over banking system in that the former offers numerous financial services than the latter, which are akin to fostering investment and economic growth. For instance, stock market development indicators, for instance market capitalization improves capital mobilization and risk diversification more efficiently, while stock market traded value and turnover ratio, which are liquidity measures lower transaction costs which enable efficient functions of markets (Arestis and Demetriades, 1997).
The extant literature identifies many channeling mechanisms for the flow of effects from stock market development to economic growth. They include; supply of ex ante information on investments (Masoud and Hardaker, 2012), corporate governance implementation (Adu et al., 2013), risk amelioration and investment diversification (Naik and Padhi, 2015) and resource mobilization and pooling effects (Adu et al., 2013). Each of these mechanisms may impact savings and/or investments and consequently economic growth (Adu et al., 2013). Further, stock markets have specific important effects which cause economic growth; they lower transaction costs and reduce trade risk, improve financial intermediation efficiency and provide exit options for investors (Hou and Cheng, 2010).
More empirical evidences indicate that stock market development spurs economic growth (Naik and Padhi, 2015; Masoud and Hardaker, 2012; Hondroyiannis et al., 2005). Particularly, Naik and Padhi (2015) found evidence for a supply-leading hypothesis, where stock market development spurred economic growth. Hondroyiannis et al. (2005) found a positive link between stock market development and economic growth, but the contribution was smaller. Conversely, the evidences for a negative causality of financial development to economic development has normally been ascribed to the specific reasons, which include sharing of risks through stock markets that are internationally integrated which reduces savings rate and slow economic growth (Devereux and Smith, 1994), that stock market development may hurt economic growth (Morck et al., 1990; Shleifer and Summers, 1988) especially in ineffective and state-run markets, that even developed stock markets may not be significant sources of finance (Mayer, 1988) especially in bank dominated financial systems, and some even view financial development as having an inconsequential contribution to development of the economy (Levine and Zervos, 1996) due to lack of statistical evidences from their samples.
2.2 Stock market development
Capital markets primarily comprise of equity markets and bond markets. Both are significant sources of long-term financing for both companies and governments. Capital markets are fundamentally large by capitalization and number of firms listed in developed countries compared to developing countries (Peria and Schmukler, 2017). Developed stock markets are expected to be more liquid and efficient than their less developed counterparts.
2.2.1 Stock market size.
Stock market size is the capitalization of the market. It is the number of shares times their market prices (Khatun and Bist, 2019; Beck et al., 2000). It captures the development level of the stock market in quantity of value (Bayraktar, 2014; Levine and Zervos, 1998). It mirrors the capability of the stock market to mobilize and allocate capital and hedge risk (Naik and Padhi, 2015; Masoud and Hardaker, 2012; Holmström and Tirole, 1993). For instance, through combining savings, effective stock markets can simplify mobilization of savings (Levine and Zervos, 1996). Various studies (Wong and Zhou, 2011) found a positive and a statistically significant effect between stock market size and economic growth. On another level, the size of stock market increases with more increase in liquidity, which both in turn spur economic growth (Masoud and Hardaker, 2012). This supports the evidence (Demirgüç-Kunt and Levine, 1996) that large and developed stock markets are more liquid compared to smaller ones. Other evidences (Wang and Ajit, 2013) show a negative effect of stock market capitalization on economic growth and point to the fact that if stock markets are not positively contributing to economic growth, then they are mainly administratively driven markets.
2.2.2 Stock market depth.
Stock market depth refers to total value of shares traded in percentages of GDP (Khatun and Bist, 2019; It measures market depth and liquidity (Bayraktar, 2014). It is a liquidity based-measure (Naik and Padhi, 2015). It refers to the level of shares sales easiness. This ratio indicates how liquid is the market in terms of quickness of transferring funds between sellers and buyers. It measures liquidity in an economy wide basis (Beck et al., 2000; Levine and Zervos, 1998). Market liquidity may reflect specific aspects of the market such as information efficiency (Masoud and Hardaker, 2012). It captures the market’s ability to generate and disseminate corporate information, for instance if there are large shares sales with less significant movements in share prices it raises market confidence in value of information and risk diversification (Naik and Padhi, 2015).
It is expected that stock markets will affect the economy through stock market liquidity, more liquid stock markets ease investment processes in the long-run and improve capital allocation and expectations for long-term growth (Levine and Zervos, 1996). Evidences from various authors (Naik and Padhi, 2015; Levine and Zervos, 1998) support a positive long-run causality of stock market liquidity on economic growth, consistent to the view that financial markets service economic growth. On the other hand, it is generally conceded that high liquidity can lead to negative effects on economic growth (Arestis et al., 2001; Levine, 1997; Demirgüç-Kunt and Levine, 1996). The channeling mechanisms for this effect are arguably; increased liquidity, by increasing return to investment causes reduction in savings rates (Arestis et al., 2001); uncertainty on savings, high liquidity may reduce savings rates as uncertainty leads to less precautionary savings (Demirgüç-Kunt and Levine, 1996); dissatisfied participants may have disincentive for corporate control, high liquidity prompts participants to sell quickly leading to adverse corporate governance and thereby hurt economic growth (Arestis et al., 2001).
2.2.3 Stock market efficiency.
Stock market efficiency refers to the stock market turnover ratio. It is the ratio of all shares traded value-to-total-market capitalization (Khatun and Bist, 2019; Beck et al., 2000). It is another measure of liquidity complementing stock market depth. Unlike stock market depth, which captures liquidity in an economy wide scope, stock market efficiency captures liquidity in a stock market basis (Beck et al., 2000; Levine and Zervos, 1998). Stock markets promote information acquisition about firms, with this information acquired, in liquid markets it is easier for investors to trade at posted prices, better information will ease savings mobilization, promote allocation of resources and spur growth of the economy (Levine and Zervos, 1996). A large stock market as indicated by its capitalization is not necessarily a liquid market. High turnover usually indicates low transaction costs (Levine and Zervos, 1998) which in turn enhances allocative efficiency of the stock market and consequently promote economic growth. Various studies (Naik and Padhi, 2015; Levine and Zervos, 1998) found evidences for positive effects between stock market efficiency and rate of economic growth. Particularly, Levine and Zervos (1998) found that stock market liquidity is a strong predictor for real per capital GDP growth, growth of physical capital and growth of productivity, both in current and long-term economic growth. These findings mirror efficiency in resource allocation into productive areas in the economy. They indicate that stock market efficiency is an integral part of the economic growth process.
2.3 Financial sector reforms and economic growth
2.3.1 The African experience.
It is significant to note that, notable growth of stock markets development has been witnessed in developing countries with a significant improvement after 1990s (Bayraktar, 2014). Okeahalam and Afful (2006) studying development of stock markets and growth of economies in the context of sub-Sahara Africa (SSA), analyzing 18 stock exchanges, for years between 1970 and 2002 conclude that the development of stock markets in SSA has not led to a clear increase in real investment. Back in 2006, they put a prophecy that went in favor of stock markets in Africa, that they are growing and would grow rapidly and become more important part on many economies in the region. They insisted further that the efficiency of stock markets in promoting investments and economic growth is dependent upon economic and socio-economic factors. Some of these factors are financial liberalization which enhances functioning of stock markets (Bekaert and Harvey, 2000), high level of inflation which negatively impact financial market activities (Huybens and Smith, 1999), prudent financial and economic policies which offer conducive environment for stock markets to function for economic growth (Okeahalam and Afful, 2006) and the institutional quality which plays an impact on the performance of stock markets (Okeahalam, 2005).
Most African economies have particularly undergone reforms which addressed the above cited factors. To what extent this has brought changes in the way we view the role of stock markets in African economies, need to be addressed empirically. For instance, Enisan and Olufisayo (2009) studied seven countries in Africa using autoregressive distributed lag (ARDL) model and bound testing and found that development of stock markets is cointegrated with growth of economies only in Egypt and South Africa. Similarly, another more comparatively recent study (Kagochi et al., 2013), studying seven economies in SSA, from 1991 to 2007, indicates that development of stock markets has positive effects on growth of economies. The study advocates for adoption of policies that create favorable economic and financial environment for market development. Kagochi et al. (2013) indicate that SSA stock markets suffer from low liquidity. Other challenges they cite are political instability in some countries, macroeconomic uncertainty, low saving rates due to limited market outreach, liquidity constraints, nascent trading and settlement systems, little market information and inadequate institutional supervision of the markets.
2.3.2 The Tanzanian experience.
The organization of stock markets in Tanzania dates back to 1994 when the Capital Market and Securities Authority (CMSA) was established, its’ formation was a response to comprehensive financial reforms that were done early in 1990s, that focused at among others economic reforms, formation of organized stock exchanges (Norman, 2013). At an economy wide level, a report on CMSA (Norman, 2013) documents measures that were implemented; liberalization of the financial sector and allowing appropriation of investments profits and dividends by national corporations as would be for independent entities. That means these national corporations could raise funds and earn incomes independent of the state direct control, the state remained as one of the shareholders only. These measures opened avenues for national corporations to list their share in the Dar es salaam stock exchange (DSE) thereby increasing stock market capitalization.
Stock market activities in Tanzania are done under the DSE, the exchange was incorporated in 1996, the exchange became operational in 1998 (Odhiambo, 2011a, 2011b), with Tanzania Oxygen Limited (TOL) and Tanzania Breweries Limited (TBL) as companies registered in that year (DSE, 2001), erstwhile within the same year, there was privatization and listing of state owned companies, while cross listing of companies started in 2004. Currently in 2019, the exchange lists a total of 28 companies. The year 2013 saw two major developments in the stock market, namely, migration to new and efficient trading system and introduction of second tier market, namely, enterprise growth market. In 2014, more developments were introduced, namely, non-trading exchange venues or what is called alternative trading system where matches of traders are done and the uplifting of foreign investors limits regulations which formerly curtailed foreign equity investments. In 2015, among other developments there was an establishment of the governing framework and later start of trading through mobile phones (DSE, 2019).
Latest known study in Tanzania, that of Abbas et al. (2016) in stock markets development and economic growth, which used time series from 2000 to 2011 found that stock market capitalization, total value traded and turnover ratio have no effect on economic growth in Tanzania. Earlier related known study for Tanzania, that of Odhiambo (2011b), found a separate unidirectional causality from economic growth towards financial depth, even though this study did not specifically study stock market development, it help to highlight the general movement of the financial system, in that financial development followed economic growth in Tanzania during the period 1994 to 2005. Are there surprises and/or new developments in the DSE within the Tanzanian context? This forms the basis for this study as noted earlier and hereafter in the following sections.
2.4 Objective and hypotheses
There is little consensus on how development of stock markets relates to economic growth (Naik and Padhi, 2015). To the best of my knowledge little is known in Tanzania about the effect of stock markets on economic growth or the effect of economic growth on stock market development. The objective of this study is to contribute to empirical evidence on this nexus, by recognizing the significance of stock markets in the financial system and consequently its causality to economic growth and vice versa.
In this study the following competing hypothesis are tested within the stock market development and economic growth framework.
supply leading hypothesis: stock market development cause economic growth in Tanzania;
demand leading hypothesis: economic growth cause stock market development in Tanzania; and
bidirectional hypothesis: both H1 and H2 above hold.
3. Data, model and methodology
3.1 Data and variable measurements
Unlike cross-section studies, time-series methods are thought to explain the specificity of the separate economies and provides an avenue for studies to examine causality form and its development overtime, as causality may vary across economies (Hondroyiannis et al., 2005; Rousseau and Wachtel, 1998). The current study uses quarterly time-series data from 2001q1 to 2019q2 from Tanzania. The data for the stock market development variables were taken from Dar es Salaam Stock Exchange (DSE) internal database, while the real GDP growth rates data was taken from the Bank of Tanzania (BOT) website. The total periods covered were 74 quarters.
This study followed frequently used measurement techniques for stock market development variables. Various studies (Bayraktar, 2014; Masoud and Hardaker, 2012; Beck et al., 2000; Levine and Zervos, 1998) on stock market development and economic growth have previously captured stock market development through three indicators: stock market size measured by the ratio of stock market capitalization to percentage of GDP, stock market depth or activity as measured by stock market total value traded in percentage of GDP and stock market efficiency measured as the ratio of total stock market turnover to stock market capitalization. Economic growth variable is measured by real gross domestic product growth (real GDP growth rate) as used by other scholars (Naik and Padhi, 2015; Owusu and Odhiambo, 2014; Adu et al., 2013) as this measure is considered to be important in evaluating economic performance of an economy (Adu et al., 2013).
Individual stock market development indicators have been considered insufficient to account for the overall development of stock markets (Khatun and Bist, 2019; Beck and Levine, 2004; Liang and Teng, 2006; Hondroyiannis et al., 2005). Thus, complementing these measures and following methods used by other researchers (Khatun and Bist, 2019; Adu et al., 2013), the study developed indices of stock market development using principal components analysis techniques as explained in Section 4.1.
3.2 Model specification and methodology
For estimation and modeling purpose, the study specifies the following general model to capture the relationships in the variables.
where RGDPGt is real GDP growth at time (t), SMCt is the stock market capitalization as a percentage of GDP at time (t), SVTt is the stock market total value traded as a percentage of GDP at time (t), and, SMTt stock market turnover ratio as a ratio of stock market total value traded to stock market capitalization at time (t).
The estimable equation is specified as follows:
The first component in equation (2) SMC, a high value of stock market capitalization signal high level of development of stock market, indicating that finances are channeled to most profitable projects. This level effect is pro-economic growth, as advanced financial markets are supposed to create investor confidence, lure FDIs and accelerate economic growth (Shahbaz et al., 2016), the two last components in equation (2) channel liquidity effects through efficiency creation and market depth, risk and assets diversification and creates easy of trade (Levine and Zervos, 1998; Beck et al., 2000).
The current analysis uses the autoregressive distribute lag model (ARDL) formally suggested by Pesaran et al. (2001). The ARDL model is based on an ordinary least square (OLS) modelling approach applicable to both non-stationary series and mixed order of integration (Shrestha and Bhatta, 2018). This methods has some relative advantages over other methods because it does not impose limiting assumptions that all variables should exactly be integrated of the same order, it is well suited for small sample analysis, and it normally results into unbiased results of the long-run model and correct t-statistics irrespective of endogeneity in the series (Appiah, 2018). The model can be used irrespective of the variables’ order of integration that is any combination of I(0) and/or I(1) orders, if variables are I(2) that would normally invalidate the results (Adu et al., 2013). In analyzing long-run relationship between economic growth represented through real GDP growth and financial development indicators, the study uses bounds testing procedures for cointegration within the ARDL framework. In the study the ARDL model in equation (3) is specified. However, the analysis conceptualizes four models/equations with the following as dependent variables; GDP, SMC, SVT and SMT. For reasons of parsimony, a single ARDL equation is presented in equation (3). The first part with λ1, λ2, λ3, λ4 coefficients represents the long-run relationships of the models and the second part with γi, ψi, φi, ϕi coefficients denotes the short-run dynamics of the models.
where α0 is a drift element and εi is a process that is white noise. In this approach the ARDL evaluates (p + 1)k number of regressions to attain optimal lag length for each series. In this case “p” is the maximum possible number of lags that can be used and “k” is the estimable number of equations in model (3). In the analysis, the optimum lag structure of regression at first difference is chosen by means of both Akaike Information Criteria (AIC) and Schwarz Bayesian Criteria (SBC). The analysis follows the Pesaran et al. (2001) bound testing method for long-run relationship and both the F-test for significant of coefficients of the lagged variables in equation (3). The null hypothesis of no cointegration H:0λ1 = λ2 = λ3 = λ4 = 0 if rejected, the alternative hypothesis of presences of cointegration is accepted, H:1λ1 ≠ λ2 ≠ λ3 ≠ λ4 ≠ 0. Normally two critical bounds are employed when the regressors are I(d)(0 ≤ d ≤ 1).
The steps involved were, first estimating the above ARDL model, second step following was to implement the ARDL bound test procedures to test for long-run causality using F-statistics (Shahbaz et al., 2016). The null hypothesis that all intercepts are not equal to zero is tested. The calculated F-Statistics are compared with critical values at 1, 5 and 10% for F-bounds tests. The values pre-determined by Pesaran et al. (2001) are in a pair of lower critical values bounds (I(0)) and upper critical values bounds (I(1)). If the calculated F-values are below the lower bounds the null hypothesis of no cointegration is accepted but if these calculated values are above the upper critical values the null hypothesis of no cointegration is rejected and the alternative hypothesis of presence of integration is adopted. But if the calculated value is between the lower critical value and the upper critical value, then the test is inconclusive.
Third step involves formulation and estimation of short-run model if there is no statistical evidence for a long-run relationship or cointegration based on the bound testing procedures.
In the third step, alternatively, estimation and formulation of long-run model is done if there is statistical evidence for a long-run relationship or cointegration. The long-run coefficients are estimated using OLS procedures in equation (5):
Then finally, the study further formulated and tested for the ARDL error correction model adaptation to assess the error correction term. If long-run relationship is found, then an error correction specification is estimated using the following reduced form in equation (6).
The study applies residual diagnostics and stability tests. The former test for serial correlation, functional form, heteroskedasticity and normality, the later test uses cumulative sum (CUSUM) test and cumulative sum squared (CUSUMSQ) test for model stability.
4. Analysis and empirical results
4.1 Principal components analysis, descriptive and correlation analysis
Many studies have measured stock market development through its’ disaggregate measures which have been previously discussed (i.e. market capitalization to GDP, total value traded to GDP and market turnover ratio.) (Khatun and Bist, 2019; Bayraktar, 2014; Beck et al., 2000; Levine and Zervos, 1998). Some few other studies (Naik and Padhi, 2015; Pradhan et al., 2013) have attempted to aggregate stock market development into an index through the use of principal component analysis (PCA). The motivation to use this index have been prompted by mixed empirical evidences on the effect that market capitalization as an indicator for stock market development plays on economic growth (Naik and Padhi, 2015).
On a first dimension, for instance, Levine and Zervos (1998) found that market capitalization is not an excellent predictor for economic growth, while Arestis et al. (2001) found that market capitalization works better as a predictor for economic growth. On a second dimension, total value traded to GDP is thought to be an excellent measure of stock market development because of its stress on liquidity (Naik and Padhi, 2015), an important feature in capital markets. On a third dimension, total value traded to GDP is thought to be more based on an economy wide measure of liquidity which may not mirror actual liquidity but only reflects trading relative to the economy (Beck and Levine, 2004), therefore turnover ratio (the ratio of total value traded to market capitalization), which uses exclusively stock market data closely mirror the market liquidity level and its implication to information, price and market confidence.
Thus, based on this possibility for weaknesses and a quest to more realistically and comprehensively reflect stock market development, this study (following, Naik and Padhi, 2015; Pradhan et al., 2013) develop indices that use PCA derived from the threefold measures of stock market development, namely, market capitalization to GDP, total value traded to GDP and turnover ratio, to aggregate and capture both aspects of stock market development, which are size and liquidity as captured through depth and efficiency indicators.
The results of PCA are summarized in Table 1. The first principal component (PC1) explain about 57%, while the next PC2 explain about 37% and the last PC3 explains about 6% of the standardized variances. Based on eigenvalues cutoff points that are above 1, only 2 indices out of 3 variables were extracted. The PCs loadings for PC1 draw more from SMC and SVT, while PC2 draws from SMT. The PCI and PC2 are renamed into SMI1 and SMI2 respectively to represent two main aggregate properties in the stock market development in Tanzania. The first, SMI1, represents stock market size and depth while the second, SMI2, represents stock market liquidity. The main insight from this analysis is that the two stock market development properties are uncorrelated as also indicated in Table 2 correlations results. These indices are further carried into subsequent analysis in Section 4.5.
Principal components analysis (PCA)
| Eigenvectors (loadings) | |||
|---|---|---|---|
| Variable | PC 1 | PC 2 | PC 3 |
| SMC | 0.695128 | −0.298615 | 0.653931 |
| SMT | 0.066112 | 0.932345 | 0.355475 |
| SVT | 0.715839 | 0.203868 | −0.667841 |
| Eigenvalues | Cumulative | Cumulative | |||
|---|---|---|---|---|---|
| Principal components | Values | Difference | Proportion | value | proportion |
| 1 | 1.710971 | 0.594223 | 0.5703 | 1.710971 | 0.5703 |
| 2 | 1.116748 | 0.944468 | 0.3722 | 2.827720 | 0.9426 |
| 3 | 0.172280 | --- | 0.0574 | 3.000000 | 1.0000 |
Descriptive statistics and correlations
| Descriptives | RGDPG | SMC | SMT | SVT | SMI1 | SMI2 |
|---|---|---|---|---|---|---|
| Mean | 5.513243 | 89.24959 | 0.559459 | 0.416351 | −1.35E−07 | 2.70E−07 |
| Median | 5.730000 | 66.17500 | 0.375000 | 0.155000 | −0.424240 | −0.231215 |
| Maximum | 10.93000 | 231.4800 | 3.030000 | 2.600000 | 2.874440 | 3.867290 |
| Minimum | 1.480000 | 2.450000 | 0.050000 | 0.020000 | −0.979450 | −1.009710 |
| Std. Dev. | 2.569667 | 73.06169 | 0.602983 | 0.626649 | 1.000001 | 1.000000 |
| Skewness | 0.195894 | 0.286235 | 2.451267 | 2.214063 | 1.249800 | 2.064888 |
| Kurtosis | 1.997302 | 1.566613 | 9.427582 | 7.122751 | 3.752970 | 7.743614 |
| Observations | 74 | 74 | 74 | 74 | 74 | 74 |
| Correlations | ||||||
| RGDPG | – | |||||
| SMC | 0.552541*** | – | ||||
| SMT | −0.354498*** | −0.192714* | – | |||
| SVT | 0.331083*** | 0.708444*** | 0.252339** | – | ||
| SMI1 | 0.457049*** | 0.909455*** | 0.085787 | 0.936348*** | – | |
| SMI2 | −0.404680*** | −0.315308*** | 0.985349*** | 0.215976* | 2.82E−07 | – |
Note:
***,
** and
*Indicate statistical significance at 1, 5 and 10% respectively
Descriptive statistics and correlations are reported in Table 2. Stock market capitalization has the highest value (89.2) when compared to stock market value traded (0.41) which are both weighted on GDP percentages. All variables are not highly skewed, they lie between tolerable ranges. Stock market capitalization and stock market value traded are both positively and significantly correlated with real GDP growth (0.55 and 0.33, respectively), while stock market turnover ratio is negatively and significantly correlated with real GDP growth.
Stock market value traded is highly and positively correlated with stock market capitalization, the results are statistically significant (0.7), as a result the two variables also as indicated in Table 1 in the PCA analysis mainly composed the SMI1 index, this points to the fact that SMI1 is highly correlated to both stock market capitalization (0.9) and stock market value traded (0.93). Conversely stock market turnover is highly correlated with SMI2 (0.98). Thus, index two is mainly made of stock market turnover. On another level SMI1 is positively correlated with real GDP growth (0.45), while SMI2 is negatively correlated with real GDP growth (−0.4), and both results are statistically significant.
Stock market value traded and stock market turnover ratio are positively correlated, this may imply that the two measures of both depth and liquidity may be substitutes. Size as measured by stock market capitalization is positively correlated to depth but negatively related with stock market liquidity, this may indicate that the Tanzanian stock market increases its depth as capitalization increase, but its size has not sufficiently promoted liquidity. The differences in the sign and magnitudes in the values may indicate different aspects of the market. Size indicating ability to mobilize resources and hedge risks, while depth may partially reflect efficiency.
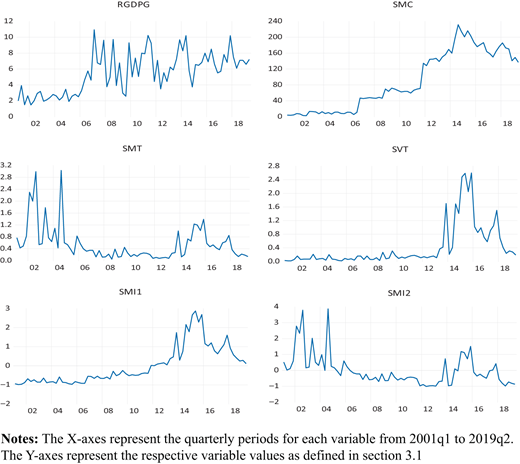
In Figure 1 quarterly data from 2001q1 to 2019q2 indicate the level of variables over time. Particularly RGDPG showed a slowed growth from 2001q1 to about 2006q3, after which the economy witnessed strong growth with larger cycles over the quarters indicating more dedicated struggles for growth. The SMC showed tremendous growth in stock market listing and value towards the end of 2014 after which there is a decline. This account for an awakening and indicatively conscious efforts to increase listing in the stock market. SMT shows the stock market soaked into more liquidity at the beginning of the period (2001) towards 2004, with periods of less liquidity in the middle towards 2012 which can be accounted for by less trading activities as witnessed in the SVT graph during the same period. The trading inactivity may be accounted for by less interests or opportunities to trade in the market. In the last portion of time (2013 to 2018), there is more signs of trading activities as indicated by high SVT. This may be accounted by the numerous developments in the stock market, some mentioned here are migration to new and efficient trading system, non-trading exchange venues established, removal of foreign investors limit conditions, establishment of new regulatory framework and start of trading through mobile phones (Section 2.4.2). These might have stimulated stock market development during this period as reflected in Figure 1.
4.2 Unit root tests
The ARDL modelling technique does not require unit root tests; however, it is crucial to run them to ascertain that all the variables to be analyzed are not integrated of order two, I (2) or higher.
This is essential because the ARDL model requires that all series be either or both integrated of order zero or/and one, that is I (0) and/or I (1), so that F-statistics produced by Pesaran et al. (2001) and Narayan (2005) are valid.
Two type of tests are used to establish the levels of integration of variables, both Dickey – Fuller-GLS test statistic and Phillips – Perron test statistic as developed by Elliot et al. (1996) and Phillips and Perron (1988), respectively. Results in Table 3 indicate mixed results, some variables are integrated at level as indicated by I (0), while others are integrated at order one as indicated by I (1). A few variables have trends identified as indicated by C, T. The results were robust and consistent in both tests as compared in Table 3.
Unit root tests
| Series | Constant (C), Trend (T) | Level | First difference | Decision |
|---|---|---|---|---|
| DF-GLS test statistics | ||||
| SMC | C | −0.337258 | −8.556582*** | I (1) |
| SMT | C | −2.0571** | −0.400642*** | I (0) |
| SVT | C | −1.644857 | −5.148417*** | I (1) |
| RGDPG | C | −0.320863 | −0.579641 | None |
| C, T | −3.834211*** | −4.780229*** | I (0) | |
| SM1 | C | −1.122444 | −11.22133*** | I (1) |
| SM2 | C, T | −3.709403*** | −13.19899*** | I (0) |
| Phillips–Perron test statistic | ||||
| SMC | C | −1.084343 | −8.681933*** | I (1) |
| SMT | C | −5.353267*** | −13.78995*** | I (0) |
| SVT | C | −2.777485 | −11.62618*** | I (1) |
| RGDPG | C | −4.833336*** | −15.15910*** | I (0) |
| SM1 | C | −1.745364 | −11.28637*** | I (1) |
| SM2 | C | −4.843556*** | −19.40760*** | I (0) |
Note:
*** and
**Indicate statistical significance at 1 and 5%; respectively
4.3 Long-run relationship and cointegration tests using autoregressive distribute lag model and bound testing approach
The cointegration relationship between stock market development proxies and real GDP growth is presented in Table 4. The ARDL bound testing procedure was employed, where tests were run and in each case each variable was treated as an independent variable in turn. The unrestricted models were estimated for each setting, model selection was done using the Aikaike Information Criterion (AIC) and Schwartz–Bayesian Information Criterion (SIC), results are not reported. The equations in levels are presented alongside their level of significance. The bound tests results are reported alongside in Table 4.
Long-run relationship and bound tests results
| Level equations | RGDPG | SMC | SMT | SVT |
|---|---|---|---|---|
| RGDPG | 35.37887 | −0.102007 | 0.047761 | |
| SMC | −0.02 | −0.002246 | 0.011059*** | |
| SMT | −0.950811** | −27.02825 | 0.487414*** | |
| SVT | 1.199294* | 12.06102 | 0.683616 | |
| Bound tests F-value | 12.26063*** | 2.662932 | 17.15819*** | 12.96939*** |
| 10% | 5% | 1% | ||
| Finite sample: n = 70 | I (0) | 3.615 | 4.235 | 5.663 |
| k = 3 | I (1) | 4.635 | 5.363 | 6.953 |
Notes:
Critical values for the bounds test: case V: unrestricted intercept and unrestricted trend, Narayan (2005, p. 1990);
***,
** and
*indicate statistical significance at 1, 5 and 10% respectively
There is statistical evidence for long-run dynamic relationship between SMT and SVT on RGDPG, that is when RDGP is the dependent variable, and there is statistical evidence for long-run relationship between SMC and SMT on SVT that is when SVT is a dependent variable. Conversely, SVT, SMT and SMC do not seem to dynamically relate with SMC and SMT when the later are dependent variables. Similarly, there is no evidence for long-run dynamic relationship when RGDPG is an independent variable against the respective stock market development variables. Based on bound tests results, there is cointegration relationship when RGDPG, SMT and SVT are taken as dependent variables. There is however no cointegration relationship when SMC is a dependent variable.
4.4 Short-run relationship and causality tests based on the error correction form
In this part, the short-run dynamics and causality tests based on the error-correction model are presented. The causality test is estimated using the lagged error-correction term and the significance of the independent variables. These results are reported in Table 5. First, evidences indicate that lagged differenced RGDPG and differenced SMT, and SVT cause RGDPG; lagged differenced SMC, differenced SVT and lagged differenced SVT cause SMC; differenced RGDP and lagged differenced RGDP cause SMT; and differenced SMC, SMT and lagged differenced SVT cause SVT.
Short-run dynamics and error correction form [ECT]
| ARDL (1, 0, 0, 0) | ARDL (1, 1, 0, 1) | ARDL (1, 1, 0, 0) | ARDL (1, 0, 0, 0) | |
|---|---|---|---|---|
| Selected model | RGDPG | SMC | SMT | SVT |
| ΔRGDPG | −0.669719 | −0.041944** | 0.02674 | |
| ΔRGDP (−1) | 0.209921* | 2.942641 | −0.042638*** | |
| ΔSMC | −0.015802 | −0.001862 | 0.006192*** | |
| ΔSMC (−1) | 0.935755*** | |||
| ΔSMT | −0.751216** | −1.736435 | 0.56684 | 0.272894*** |
| ΔSMT (−1) | 0.170822 | |||
| ΔSVT | 0.947537* | 11.72997*** | ||
| ΔSVT (−1) | −10.95511*** | 0.440119*** | ||
| C | 2.617564*** | −2.874065 | 1.018654*** | −0.242393** |
| @TREND | 0.087531*** | −0.038621 | −0.004376 | −0.010298** |
| ECT(t − 1) [Coeff.] Test [Value] | −0.790079*** [−7.158103]*** | −0.064245*** [−3.338165] | −0.829178*** [−8.470682]*** | −0.559881*** [−7.362094]*** |
| R2 | 0.472279 | 0.975796 | 0.453147 | 0.772348 |
| R2_aj | 0.432897 | 0.973189 | 0.403433 | 0.755359 |
| χ2 SC (1) | 1.130031 | 0.273446 | 0.397433 | 0.576645 |
| χ2 HET (1) | 0.832365 | 1.735584 | 2.278206 | 8.619493*** |
| F-statistic | 11.99222*** | 374.3577*** | 9.115086*** | 45.46186*** |
| Durbin – Watson stat | 2.093084 | 2.120476 | 1.999094 | 1.963985 |
Note:
***,
** and
*indicate statistical significance at 1, 5 and 10% respectively
Secondly, based on the lagged value of error-correction term (ECT), there is statistical evidence for convergence of stock market development on economic growth, the ECT coefficient is – 0.79 indicating fast convergence towards the long-run equilibrium from stock market development to economic growth. When SMC is the dependent variable, there is not statistical evidence for convergence running from economic growth to stock market capitalization. When SMT and SVT are the dependent variables, the lagged ECT terms are statistically significant, they both indicate convergence effects from economic growth to stock market development, the respective ECT coefficients are −0.82 and −0.56, which suggest that the long-run equilibrium from economic growth to stock market development in terms of depth and liquidity is moderate to fast depending on the aspect of the market that is being considered. So, at this level the evidences have been able to isolate short-run dynamics of stock market development identities, that is size, depth and liquidity on economic growth. Short-run dynamics of economic growth on stock market turnover (SMT) is evidenced, while there is lack of statistical evidences for short-run dynamics between economic growth and stock market capitalization (SMC) and stock market value traded (SVT).
4.5 SMI1, SMI2, RGDPG
From PCA analysis in Table 1, two stock market development indices were developed. SMI1 which is mainly composed of SMC and SVT identities as witnessed by high correlations among them in Table 2, while SMI2 is mainly composed of SMT. For a robust analysis, further ARDL and bound testing analysis for cointegration and long-run dynamics, as well as ECM for convergence and short-run dynamics analysis based on these two indices against RGDPG are conducted and summarized in Table 6. There is evidence for long-run dynamics for SMI1 and SMI2 on RGDPG as indicated by coefficients’ statistical significance, thus in the long-run dynamics, stock market development causes economic growth, both positively and negatively depending on the type of stock market identity involved, and the results are statistically significant. Specifically, both stock market size and depth made indices (SMI1) positively cause economic growth. Similarly, there is statistically significant evidence for long-run dynamics for RGDPG and SMI1 on SMI2, implying that both affect liquidity (SMI2) in the stock market setting. Particularly, economic growth affect stock market liquidity negatively, while both stock market size and depth (SMI1) affect liquidity positively. Based on bound tests, there is statistical evidence for cointegration between stock market development and economic development. While, there is also evidence for cointegration between economic growth and efficiency/liquidity (SMI2) in a stock market setting as indicated by the F-values in Table 6.
ARDL bound tests and ECT for RGDPG, SMI1 and SMI2
| Long run relationship, ARDL and bound tests results | ||||
| RGDPG | SMI1 | SMI2 | ||
| RGDPG | 0.222349 | −0.337290*** | ||
| SMI1 | 1.139416*** | 0.395901*** | ||
| SMI2 | −0.954387*** | −0.020214 | ||
| Bound tests F-value | 12.29329*** | 1.476818 | 9.544598*** | |
| k = 2 | 10% | 5% | 1% | |
| Finite sample: n = 70 | I (0) | 3.25 | 3.947 | 5.487 |
| I (1) | 4.237 | 5.02 | 6.88 | |
| Short run and error correction form [ECT] | ||||
| ARDL (1, 0, 0) | ARDL (1, 0, 1) | ARDL (1, 1, 1) | ||
| RGDPG | SMI1 | SMI2 | ||
| ΔRGDPG | 0.020781 | −0.071348** | ||
| ΔRGDPG (−1) | 0.264906** | −0.109312*** | ||
| ΔSMI1 | 0.837578*** | 1.015911*** | ||
| ΔSM1(−1) | 0.906537*** | −0.803857*** | ||
| ΔSMI2 | −0.701564*** | 0.218853*** | ||
| ΔSMI2(−1) | −0.220743*** | 0.464378** | ||
| C | 4.091239*** | −0.097105 | 0.969978*** | |
| ECT(t − 1) [Coeff.] Test [Value] | −0.735094*** [−6.160264]*** | −0.093463** [−2.135594] | −0.535622*** [−5.430335]*** | |
| R2 | 0.404167 | 0.888826 | 0.518206 | |
| R2_aj | 0.378261 | 0.882287 | 0.482251 | |
| χ2 SC (1) | 1.649922 | 2.363589 | 2.605154 | |
| χ2 HET (1) | 0.889510 | 3.769435 | 3.434376 | |
| F-statistic | 15.60141*** | 135.9138*** | 14.41272*** | |
| Durbin – Watson stat | 2.184826 | 2.453840 | 2.315884 | |
Notes:
Critical values for the bounds test: case III: unrestricted intercept and no trend, Narayan and Smyth (2005, p. 1988);
***,
** and
*indicate statistical significance at 1, 5 and 10% respectively
The short-run analysis and error correction model produce evidence for short-run dynamics between size and depth (SMI1) and economic growth. The ECT coefficient is −0.73, statistically significant and fast converging towards long-run equilibrium. While, there is no statistical evidence for long-run convergence of economic growth towards stock market size and depth (SMI1). Meanwhile, there are statistical evidences, as indicated by the moderate speed ECT coefficient (−0.53), for long-run convergence of economic development towards stock market liquidity (SMI2). Therefore, there is a full unidirectional causality from stock market development towards economic growth, and there is partial unidirectional causality from economic growth towards stock market development, especially represented by stock market liquidity (SMI2).
5. Conclusion and policy recommendations
The focus of this article was to assess stock market development and economic growth nexus. The results suggest that stock market development have both negative and positive causality for both short-run and long-run causality with economic growth. Conversely, economic growth only negatively affects liquidity both in the short run and in the long run. The results are consistent to the supply-leading causality hypothesis and in line to both Erdem et al. (2010) and Odhiambo (2011a, 2011b) findings. They show predominantly a unidirectional causality flow from stock market development to economic growth and finds partial causality from economic growth to stock market development, as represented by stock market turnover which proxied liquidity. It is thus recommended that regulators need to embark on improving stock market regulations and information flow because stock markets serve to improve domestic resources mobilization and allocation into productive sectors of the economy for growth channeling, more efficiently and effectively if policies, regulations and laws are effective.
As the results indicate that stock market size and depth positively promote economic growth, probably mostly through its primary issues, it is recommended that more doors need to be opened for more companies to list in the market. This way, the desired economic growth may be channeled through availability of equity capital. Conversely, as stock market liquidity affects economic growth negatively, confirming the results of Nurudeen (2009) in Nigeria, the negative sign could be due to stock market inefficiency channeled through: difficulties involved in trading shares resulting from high transaction costs, delays in share issuance, low predictability of trade, heavy insider trading and high levels of information asymmetry. On the other hand, stock market liquidity (SMT) which is the ratio of total stock market turnover to total stock market capitalization, which indicate a disproportionate increase of the later (denominator) value against the former (numerator) value over time, the ratio (SMT) (Figure 1), results in a decline against rising real GDP rates. This will consequently lead to a negative effect. The negative sign signals the presence of an inactive stock market trade unmatched to its comparatively growing stock market capitalization. Therefore, consistent to the recommendations of Naceur and Ghazouani (2007) on developing economies, Tanzania need to improve the functioning of the stock market to prevent negative impacts of an inefficient and ineffective stock market. Further, to realize a positive contribution of stock market liquidity on economic growth, despites market reforms done so far, the Tanzanian government needs to further improve on stock market trading mechanism, improve transparency and information flow, eliminate unnecessary taxes in the market, improve legal procedures and regulatory processes to curtail its present liquidity-evils on economic growth which may be channeling negative effects to economic growth through high transaction costs.
Consistent with Naik and Padhi (2015), the findings support causality of stock market development indicators on economic growth. This sheds evidence for the supply leading causality hypothesis of stock markets in determining economic growth. Conversely, findings partially support the demand leading causality hypothesis, where economic growth causes stock market development. It has been contended that government in developing economies have put emphasis on stock markets as avenues to facilitate private savings to finance state-controlled companies (Choong et al., 2010). This explain the present results especially because Tanzania has done more efforts recently to expand its stock market by promoting more listing of its state companies. Thus, it is recommended that the government needs to foster more development of capital markets to attract more equity capital flow into the economy both from private issuers and foreign issuers.
I sincerely acknowledge the availability of data for this study that was made available to me by Dar Es Salaam Stock Exchange (DSE) and Bank of Tanzania (BOT) through their internal database and website respectively. I equally acknowledge the anonymous reviewers from the "Review of Economics and Political Science" Journal who helped to critically improve this work. Errors and shortfalls if any are entirely mine.

