


Because of the significant differences in the features and requirements of specific products and the capabilities of various additive manufacturing (AM) solutions, selecting the most appropriate AM technology can be challenging. This study aims to propose a method to solve the complex process selection in 3D printing applications, especially by creating a new multicriteria decision-making tool that takes the direct certainty of each comparison to reflect the decision-maker’s desire effectively.
The methodology proposed includes five steps: defining the AM technology selection decision criteria and constraints, extracting available AM parameters from the database, evaluating the selected AM technology parameters based on the proposed decision-making methodology, improving the accuracy of the decision by adopting newly proposed weighting scheme and selecting optimal AM technologies by integrating information gathered from the whole decision-making process.
To demonstrate the feasibility and reliability of the proposed methodology, this case study describes a detailed industrial application in rapid investment casting that applies the weightings to a tailored AM technologies and materials database to determine the most suitable AM process. The results showed that the proposed methodology could solve complicated AM process selection problems at both the design and manufacturing stages.
This research proposes a unique multicriteria decision-making solution, which employs an exclusive weightings calculation algorithm that converts the decision-maker's subjective priority of the involved criteria into comparable values. The proposed framework can reduce decision-maker's comparison duty and potentially reduce errors in the pairwise comparisons used in other decision-making methodologies.
1. Introduction
Almost 40 years have passed since Charles Hull invented the first 3D printer in 1983 (Hull, 2015). Since then, 3D printing [also known as additive manufacturing (AM)] has become a technology that cannot be ignored in today’s manufacturing decisions. AM refers to a technology that creates parts by adding materials layer by layer. This process can transfer a product designer’s idea into a physical product more rapidly and simply than traditional manufacturing processes. AM also has some other advantages over traditional manufacturing, such as unlimited geometry complexity, flexible inventory, shorter manufacturing lead times and lower costs for low-volume production (MacDonald and Wicker, 2016; Savolainen and Collan, 2020). It has been widely adopted in such areas as rapid prototyping, medical implants, automotive, aerospace, sports and construction industries (Tofail et al., 2018). Sharing the same core concept of adding material successively as the first 3D printer, many new 3D printing technologies have been developed. Based on their characteristics, these technologies are generally classified into seven categories, all of which are discussed in more detail in the following section: binder jetting (BJ) (Do et al., 2017; Gonzalez et al., 2016); direct energy deposition (DED) (Stender et al., 2018; Javidani et al., 2017); material extrusion (ME) (Dhinakaran et al., 2020; Weng et al., 2016); material jetting (MJ)(Yap et al., 2017; Vdovin et al., 2017); powder bed fusion (PBF) (Khairallah et al., 2016; Allison et al., 2019); sheet lamination (SL) (Norfolk and Johnson, 2015; Qi Zhang, 2018; Bhatt et al., 2019); and vat polymerization (VP) (Bártolo and Gibson, 2011; Yang et al., 2019). Although some AM methods are mature, the AM industry is still thriving; many 3D printing processes are currently available, and more are emerging and developing, such as metal fused deposition modeling (metal FDM), ARBURG plastic freeforming and multi jet fusion (Ramazani and Kami, 2022; Mele et al., 2022; Avanzini et al., 2022). When selecting a 3D printing method for a specific application, decision-makers need to consider many aspects, such as mechanical, chemical and physical properties, 3D printers’ build volume, postprocessing, resolution, environmental impact, production time and cost. Rigorous consideration of these decision variables is crucial to optimizing the complicated AM technology selection process. Many researchers have addressed the important decision parameters involved in the AM selection process and facilitated that process by developing some advisory tools based on different multicriteria decision-making methods. These methods include analytic hierarchy process (AHP) (Lokesh and Jain, 2010; Armillotta, 2008; Kadkhoda-Ahmadi et al., 2019; Zaman et al., 2018; Mançanares et al., 2015; Liu et al., 2020), analytic network process framework (ANP) (Vimal, 2016), technique for order preference by similarity to ideal solution (TOPSIS) (Byun and Lee, 2005), VlseKriterijuska Optimizacija I Komoromisno Resenje (VIKOR) (Liao et al., 2014), fuzzy AHP (Zhou and Chen, 2010), fuzzy logic (Khrais et al., 2011), fuzzy TOPSIS (Vahdani et al., 2011), fuzzy VIKOR (Vinodh et al., 2014), fuzzy information aggregation operators(Qin et al., 2020), fuzzy decision (Mahesh et al., 2005), graph theory (Rao and Padmanabhan, 2007), hybrid decision-making tools (Anand, 2018; Borille et al., 2010; Zhang, 2014; Wang, 2018), fuzzy axiomatic design (Zheng et al., 2017) and posteriori articulation of preferences approach (Wang, 2017).
A common misconception regarding these tools, however, is that the precise weighting of various criteria is easy to obtain from decision-makers. Yet, precisely reflecting decision-maker's requirements numerically is not a straightforward matter, and translating decision-maker's preferences into numbers in complicated decision-making cases often leads to errors and biases in weighting that can skew the final selection result. The new decision-making tool described in this article includes a special process for calculating the weightings of the criteria that more accurately translates the decision-maker’s demands into calculable numbers.
2. Literature review
This section reviews the current literature on existing and commercial AM technologies, raw materials and decision-making tools.
2.1 Additive manufacturing technologies
This section briefly introduces the diversity of the AM processes and reveals the necessity of decision-making tools under complicated circumstances, while not all the features are discussed. Certain features should be covered when critical for a specific AM process selection. For example, in the design stage, the optimization of parts geometries is essential and could affect the environmental impacts(CHEN et al., 2016; Xiong and Chen, 2021; Mele et al., 2019a). However, they are not considered for some cases when the decision-maker does not use them to make a decision.
Currently, the most popular 3D printing options are BJ, DED, ME, MJ, PBF and VP. These six AM processes dominate today’s 3D printing market and a seventh, SL, is widely used for rapid prototyping. Each 3D printing option includes several subsets of techniques, many of which are similar across technologies, even though each technology also has unique features that reflect its specific principles and lead to differences in the attributes of the printed parts.
In the first of these processes, BJ is an AM method that drops a liquid bonding agent to bind powder particles. A BJ printed part is developed by strategically moving the print head and depositing the bonding agent (Meteyer et al., 2014). The parts printed from BJ process do not need to be anchored on a build plate, which saves powder material and can be critical when printing with costly materials. A common application of BJ is producing a ceramic part. Recent studies show that the bulk density of BJ printed parts has improved (Díaz-Moreno et al., 2019; Wheat et al., 2018), approaching fully dense stainless steel parts and suitable for metallic foam structures. BJ's advantages also include a high resolution that provides the possibility of creating detailed finishes.
DED processes use focused energy to melt materials directly when adding them layer by layer to the workpiece. The raw materials are in the form of a wire or powder, and the concentrated energy source is typically a laser, electron beam or arc light (Gibson et al., 2015). More materials are involved in DED printing than in some of the other processes. The fatigue performance of DED printed parts has also improved (Gordon et al., 2019). Recent research has shown that DED’s powder capture efficiency changes as the working distance changes and can improve as the material’s surface temperature increases (Haley et al., 2019).
ME is similar to the traditional plastic extrusion process in that both processes need to melt the material being molded. A common ME technology is FDM, where a nozzle will deposit the material in a soft and semiliquid state onto a build platform, a small amount each time to produce the 3D product. The production rate is lower than that in the extrusion process, but ME can produce more complex parts. Generally, the cost of ME is the lowest among all the AM technologies, contributing to its being the most popular 3D printing method. Considerable efforts have been dedicated to creating new materials and improving the printing speed, process parameters and thermal activities of the FDM process (Luo et al., 2020; Costa et al., 2017).
MJ is a group of AM processes that selectively jet liquid raw materials. If those materials are plastics, they are usually light-sensitive and are ultraviolet (UV)-cured right after deposition. MJ’s printing speed is faster than many AM technologies (Gaynor et al., 2014), and it has the ability to print different materials simultaneously. This feature offers great opportunities to create new materials for various applications and to print microstructures (Cheng et al., 2020; Dilag et al., 2019). For example, some researchers have employed MJ’s ability to simultaneously print different materials to print fluid circuit components (Sochol et al., 2016).
PBF is a series of AM technologies that places a thin layer of powder raw material on a platform called the powder bed. After fusing the material at selected positions, another thin layer of powder material is spread over the previous layer, a process that is repeated to print the 3D part. The energy source can be a laser, electron beam or infrared lamp (Mele et al., 2019b). Postprocessing is usually necessary for PBF, such as blowing away residual powders or cutting the printed part off the building platform (King et al., 2014). The different microstructures cause the bulk anisotropy of PBF parts (Lowther et al., 2019), and recent research revealed that this bulk anisotropy can be reduced by applying a large beam width (Shi et al., 2020).
VP is the process where the polymerization of liquid photosensitive resin takes place in a vat. The resin can undergo a chemical change initiated by either a laser or arc light source to form a solid 3D part. There are several types of VP, such as stereolithography, digital light process and continuous liquid interface product (Tumbleston et al., 2015). Recent research indicates that for certain parts geometries, such as length/diameter ratio is higher than 2, the “bottom-up” and “top-down” print methods could lead to different results. For example, “bottom-up” parts may have more defects(Santoliquido et al., 2019). Table 1 summarizes the major pros and cons of these AM technologies.
Comparison of advantages and disadvantages of main AM technologies
| AM Technologies | Advantages | Disadvantages |
|---|---|---|
| VP | Low cost, high-detail surfaces, high printing speed | Low mechanical properties, parts degrade over time, limited materials |
| FDM | Low cost, easy to use, simple post-processing if necessary | Low mechanical properties, low resolution, low accuracy |
| BJ | No support structures needed, high resolution, cost effective | Difficult to print full-density parts, low mechanical properties, high porosity |
| MJ | High accuracy, high printing speed, full-color parts | Costly, low mechanical properties, parts degrade over time |
| DED | Large build size without support structures, high printing speed with full density, cost effective | Low resolution, low accuracy, rough surface |
| PBF | Full-density parts, high mechanical properties, high resolution | Expensive, low printing speed, post-processing required |
2.2 Additive manufacturing materials
This section introduces the AM materials typically used for the mature AM solutions that are the scope of this study. Material can affect the selection of AM technology for a specific application because a process can often produce several types of materials. Sometimes, when the decision-maker has already designated the material, some AM processes can be canceled from the alternative list if they are not capable of printing the selected material. In addition, the same material printed by different processes could lead to a significant difference in the parts. This study evaluates this point when required decision-making data is collected for a specific application. A material’s performances under different AM processes are reflected in collecting the corresponding data.
The first of these materials under the scope in this study are polymers that have many advantages that other materials cannot match, such as their lightweight, high strength-to-weight ratio and resistance to corrosion. Thermoplastics are widely used for FDM, including polylactic acid, acrylonitrile butadiene styrene, acrylonitrile styrene acrylate and nylon 12 (Lee et al., 2017). Thermosets, which are the main materials used for MJ and VP, must be UV-curable and in a liquid state; normal AM thermosets are epoxies, acrylates and acrylics. The parts printed from these photosensitive thermosets, however, degrade over time and start to lose some of their mechanical properties (Bourell et al., 2017).
Metals and alloys are popular engineering materials because of their excellent mechanical properties, such as tensile strength, hardness and elongation. Typical metal materials for AM are stainless and tool steel, aluminum alloys, titanium and its alloys and nickel-based alloys (Ngo et al., 2018; Herzog et al., 2016). The quality of 3D printed parts is determined by powder quality, whose flowability, particle size and surface morphology are influenced by metal powder manufacturing processes (Vock et al., 2019). It is also easier to change the composition of the parts by changing the ratio of the mixed alloy powders in AM than in traditional manufacturing processes (DebRoy et al., 2018). Researchers have been improving the mechanical properties of metal AM materials and creating new metal AM materials (Carroll et al., 2015; Shafranek et al., 2019).
Ceramic materials have great resistance to chemicals, low electrical conductivity and high strength, although they are brittle. All of the main AM technologies discussed above can print ceramic parts (Wang et al., 2019a) through direct or indirect ceramic printing methods. Direct methods sinter the material directly to form a part, while indirect methods print a green body and then sinter it (Chen et al., 2019). Ceramic AM solutions can print a wide range of ceramics, such as boron carbide, alumina and zirconia (Yang and Miyanaji, 2017).
2.3 Multicriteria decision-making tools
Multicriteria decision-making (MCDM) tools are designed to help decision-makers solve complex AM process selection problems. This section briefly reviews current MCDM methods, from which our research adopted some concepts to create a novel pairwise comparison MCDM framework that can translate decision-maker's subjective priorities more efficiently.
Among current methods, the AHP uses a pairwise comparison in complex decision-making processes (Saaty, 2001; Saaty, 1990). The advantages of AHP are its modeling of a real problem in a hierarchical manner, ability to translate verbal judgments and guaranteed consistency (Ishizaka and Labib, 2011). A recent study has shown that combining a problem structuring approach with the AHP process can improve the reliability of AHP assessments (Marttunen et al., 2017).
The best worst method (BWM) uses a unique algorithm to determine the weights of criteria, picking and using the best and the worst criteria based on their desirability (Rezaei, 2016; Rezaei, 2015). The benefits of BWM include its improved consistency, relative ease to use and ability to combine smoothly with other MCDM methods (Rezaei, 2015). Created by Jafar Rezaei in 2015 (Rezaei, 2015), the BWM is a relatively young MCDM tool but a robust one that has been used in many areas, such as the airline industry, supply chain assessment and education (Badri Ahmadi et al., 2017; Gupta, 2018; Salimi and Rezaei, 2016).
Using linear normalization, VIKOR is good at comparing alternatives with opposing criteria and different units (Opricovic and Tzeng, 2007). Because of its ability to handle complex multicriteria optimization, VIKOR has been widely used in the areas of renewable energy, sustainability (Mardani et al., 2016) and material selection (Jahan et al., 2011).
The ANP is an extension of the AHP that considers component dependence and feedback. The weightings delivered by the ANP algorithm assess the interaction of the criteria involved (Saaty and Vargas, 2013). ANP has been applied in such areas as human resources management, energy management, business and financial management, design and engineering and manufacturing systems (Kheybari et al., 2020).
Preference ranking organization method for enrichment evaluations (PROMETHEE) offers simplicity, clearness and stability but does not elaborate the weightings of criteria (Brans et al., 1986), a weakness that can be improved by adopting the weightings process from other decision-making tools. PROMETHEE can also be enhanced by applying some features of AHP (Macharis et al., 2004). According to a review paper, PROMETHEE has been applied in such areas as environment management, hydrology and water management, business and financial management, chemistry, logistics and transportation and manufacturing and assembly (Behzadian et al., 2010).
TOPSIS is among the most widely used multicriteria decision-making solutions, especially within the supply chain and logistics, design, engineering and manufacturing systems (Behzadian et al., 2012; Zyoud and Fuchs-Hanusch, 2017). A comparison of fuzzy TOPSIS and fuzzy AHP in a supplier selection scenario found that fuzzy TOPSIS had a better performance in most cases (Lima Junior et al., 2014).
The introduced MCDM tools have their special strengths and limitations, as shown in Table 2. They have been applied to solve decision-making problems across a wide range of fields; some of them are used to select AM processes and demonstrate the feasibility. Some of these MCDM methods rank the alternatives through pairwise comparisons. However, when the pairwise comparisons are conducted, the certainty of each pairwise comparison is not collected or used. This information, the direct certainty of every pairwise comparison, is a part of the decision-making process and can have an effect on the final selection result. This work proposed a MCDM tool that applies this direct certainty in the decision-making process to evaluate the alternatives, especially for the selection of AM process. To the best of our knowledge, no work has been performed that collects the direct certainty. The proposed tool gathers the direct certainty from the decision-maker and interprets this information to apply in determining criteria weightings, which is a primary step among decision-making tasks. It is suitable for decision-making tasks when uncertainty is a critical factor affecting the decision.
Brief summary of the advantages and disadvantages for introduced MCDM tools
| MCDM tools | Advantages | Disadvantages |
|---|---|---|
| AHP | Using a hierarchy system to evaluate tangible and intangible factors to achieve a structural solution | Large number of comparisons when the problem is complicated |
| BWM | High consistency for pairwise comparisons, yet few steps, and judgments | It employs parsimonious AHP, which may cause unknown side effects |
| VIKOR | Obtaining compromise solution at the beginning of system design | Impropriate preference ranking may occur because of the use of VIKOR’s maximum group utility calculation equation |
| ANP | The interdependence of alternatives is included by a network structure | The different effects between clusters could be neglected |
| PROMETHEE | The criteria does not need to be proportionate; easy to apply | Additional tool is needed for weighing the criteria preference |
| TOPSIS | Simple process based on logic of human choice study | The relevant importance of solution distance is not considered |
3. Methodology
Pairwise comparison can be used in many MCDM methods to determine the weightings of criteria, such as AHP, BWM and VIKOR. When a pairwise comparison is made, the corresponding certainty of this judgment appears. This direct certainty reveals the decision-maker's reliability of the judgment. Direct certainty is valuable information for decision-making because it shows the reliability of the judgments. When a set of pairwise comparisons are conducted, some pairwise comparisons could have high certainty, which means the decision-maker feels more confident about these judgments. Because the judgments with high certainty express the decision-maker’s preference more precisely and clearly, they should play a more important role, compared with judgments with low certainty. If there is a scale to measure the direct certainty, the certainty can be required directly from the decision-maker when the comparisons are executed. The direct certainty is critical to the weighting calculation, but it was ignored before, or there was not an effective measure tool for the direct certainty. A measuring tool for direct certainty is first developed for this purpose, and the weightings with the consideration of the judgments’ direct certainty are calculated in this methodology.
In addition, the demands from decision-makers can be classified into two categories: constraints and criteria. Constraints are the primary demands that must be met. Criteria are the demands that are not mandatory but can be used to judge. Constraints can screen the alternatives, and criteria can be used to compare the screened alternatives. A characteristic can be a constraint and a criterion at the same time. The purpose of classifying demands is not only to screen the alternatives but also to delete the constraints from pairwise comparisons. Because in some close comparisons, unnecessary criteria can change the final selection result. Meanwhile, the clarification of criteria and constraints reduces the following pairwise comparison load.
For these reasons, a novel and comprehensive framework is proposed to solve the AM process selection problem called the certainty pairwise comparison (CPC) decision-making tool. This method first uses a new measuring tool to determine direct certainty and then calculates the weightings with the consideration of the judgments’ direct certainties. The framework also constructs a system that can reduce a decision-maker's comparison duty and potentially reduce the errors of a decision-maker’s pairwise comparisons.
3.1 Certainty pairwise comparison decision-making steps
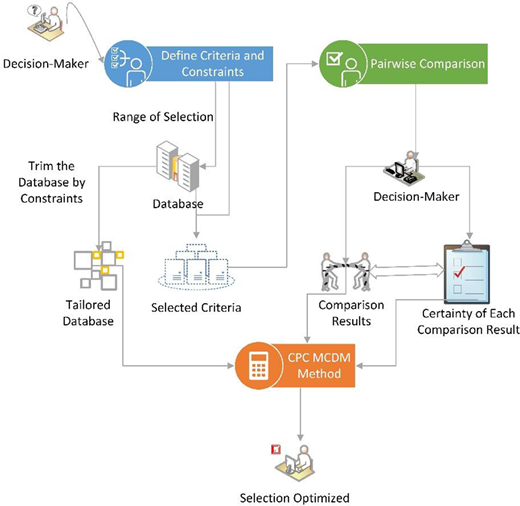
Figure 1 shows the steps of the proposed CPC decision-making process. The first step is defining the decision criteria and constraints, during which a decision-maker selects the range of desired parameters, such as the printing speed and the tensile strength of the part. If a constraint is numerical, at least one of the maximum or minimum quantities is mandatory. Next, based on the selected constraints and criteria, the related data is extracted from the database, which includes all the information on AM technologies and materials to construct a tailored subdatabase. In the third step, a decision-maker performs the pairwise comparisons of the selected criteria and, by applying the direct certainty measure tool, determines the certainty of each comparison. In the fourth step, by applying the CPC weighting calculation method, the weightings can be acquired with the contribution of the judgments’ certainties. Finally, the CPC suggests the optimized solution based on the integration of the weightings and the required criteria information.
3.2 Theoretical backgrounds
Assume there are m criteria. Once the pairwise comparisons are made, a result matrix A is obtained as in equation (1):
where aij is the preference of criterion i to j, it can be obtained based on a pairwise comparison scale, such as Saaty’s (1988) scale. If aij = 1, that means that i and j have the same importance; if aij > 1, i is more important than j. The certainty of an arbitrary judgment aij is defined as the reliability of the pairwise comparison of criterion i to j, represented by cij. The certainty, which must be assigned by the decision-makers who make the comparison, quantitatively reflects the reliability of a judgment. The certainty scale of values is shown in Table 3.
Judgment certainty scale
| Certainty of a judgment (%) | Term | Description |
|---|---|---|
| 100 | Certain | The reliability of a judgment is the highest |
| 80 | Confident | The decision-maker feels confident about this result; the judgment is reliable |
| 60 | Uncertain | The decision-maker has some doubt about the judgment, but it is still reliable |
| 40 | Unconfident | The reliability of the judgment is low |
| 20 | Hesitant | The judgment is not reliable |
All the values between 20% and 100% are acceptable, depending on the certainty of a judgment. For example, if the decision-maker is more than 80% but less than 100% confident in a judgment, any value between 80% and 100% can be assigned based on the certainty level. If certainty is lower than 20%, a suggestion of reconsidering this judgment will be given. These certainty values make up the certainty matrix C, which has the same dimension as result matrix A.
Equation (2) is the certainty matrix C:
where the arbitrary element cij corresponds to the certainty of the judgment aij.
Letting represent the optimized weightings, which are also decision variables deciding on weights based on preferences and their certainty. The absolute difference between a decision-maker’s comparison result and optimized weighting comparison is expressed as . With the consideration of the certainty, the absolute difference needs to be multiplied by the corresponding certainty , to get the convinced absolute difference, that is, . The objective of CPC is then to minimize the sum of each convinced absolute difference z, and the optimized weightings can be determined by solving equation (3):
Subject to
As for the AM selection, some criteria are measurable in numerical terms, such as Young’s modulus. These values are proportionally condensed under a 1–10 scale to compensate for the effect of the criteria’s different units. For some other criteria, when the numerical values are too small to compare with others, this process can be proportionally enlarging within a 1–10 scale. The condensed/enlarged values are expressed as Ruv, where u represents the numerical value of a criterion and v for an alternative. More details will be given in the next paragraph. However, for some criteria, Ruv is not available, such as the complexity of postprocessing. To optimize the AM selection, Ruv for the criteria such as postprocess complexity is also obtained by using the introduced CPC certainty method (comparing the alternatives in regard to the unavailable criteria). Finally, the overall score of an alternative v can be determined by equation (4):
3.3 Consistency
Consistency is a key factor in evaluating MCDM tools. A high consistency means a reasonable application for a MCDM method. However, as a direct certainty embedded method, CPC combines its pairwise comparison process with other MCDM tools. It will not affect the consistency, although it will lead to different criteria weightings and final alternative ranking. Because CPC is a new weighing MCDM tool, it does not change the pairwise comparison sequence, and it will inherit the consistency from the MCDM tool combined with.
3.4 Database
The AM processes database includes the characteristics of each potential AM technology and the features of the corresponding AM materials. The information on which the initial selection of material/process combinations is made should be available during the early decision-making process.
The database is still under development. However, the data that supports the following case studies is available. Please contact the authors to acquire access if necessary. Further, the data is tailored for each case in the following case studies. For example, because of the low production volume, the initial cost of printers is not considered, despite the fact that it can be essential for other situations. The 3D print parts can be purchased from 3D printing services companies, especially when low production volume. To get precise selection results, only related data is required for each application of the CPC AM selection. The information that is mandatory should rely on the decision-maker requirements.
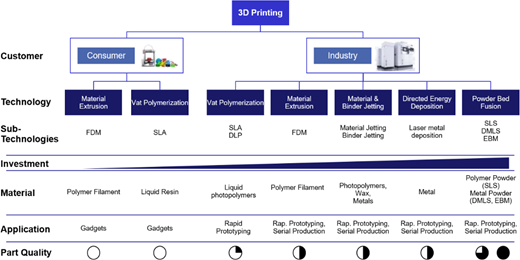
The selection of appropriate processes for the AM of a particular part is based upon a matching of the required attributes of the part and the various process capabilities. Once the overall function of a part is determined, a list can be formulated giving the essential geometrical features, material properties and other attributes that are required. Figure 2 summarizes some commercial AM processes and their characteristics.
4. Case study
This section consists of two case studies: investment casting patterns and an adjustable pasta drying rack prototype to validate the CPC selection tool. The decision-maker’s specific requirements for each case study decide the selection criteria and constraints. The related data is collected to perform the CPC method separately. Finally, the AM technologies are ranked, and the most appropriate technology is recommended.
4.1 Investment casting patterns
3D printing technologies have gradually become involved in investment casting, a manufacturing process based on lost-wax casting that can produce intricate near net-shape parts with isotropic properties. Investment casting employs master patterns that are similar in size to the final parts to make molds for the parts. The lead time for producing the pattern molds increases as their complexity increases, and the cost of the molds is high, especially when production volume is low. It is also difficult to produce highly complex molds, which limits the shape of the final products. AM is a good solution for this problem, as it can skip the production of molds and print the patterns directly. As a result, AM technologies are able to print highly complicated parts at a lower cost when production volume is low. In addition, AM offers greater dimensional accuracy and can reduce casting defects by 99.5% (Wang et al., 2019b).
Figure 3 illustrates the steps involved in the conventional investment casting process (Serope Kalpakjian, 2008). Seven steps are used to produce the investment casting mold. Molten metal is then poured into the mold in Step 8. After solidification, the mold is removed and the metal takes the shape of the mold.
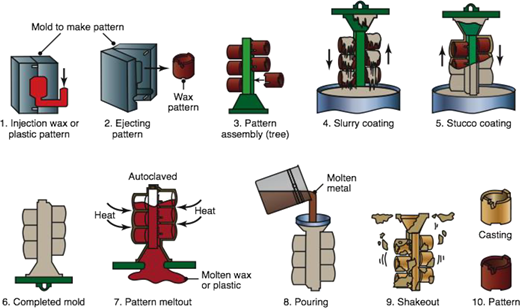
Schematic illustration of main steps in the conventional investment casting process
Schematic illustration of main steps in the conventional investment casting process
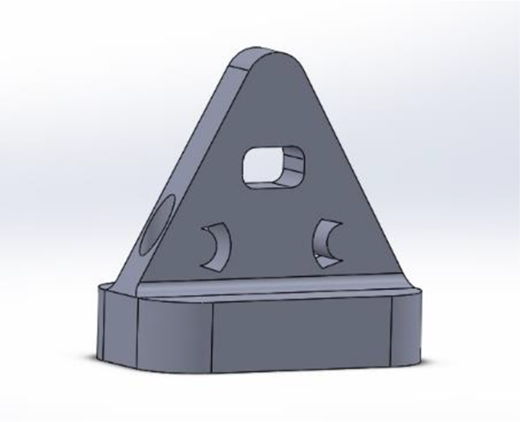
The illustrated part shown in Figure 4 is a customized joining structure that supports and connects machine components, is intended to be produced using investment casting patterns through a 3D printing process. Using the Visual Basic for Applications in MS Excel, the CPC method is developed to select the most suitable AM solution based upon the customer’s requirements. The data and CPC model for this case study are available; please contact the authors to acquire if needed.
For this application, the printed patterns will be melted and burnt out after making the molds (i.e. Step 7 in Figure 3). To ensure that the melted pattern material can flow out of the casting molds, the customer indicated that its melting point should be lower than 1,400°F because the customer’s furnace temperature ranges to 1,500°F. The 100°F difference is selected to guarantee the flow and removal of the patterns. Because the customer did not want postprocessing to be complicated, the surface finish and dimensional accuracy of the process are critical to the selection process. The surface finish is measured by Ra, and the dimensional accuracy is measured by the dimensional tolerance ±a%.
Three different scenarios were developed to examine the performance of the proposed AM solution under different circumstances. The proposed constraints and criteria for each scenario are presented in Table 4. For example, in Scenario 1, the melting point is treated as both a constraint and a criterion, but in the other two scenarios, it is only considered as a constraint. Also, the printing speed is a constraint in Scenario 1 but a criterion in Scenario 2.
Required constraints and criteria for the AM application selection
| Property | Description | Scenario 1 | Scenario 2 | Scenario 3 |
|---|---|---|---|---|
| Melting point | It must be lower than 1,400°F as required by the foundry company. The low melting point assists the flow of the melting pattern material | Constraint and Criterion | Criterion | Criterion |
| Young’s Modulus | This reflects the pattern’s stiffness. A high Young’s modulus can improve the precision of the molds made by the patterns | Criterion | Constraint | Criterion |
| Surface finish | The better surface finish of the patterns leads to a smoother surface of the cast parts | Criterion | Criterion | Criterion |
| Printing speed | This affects the production time of the final parts | Constraint | Criterion | Constraint and Criterion |
| Dimensional accuracy | This relates to the utilization of some machining processes that can improve dimensional accuracy | Criterion | Criterion | Criterion |
| Autoignition temperature | A low autoignition temperature facilitates the removal of the patterns in the investment casting process | Criterion | Criterion | Constraint |
| Cost | This refers to the cost of pattern production | Criterion | Criterion | Criterion |
The CPC method can be combined with many pairwise comparison tools, such as the classic AHP, where the certainty of each comparison is applied to the weighting calculation. In this application, the BWM was selected because it is a brief process with high consistency. The BWM requires the selection of the most and least appropriate criteria and is used by the customer to compare the importance of each criterion with that of other criteria in a particular sequence. A decision-maker conducted the pairwise comparison following the BWM pairwise comparison order and provided certainty in their decision. The comparison results and the certainties are presented in Table 5. Each comparison needs to be executed carefully.
Certainty pairwise comparisons with the best worst method
| (The best) Criterion | Criteria | Importance | Certainty (%) | (The worst) Criterion | Importance | Certainty (%) |
|---|---|---|---|---|---|---|
| Scenario 1 | ||||||
| Dimensional accuracy | Autoignition temperature | 7 | 90 | Melting point | 2 | 90 |
| Cost | 4 | 100 | 3 | 80 | ||
| Surface finish | 3 | 90 | 6 | 70 | ||
| Dimensional accuracy | 1 | 100 | 8 | 60 | ||
| Young’s Modulus | 6 | 80 | 2 | 60 | ||
| Melting point | 8 | 60 | 1 | 100 | ||
| Scenario 2 | ||||||
| Cost | Autoignition temperature | 9 | 90 | Autoignition temperature | 1 | 100 |
| Cost | 1 | 100 | 9 | 80 | ||
| Surface finish | 6 | 90 | 2 | 90 | ||
| Dimensional accuracy | 5 | 90 | 2 | 90 | ||
| Printing speed | 3 | 80 | 5 | 80 | ||
| Melting point | 8 | 70 | 2 | 100 | ||
| Scenario 3 | ||||||
| Printing speed | Young’s Modulus | 8 | 100 | Cost | 2 | 90 |
| Cost | 9 | 80 | 1 | 100 | ||
| Surface finish | 3 | 90 | 5 | 100 | ||
| Dimensional accuracy | 4 | 90 | 2 | 80 | ||
| Printing speed | 1 | 100 | 9 | 80 | ||
| Melting point | 7 | 60 | 2 | 70 | ||
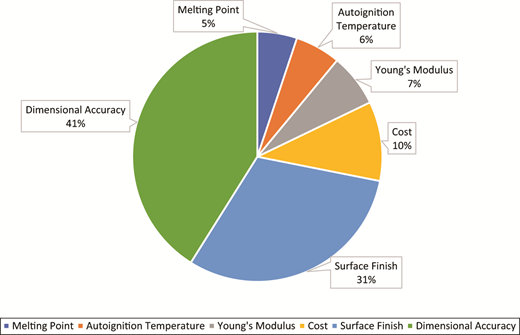
By applying equation (1), the weight of each criterion can be calculated. As shown in Figure 5, which illustrates the breakdown in importance for Scenario 1, dimensional accuracy was the most dominant criterion in this application, contributing up to 41% of the whole importance. The surface finish formed 31% of the total importance, which is predictable given that the surface finish and dimensional accuracy of the patterns directly affect the quality of the final parts created by the investment casting process.
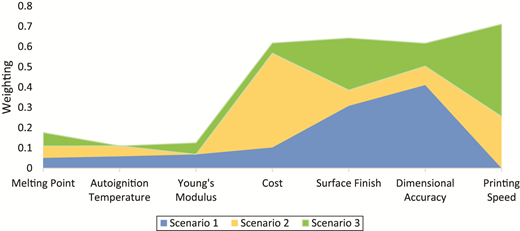
The collected numerical data were scaled to the same dimension, so the attributes with different units were comparable. We converted every nonnumerical attribute to numerical data for the purposes of this analysis. After determining the relevant criteria for this application, the tool created a tailored datasheet that contained only the related data. For this application, those data included printing speed and material costs, which can be costly, even though this is not a high-volume production situation. Printing speed not only affects the production rate, but a very high printing speed may have a negative effect on the accuracy and surface finish of the final part(Galantucci et al., 2015; Miyanaji et al., 2018). While other properties are not always decisive, they can also sway the ranking result in a specific scenario. Figure 6 shows the related attributes’ performance during the CPC AM selection, which illustrates the importance of each criterion in different scenarios. In Scenario 1, the surface finish and dimensional accuracy are critical, but the cost is the most important for Scenario 2. For Scenario 3, printing speed shares the highest weight.
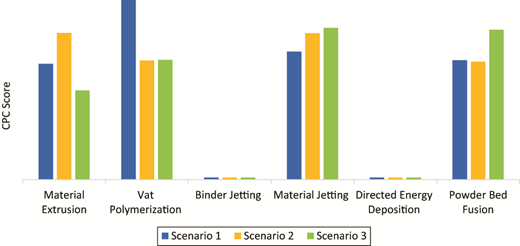
The optimized ranking results produced using equation (4) are shown in Figure 7, where the x-axis stands for each process under different scenarios and the y-axis stands for the CPC score. They show that in Scenario 1, the most appropriate method for printing the joining structure patterns would be VP, which can produce high-dimensional accuracy parts with a smooth surface finish. The recommended method for Scenario 2 is MJ technology, which can print wax parts that, in investment casting, will leave less residual in the mold after burning. Also, for Scenario 2, it shows that ME can also be a great solution where cost is a major issue for the decision-makers. The high printing speed of MJ makes it leading in the results for Scenario 3. The scores for BJ and directed energy deposition are extremely low because the low burning temperature materials used for those methods are still under development. The results also illustrate that plastic PBF shows potential for investment casting pattern making.
4.2 Adjustable pasta drying rack prototype
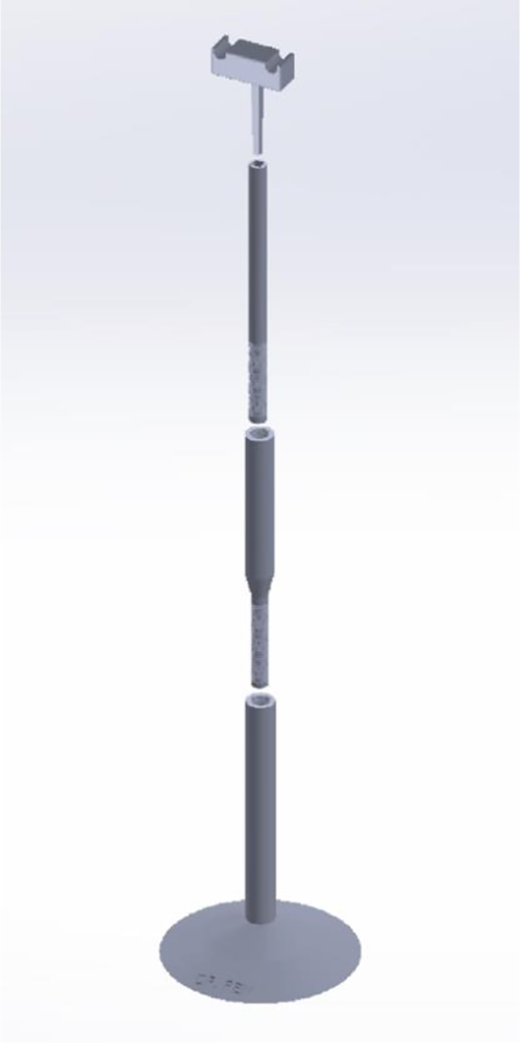
Rapid prototyping is still a primary application of AM technologies, even AM is getting more and more involved in production. The second case study is on producing a prototype for an adjustable pasta drying rack. As shown in Figure 8, the adjustable pasta drying rack can adjust the height by the threads on the body. Other advantages over traditional rack are it can disassemble when not used, saving the kitchen room and making it easy to clean. The decision-maker indicates that the mechanical properties are not crucial for this prototype. The essential criteria are surface finish, cost and accuracy. Because only one prototype is needed, it is not recommended to buy a 3D printer. The main cost of this application is the 3D printing material cost. Further, the final product will be made of plastic, so the material of this prototype is also plastic.
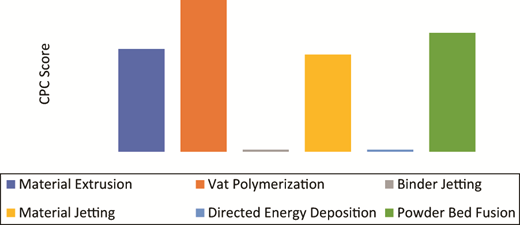
The CPC pairwise comparison is conducted following the BWM’s sequence, and the comparisons and CPC weightings are listed in Table 6. The VP is the leading technology for the pasta drying rack prototype, as shown in Figure 9, where the y-axis stands for the CPC score.
CPC of drying rack prototype
| (The best) Criterion | Criteria | Importance | Certainty (%) | (The worst) Criterion | Importance | Certainty (%) | Weighting |
|---|---|---|---|---|---|---|---|
| Cost | 3 | 80 | 3 | 90 | 0.28 | ||
| Surface finish | Surface finish | 1 | 100 | Printing speed | 7 | 100 | 0.42 |
| Dimensional accuracy | 5 | 90 | 2 | 90 | 0.24 | ||
| Printing speed | 7 | 100 | 1 | 100 | 0.06 |
5. Comparing results with other decision-making tools
To demonstrate the influence of CPC, a comparative study is done by applying the results of the pairwise comparisons from the casting case study. Both CPC and BWM applications used the same normalization method. As shown in Table 7, the ranking results for CPC and BWM are listed for three scenarios. The employment of direct certainty affects the BWM ranking results, especially in competitive ranking, where some alternative scores are close, such as Scenario 2, the most suitable AM process is changed from MJ to ME. For Scenarios 1 and 3, the alternative scores change, but the rankings do not change much because some alternatives have stronger dominant potential under certain circumstances. Table 7 applies the same pairwise comparisons, and the corresponding certainty is added for CPC. It demonstrates how the ranking results will change with the same pairwise comparisons using certainty in decision-making and proves the effectiveness of CPC in MCDM. Similar changes could happen when CPC combines with other MCDM tools that use pairwise comparisons to find the weightings of criteria.
CPC ranking and BWM ranking based on the casting case study pairwise comparison
| Ranking | Scenario 1 | Scenario 2 | Scenario 3 | |||
|---|---|---|---|---|---|---|
| CPC (score) | BWM (score) | CPC (score) | BWM (score) | CPC (score) | BWM (score) | |
| 1 | VP (8.281) | VP (8.077) | MJ (6.761) | ME (6.949) | MJ (7.006) | MJ (6.906) |
| 2 | MJ (5.897) | MJ (6.330) | ME (6.760) | MJ (6.585) | PBF (6.903) | PBF (6.839) |
| 3 | PBF (5.503) | ME (5.839) | VP (5.480) | VP (5.609) | VP (5.507) | VP (5.784) |
| 4 | ME (5.344) | PBF (5.131) | PBF (5.452) | PBF (5.376) | ME (4.121) | ME (4.146) |
Compared with other successful pairwise MCDM tools, such as AHP and BWM, CPC has its novel weighting determining process and precisely reflects the decision-maker’s preferences. CPC can be applied to them and modify their results by including certainty in the weighting determining process. Some MCDM tools, such as fuzzy AHP, also deal with the uncertainty in decision-making by fuzzy numbers. However, CPC fixes the uncertainty by acquiring direct certainty from the decision-maker and employs this information to compensate for the uncertainty. In addition, CPC can be more convenient to apply because fuzzy numbers can take more time for a decision-maker to decide. Future studies should illustrate more differences between CPC and other MCDM tools.
Also, by observing the case study and Table 7, high direct certainty judgments can lead to a ranking that is close to the original BWM method. This observation needs to be further studied in the future.
6. Conclusion
This study offers a new 3D printing process selection tool that employs a CPC to analyze and optimize the selection process. The case study illustrates the various steps applied to the rapid investment casting of a given part. The proposed CPC algorithm consists of two parts: the criteria comparisons and the certainty level of each comparison. In essence, all these comparisons and their certainties constitute an information pool that can be used to comprehensively understand the user’s decision-making process. A significant benefit of the CPC method over existing MCDM methods is that it calculates weightings that account for certainty levels. Using the certainty information, the CPC translates the decision-maker’s requirements into numerical information to decide the criteria weightings. After obtaining those weightings, the CPC ranks the six main AM solutions and identifies the most suitable technology. The CPC method can also be easily combined with other MCDM tools to help them take certainty levels into account and support a more informed decision. The AM selection tool developed here inherits all the benefits of the CPC method and can solve complicated AM process selection problems at both the design and manufacturing stages. It is important to note that because the AM industry is fast developing, information about AM materials and technologies must be continually updated when commercializing promising AM technologies and releasing new AM materials. Future research may uncover further ways in which the AM process selection tool can be improved by combining it with other MCDM tools and obtaining the benefits of those other methods. However, the CPC requires more information to make a decision, and it can be extra work compared with other decision-making tools, even though the final result involves certainty. Therefore, another future research could be finding a solution to simplify the CPC tool. In addition, the CPC could also help solve other decision-making problems whenever an alternative needs to be selected among all the alternatives, such as supply chain selection, logistics, sustainable manufacturing and education.
The authors appreciate Thad Kacsandy and Brian Stitt in the Additive Manufacturing group at the University of Dayton Research Institute (UDRI) for providing consulting about AM technologies and summer research internship opportunities to gather data and generate the methodology proposed in this study.

