The assessment and performance evaluation of photovoltaic (PV) systems depend heavily on the site characteristics of existing buildings. However, when physical site inspections are impractical or impossible due to restricted access, this creates a significant barrier to the assessment of PV layout design. This research uses an instrumental case-study methodology to optimise PV array design in existing buildings by integrating Building Information Modelling (BIM) with immersive technologies.
A two-stage optimisation approach was developed to address challenges associated with physical site assessments and fixed building locations. By utilising optimisation algorithms, the grasshopper optimisation algorithm, and Unreal Engine 5 (UE5) for immersive visualisation, this method facilitates detailed shadow analysis and optimal placement of fixed-mounted PV panels. The methodology was validated through a case study involving the modelling of an office building in Melbourne, Australia, using Revit. A rigorous comparative analysis of the developed workflow and the Solar Engineer tool was conducted on the same building to assess the efficiency and accuracy of the workflow.
Results demonstrated that integrating BIM with immersive technologies substantially enhanced the efficiency and accuracy of PV installation assessments. The analysis identified a roof utilisation factor (Roof UF) of 39.62% for PV panels, enabling the installation of 90 solar panels with an annual energy yield of 152,091.64 kWh.
The optimisation workflow introduced in the paper highlights its potential to reduce the reliance on physical site visits while improving design precision and maximising energy output. These findings provide valuable insights for solar engineers and building professionals, contributing to the advancement of efficient and sustainable urban energy solutions.
1. Introduction
The construction industry exerts a considerable influence on both energy consumption and the emission of greenhouse gases (GHG). The 2020 Global Status report for the building and construction sector elucidates that carbon dioxide (CO2) emissions emanating from the operation of buildings constitute approximately 28% of the total energy-related CO2 emissions worldwide, marking the highest recorded levels to date (United Nations Environment Programme, 2020). According to this report, electricity usage in building operations accounts for nearly 55% of the world’s total electricity consumption. Similarly, as announced by the International Energy Agency (IEA) in 2022, approximately 35% of the energy consumed in buildings is attributed to electricity (International Energy Agency, 2022). Since a considerable portion of electricity generation relies on non-renewable energy sources (i.e. fossil fuels), reducing electricity consumption during the operational phase of buildings can wield significant influence on carbon emissions. The utilisation of renewable sources of energy such as solar energy serves as a solution for generating clean and sustainable electricity during the occupancy phase (Hoang et al., 2021; Maka and Alabid, 2022). Solar Photovoltaic (PV) system is increasingly being recognised as a viable alternative for fulfilling operational energy needs, reflecting the global environmental concerns (Allouhi, 2020)
The installation of PV panels on the existing building rooftops and façade systems plays a significant role in mitigating carbon emissions by reducing reliance on fossil fuels. In terms of PV applications, previous research has demonstrated that rooftops and facades of existing buildings are considered as ideal locations for the widespread installation of PV panels (Penizzotto et al., 2019). However, compared to newly constructed structures, existing buildings encounter more constraints in achieving sustainability objectives (D'Agostino et al., 2022). In new buildings, the initial assessment of the quantity and arrangement of solar modules takes place during the design phase. Therefore, new buildings offer some design flexibility when it comes to installing multifunctional solar panels (Kosorić et al., 2018). However, in the context of existing buildings, certain critical factors influencing solar energy generation such as a building’s geographic location, orientation, and surrounding obstructions are fixed and cannot be modified. Additionally, buildings constructed more than 30–40 years ago often fall short of modern energy-efficiency standards, largely because sustainability and renewable-energy integration were not prioritised during their original design and construction. As a result, these structures may present limitations related to roof geometry and shading conditions (Ghaleb and Asif, 2022a). These constraints significantly complicate the appraisal and design process for PV layout. Solar engineers must frequently conduct multiple on-site assessments to gather accurate measurements and evaluate shading patterns. However, site visits can be time-consuming and sometimes impractical, especially when access to the building is restricted. Virtual environments can assist solar engineers in overcoming constraints imposed by fixed building location and orientation during the PV array assessment stage.
This research aims to address how immersive-based tools can be deployed to support the remote assessment of PV layouts in buildings where accessibility is restricted. Therefore, this study explores the use of virtual environments, specifically Building Information Modelling (BIM), immersive technologies, and Geographical Information System (GIS) technologies, to optimise the layout of PV arrays on building rooftops. The objectives of this study are twofold: 1) to develop an immersive BIM-based workflow that enables an efficient virtual site assessment for PV array design on existing buildings; 2) to demonstrate the applicability of immersive technologies in enhancing solar engineers’ decision-making during the assessment stage of PV retrofit design processes. By virtually assessing site constraints such as building location and orientation, solar engineers can reduce the need for physical site visits and enhance the efficiency of PV panel placement. Although the benefits of these technologies are clear, their practical efficacy requires further study. Hence, this research focuses on the assessment phase of PV array design, with the goal of enhancing solar PV assessments and promoting sustainable design and renewable energy practices in the building industry. It seeks to achieve this goal by optimising panel placement and reducing the frequency of physical site visits, thereby lowering carbon emissions.
2. Literature review and background
2.1 Assessment of PV layout in existing buildings
The efficacy of Solar PV technology is particularly evident in building sector, with several research studies indicating that buildings integrating solar panels demonstrate heightened real estate values and expedited sales compared to properties lacking solar installation (French, 2019). Commercial buildings represent one of the main domains for PV systems application, and various settings, including walls and façade systems offer installation options for this type of structures. While rooftop, façade systems, and walls are all favourable sites for PV installation in commercial properties, rooftop stands out as the predominant application of solar PV (Ghaleb and Asif, 2022b; Naeiji et al., 2017). This can be attributed to the cost-effectiveness of assembly and the high capacity for solar energy absorption. For instance, in Australia, utilising the appropriate roof space of all Australian apartment rooftops for PV installation has the potential to generate approximately 4.2–5.8 TWh annually. This could contribute 1.6–2.2% of the national energy demand and prevent 3.2–4.4 megatons of greenhouse gas emissions (Roberts et al., 2019).
Commercial building’s rooftop, despite being crucial for solar absorption, present challenges due to constraints at the roof level. The distinctive layout of each rooftop, influenced by existing building services, presents challenges for assessing PV applications. Commercial rooftops often include structural elements like staircases and building services such as air chillers. Therefore, precise information about the location and size of these services is essential to determine rooftop suitability for PV installation. Also, site attributes significantly impact PV system performance, affecting sunlight exposure, shading, and efficiency. In a notable study assessing PV system feasibility, Dehwah et al. (2018) employed remote sensing and GIS methods to determine the available rooftop space that could be used for PV installation. According to their research findings, roughly 21% of the rooftops of buildings were deemed suitable for the implementation of PV systems. Likewise, Ghaleb and Asif (2022b) investigated 117 commercial buildings located in the Kingdom of Saudi Arabia (KSA) to find the potential berries at building rooftop for PV application. Their study focused on the four types of commercial and healthcare facilities including: hotels, office buildings, shopping malls, and hospitals. They found 16 different types of physical hurdles at building rooftop (i.e. parapet walls, air conditioning systems, utilities like water tanks, staircases, helipads, signage etc.) that could influence the layout and location of PV panels. As part of their study, they had to conduct site audits to thoroughly investigate the potential issues associated with the adoption of rooftop PV systems. Their study’s findings suggest that a physical site inspection is necessary before installing PV systems in buildings. This inspection should consider factors such as geography, weather data, nearby structures, and roof features like air chillers and water tanks (Tianze et al., 2011). However, physical audits can be a time-consuming process and perhaps not applicable in some cases specially when frequent access to the proposed building is not applicable (Ghaleb and Asif, 2022b). Additionally, the existing literature highlights numerous challenges associated with implementing fixed mounted PV systems on rooftops, and current solar assessment methods often fall short in addressing these obstacles effectively. This underscores the need for innovative approaches to optimise the utilisation of rooftop space for PV panel installations.
2.2 Design and assessment of PV systems with the use of technologies
Accurate calculation of roof area utilisation for PV applications in existing buildings typically necessitates a physical site visit. However, this assessment can be challenging due to constraints such as restricted access and obstructions from building services on the rooftop (Ghaleb and Asif, 2022b). Traditional evaluation methods such as site visits often involve time-consuming and energy-intensive practices, from physical inspections on rooftops to the transportation of materials. Recently, there has been a shift towards simulation technologies for modelling PV layouts, providing a strategic alternative to address these challenges and mitigate their impact. A review of the literature indicates that current approaches for identifying optimal locations for solar unit installation rely primarily on GIS-based solar analysis tools (e.g. PV*SOL, PVsyst) and 3D modelling platforms (Zhong and Tong, 2020). Both GIS and BIM leverage various data, including 3D building models, digital surface models (DSM), Lidar data, BIM data, very-high-resolution satellite images, architectural design details, structural elements, mechanical and electrical systems, and even data related to construction, operation, and maintenance (Aslani and Seipel, 2023; Zhong et al., 2022). However, the application of GIS and BIM for determining the optimal location of solar panels is marked by unique limitations (Türk et al., 2021). For example, GIS lacks a realistic and immersive environment and sometimes requires manual verification to validate data, necessitating a workflow for solar engineers and PV designers to gather site data. Sole reliance on GIS may not accurately capture rooftop building services.
BIM tools improve PV panel layout and design by integrating building geometry, radiation analysis, and design parameters. In this regard, by using BIM, Salimzadeh et al. (2020) presented a parametric modelling platform for designing surface-specific PV module layouts. By incorporating surface properties from the BIM model, they simulated detailed solar radiation potential for different building surfaces. They emphasised the importance of optimising PV layouts on building surfaces for enhanced energy efficiency. However, BIM tools such as Revit face limitations in providing real-time simulations to track shading variations throughout the day and across seasons. The restricted interactivity and lack of immersive capabilities hinder intuitive exploration and adjustment of parameters such as row spacing and tilt angles in real time. Additionally, previous research has reported challenges related to information loss during file transfer. Lin et al. (2021) highlight the limitations of current BIM-based PV system design processes, where crucial geometric information is lost when transferring models to specialised PV simulation software. They introduce PV Link as an automated design and management tool integrated into BIM. These specific drawbacks in GIS and BIM have led to the emergence of immersive technologies and immersive digital twins that benefit from the strengths of BIM and GIS (Jain et al., 2020; Nie et al., 2023).
2.3 The application of immersive technologies in the planning and assessment of PV layout
Immersive technologies encompass various digital experiences designed to immerse users in simulated or enhanced environments, typically through technologies such as virtual reality (VR), augmented reality (AR), and mixed reality (MR) (Oyeyipo et al., 2025; Sudhakaran et al., 2025). Immersive technologies offer flexibility in solar panel placement and data utilisation. They address previous challenges by aiding in product design, testing, and prototyping. These technologies significantly enhance the assessment of self-shadowing, row intersections, and angles in PV panels through realistic 3D simulations. Solar engineers can evaluate shading patterns under varying temporal and environmental conditions, adjust panel placement, and assess real-time shading effects to optimise PV system layouts more efficiently. Gaming engines tools, in particular, enhance the analysis of partial shading impacts on solar panels in existing buildings. This approach not only identifies potential design challenges but also fosters collaborative decision-making, while leveraging advanced interactive visualisation (IV) tools such as virtual reality to illustrate proposed systems within simulated environments. (Azraff Bin Rozmi et al., 2019).
Despite these advances, limited research has combined generative optimisation algorithms with immersive validation workflows for remote PV assessment. This gap is particularly significant for existing building retrofits, where physical site access may be restricted and accurate shading analysis is critical to feasibility assessment. Previous studies have largely focused on new construction contexts where design flexibility exists. This research gap is particularly significant for existing building retrofits, where physical site access may be restricted, fixed geometric constraints limit design options, and accurate shading analysis becomes critical to feasibility assessment. This research addresses this gap by integrating parametric optimisation tools with immersive validation platforms, enabling site-independent yet accurate PV array design for existing buildings where physical access is constrained.
2.4 Generative design and multi-objective optimisation for PV systems
Generative design approaches leverage computational algorithms to automatically generate and evaluate multiple design alternatives based on defined objectives and constraints (Caetano et al., 2020). In the context of building-integrated renewable energy systems, parametric optimisation tools such as Grasshopper and Dynamo enable designers to define rule-based relationships between design parameters and performance outcomes (Anton and Tănase, 2016). Multi-objective optimisation algorithms, particularly genetic algorithms, have been effectively applied to PV array design challenges where competing objectives must be balanced such as maximising energy yield while minimising installation costs or maintaining adequate maintenance access (Freitas et al., 2015; Zhao et al., 2024). These evolutionary algorithms evaluate populations of design solutions across multiple generations, progressively identifying configurations that represent optimal trade-offs along Pareto fronts.
Within BIM environments, generative design workflows integrate building geometry data with parametric solvers and simulation engines to enable rapid exploration of design spaces that would be impractical to evaluate manually (Vahdatikhaki et al., 2022). For PV system design specifically, researchers have coupled solar radiation analysis tools (e.g. Ladybug, Radiance) with optimisation algorithms to identify panel configurations that maximise annual energy generation under site-specific climatic conditions and geometric constraints (Anselmo and Ferrara, 2023). However, existing generative optimisation workflows for PV systems predominantly target new construction projects where design flexibility exists, with limited application to existing building retrofits where fixed roof geometry, and existing obstructions create more constrained optimisation problems. Furthermore, while parametric optimisation can generate quantitatively optimal solutions, validation of these computational results through spatial visualisation remains underexplored, particularly in contexts where physical site verification is either impractical or very challenging.
3. Research method
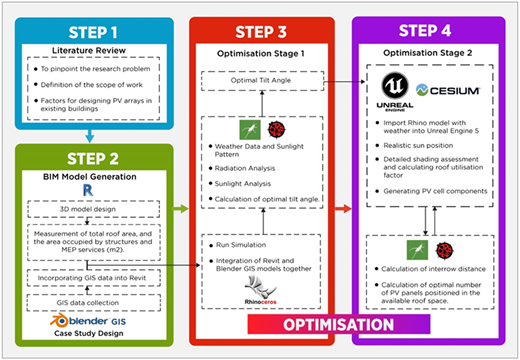
Current virtual site assessment workflows for PV retrofits often rely on fragmented tools, limited spatial context, and repeated physical site visits. The proposed methodology integrates BIM and immersive technologies to address these limitations by enabling remote, accurate, and interactive assessment of existing building conditions. Integrating BIM with immersive technologies enhances early-stage decision-making by providing spatial context not available in conventional PV analysis tools. This immersive workflow reduces the need for physical site visits by enabling remote evaluation of roof conditions and shading constraints. A case-study method was adopted to design an immersive BIM-based workflow for PV layout assessment. The approach was validated through an instrumental case study to examine its practical applicability. The immersive-based optimisation approach, as depicted in Figure 1, consists of four sequential phases:
The process commenced with a comprehensive literature review aimed at identifying the research problem and the critical factors influencing the performance of fixed-mounted PV modules in existing buildings.
A detailed BIM model of the proposed structure was developed in Autodesk Revit, incorporating key data on building altitude, orientation, and surrounding 3D geometry. GIS data from Google map was integrated to establish site context, including neighbouring structures and topographical features affecting solar access, enabling model development without physical site visits.
PV modules were modelled parametrically at roof level using Grasshopper-Rhino, with Ladybug Tools facilitating radiation analysis through EPW climate data integration. The Galapagos genetic algorithm optimiser was employed to calculate optimal tilt angles and panel configurations by evaluating multiple design iterations against dual objectives: maximising annual solar radiation exposure (kWh/m2/year) and minimising panel overlap while maintaining installation feasibility constraints.
The final phase comprised a detailed shading assessment based on the optimised configurations identified in Phase 3. The highest-performing design options were exported to Unreal Engine 5 (UE5) for immersive validation, where real-time ray-tracing shadow analyses were conducted at hourly intervals across solstices and equinoxes. This immersive verification confirmed the shading patterns predicted by the Grasshopper–Ladybug simulations, ensuring the robustness of the optimisation under dynamic solar conditions and enabling precise identification of roof areas suitable for PV installation while maximising the number of deployable panels. The technology stack was selected based on three criteria: (1) commercial availability, ensuring accessibility for industry practitioners; (2) interoperability through standardised file formats, including IFC and FBX for 3D geometry and CSV for data transfer; and (3) validation capability, enabling verification at multiple stages of the workflow. Alternative tools were reviewed during the method selection process. Revit Dynamo was used as an alternative parametric platform but lacked the mature solar analysis plugin of Grasshopper-Ladybug integration; Unity was considered for immersive visualisation but rejected due to inferior real-time ray-tracing performance compared to UE5's Lumen system for accurate shadow validation. The chosen toolchain represents a balance between computational rigour and practical implementation feasibility.
3.1 Decision variables
3.1.1 Orientation
In Australia, PV arrays are commonly positioned on building rooftops oriented to the north with a tilt angle aiming to maximise sunlight (Power, 2024).
3.1.2 Tilt angle
A high tilt angle can increase the system’s exposure to wind loading. Conversely, installations with a minimal tilt and closely packed rows may decrease the energy generation of each module.
3.1.3 Inter-row distance
Preventing self-shadowing from nearby rows of tilted PV panels requires substantial spacing between rows. The phenomenon of self-shadowing explores how parts of a solar panel can cast shadows on other sections, resulting in reduced exposure to sunlight. This can occur when elements of the panel such as the frame or individual cells obstruct sunlight (Galtieri and Krein, 2015).
3.1.4 Shading patterns
The assessment of shading patterns, including the influence of surrounding buildings and rooftop services, is critical for the effective design of PV arrays. Shading conditions are typically evaluated through shadow analyses and shading diagrams, which capture both temporal and spatial variations in solar obstruction. In existing buildings, rooftop areas are often constrained by physical obstacles such as packaged mechanical units, green roof installations, and shading cast by adjacent structures. These factors can significantly affect solar access and, consequently, the performance and layout of PV systems.
3.1.5 Type of PV panels
In this research project PV panels with the following technical specifications were used:
1PV panel = 72 Cell-system solar panel.
PV Module Size: 0.99 m (width) x 1.95 m (length).
The output of 1 PV panel = Estimated at 300 watts.
Energy generation of 1 PV panel per day = 1.5 kWh of energy per day.
Building on these insights, this research aims to enhance the performance of PV arrays by integrating key factors, as summarised in Table 1, and employing a combined approach to design, placement, and environmental considerations. Through this methodology, the research seeks to provide a more comprehensive framework for optimising PV systems by addressing the interconnectedness of various decision variables.
3.2 Development of an optimisation algorithm for computing the optimal tilt angle and best orientation for PV array–optimisation stage 1
The first stage of optimisation focused on identifying the optimal tilt angle and azimuth orientation of the mounted PV array under unobstructed solar conditions. This stage was implemented in Grasshopper using the Galapagos optimisation solver, coupled with Ladybug’s “Directional Solar Irradiance” analysis component. In this stage, the optimisation problem was formulated as follows:
Decision Variables (Genome):
PV tilt angle, β (degrees)
PV azimuth orientation, at which the irradiance is being assessed in degrees (Primer, 2024).
Objective Function (Fitness):
Maximise cumulative directional solar irradiance incident on the PV surface (kWh/m2)
Ladybug’s Directional Solar Irradiance tool was employed to compute incident solar energy on the PV surface assuming an unobstructed environment. This assumption was intentionally adopted to isolate the effect of orientation and tilt from shading influences, thereby establishing a performance-optimal baseline configuration. The output of this stage consisted of an initial optimal tilt and orientation configuration, which was subsequently carried forward to the second optimisation stage, where shading and spatial constraints were explicitly considered in UE5.
3.3 Comprehensive shadow analysis and development of an optimisation algorithm for calculating the optimal number of PV panels in the available roof area -optimisation stage 2
The second optimisation stage addressed the limitations of Stage 1 by explicitly incorporating shading effects, roof obstructions, and spatial constraints. This stage employed an integrated digital workflow combining UE5, Rhinoceros 3D, Grasshopper, Datasmith computer aided design (CAD), and Cesium plugin. In the optimisation stage 2, r the following workflow was meticulously designed to enhance both the precision of the optimisation process and efficiency of tools:
Immersive shadow analysis → Calculation of potential roof surface and roof utilisation factor → Calculation of inter-row distance and optimal number of PV panels.
This workflow is described in detail in the following sections.
3.3.1 Immersive shadow analysis and spatial validation using UE5
UE5 served as the primary platform, offering real-time 3D creation capabilities along with extensive tools for visualisation, simulation, programming, and interactive experiences UE5 was further employed for conducting a detailed shading assessment, analysing shadows cast by PV panels and neighbouring structures. This assessment was critical for identifying shaded regions and calculating the potential roof area available for PV module installation. Using the lighting-only rendering mode, shadow patterns cast by surrounding buildings and rooftop elements were isolated and analysed across critical solar hours and seasonal conditions. UE5 was used strictly for spatial validation and shading assessment. Datasmith played a pivotal role by enabling the seamless transfer of CAD data into UE5. It preserved geometry, materials, and metadata during the import process, ensuring the integrity of the original CAD models while allowing for their smooth integration into UE5’s real-time environment.
3.3.2 Algorithmic parametric optimisation using grasshopper – UE5
3.3.2.1 Calculation of roof utilisation factor
Following the shadow analysis, the suitable areas for PV installation on the building’s rooftop were identified by pinpointing zones with maximum sunlight and minimal shading during critical hours. Initially, the Revit model was used to determine the total gross roof area (Roof GFA) as a baseline. Rhinoceros 3D was then utilised to outline and measure areas occupied by structures and mechanical services (Roof MEP), which are unsuitable for PV installation, as well as designated maintenance areas (Roof MA). Rhinoceros 3D functioned as the CAD platform, leveraging its advanced NURBS (Non-Uniform Rational B-Splines) functionality for the precise creation, editing, analysis, and rendering of 3D models. NURBS enabled the modelling of complex geometries tailored to the specific requirements of the project. This process distinguished usable (Roof U) from non-usable (Roof NU) areas. UE5 capabilities were employed to accurately calculate shaded areas (Roof SHA) through dynamic shadow analysis across various times and dates. The available roof area (Roof U), free from shading and obstructions, was determined using Equation (2). Subsequently, the roof utilisation factor (Roof UF) was calculated using Equation (3). This factor represents the proportion of the roof that is viable for PV installation, providing a crucial metric for planning and optimisation.
3.3.2.2 Inter-row distance analysis and optimal number of PVs
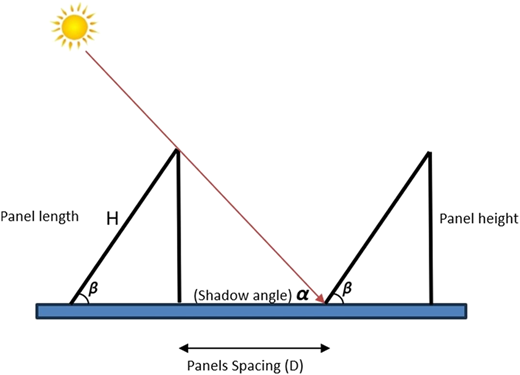
The optimisation process also incorporated an equation to determine the inter-row spacing of PV panels on a horizontal plane, effectively mitigating self-shadowing:
Where β represents the tilt angle (Figure 2), φ denotes the site latitude, and δ0 refers to the sun’s declination angle (Swaid et al., 2021).
At this stage, Grasshopper and UE5 were used in an interactive workflow to optimise the number of PV panels on the building’s rooftop. The objective was to ensure that the maximum number of panels could be installed in areas consistently exposed to full direct sunlight between 11:00am and 4:00pm each day. The period from 11:00am to 4:00pm was selected as this timeframe is generally recognised as the peak solar radiation window in Melbourne, capturing the majority of daily solar energy (Beth, 2024). The interactive workflow leveraged the advanced capabilities of UE5, particularly its high-precision, real-time hourly sunlight and shading analysis. Unlike Grasshopper and other commonly used BIM or solar energy simulation tools, UE5 provided a more dynamic and accurate visualisation of solar conditions throughout the day and across different seasons. This allowed for a more informed and performance-driven arrangement of PV panels, improving overall energy yield.
4. Validation and case study results
This section presents the results of the proposed immersive-BIM integrated optimisation workflow for virtual site assessment and PV retrofit design, validated through an office building case study. The results are discussed in relation to the study’s primary objectives: 1) to develop an immersive BIM-based workflow that enables an efficient virtual site assessment for PV array design on existing buildings; 2) To demonstrate the applicability of immersive technologies in enhancing solar engineers’ decision-making during the assessment stage of PV retrofit design processes. Each sub-section links the outcomes to the proposed phases of the research method to address the objectives.
4.1 Model development, geographical data collection, and sun-hour analysis
An office building located in Melbourne (Latitude = −37.82o, Longitude = 144.97o) was selected as a case study to test the functionality of the optimisation workflow. The selection of Melbourne is significant not only as a representative urban context but also as a city with solar resources potential. Revit was used as the design authoring platform to generate a digital model of the building, comprising structural components and mechanical services integrated at the roof level, including: four water tanks, stairs (structural elements), elevator shaft, and four air chillers. Revit was chosen for its parametric modelling capabilities and its ability to automate the building modelling process (Bakhshi et al., 2022). This choice directly supports the study’s first objective, as Revit’s parametric environment enables rapid model adaptation for different scenarios, a critical feature for scaling the methodology to broader retrofit assessment plans.
A clearance of 1.2 metres around the water tanks and air chillers was implemented to facilitate access to existing services and ongoing maintenance requirements (Enhar Sustainable Energy Solutions, 2017). This step reflects an important methodological contribution of the study. The proposed workflow explicitly encodes real-world spatial exclusions into the digital model, thereby producing results that are directly actionable for practitioners. Blender GIS was used to incorporate GIS data such as altitude, sunlight patterns, and the orientation of surrounding buildings into the BIM model for the accurate analysis. Blender GIS facilitates the easy import of satellite maps and 3D building geometry, enabling users to incorporate geographical information into their BIM models. This integration addresses a limitation in conventional PV feasibility assessments, which often rely on isolated roof-level analysis (Jakica, 2018).
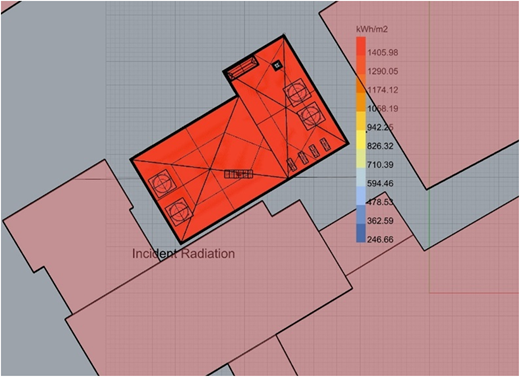
A preliminary sun-path analysis was performed using Revit for the winter solstice (21 June 2023) to determine the direction of sunlight and evaluate potential roof areas for PV system installation. The winter solstice represents the lowest annual solar exposure in the Southern Hemisphere and provides a conservative baseline for identifying areas that maintain adequate irradiation even during winter. Solar engineers assess a surface’s photovoltaic potential by analysing solar radiation over time. Conducting the preliminary analysis at the solstice therefore ensures that the identified zones deliver acceptable performance year-round. This initial analysis strengthens the reliability of the workflow’s outputs and is relevant to industry practitioners concerns about the minimum performance thresholds for regulatory approval. Following the initial sun-path analysis conducted in Revit, the Revit model, incorporating GIS data and surrounding context buildings was imported into Rhinoceros 3D for detailed sun-hours and irradiation analysis. The Ladybug plugin for Grasshopper was utilised to identify roof areas with optimal sunlight exposure, factoring in the positioning of MEP services as well as nearby structures. Melbourne-specific weather data and sunlight patterns were sourced from the Department of Energy’s (DOE) database and integrated into Grasshopper to enable precise sun-hours and irradiation analysis. Grasshopper, Rhino’s visual scripting tool, is a specialised plugin developed for energy simulations that utilises validated EnergyPlus models (Freitas et al., 2020). Compared to alternative radiation analysis tools such as PVsyst or SketchUp’s shadow analysis, Grasshopper offers better integration with parametric design environments. Ladybug was selected for radiation analysis due to its advanced environmental analysis capabilities and seamless integration with EnergyPlus. Ladybug enabled accurate simulation of solar radiation on building surfaces by incorporating location-specific weather data and considering obstructions from nearby structures. Radiation analysis quantified the solar energy incident on the roof surface. Results from the analysis estimated that the proposed roof surface would receive an annual solar radiation of 1405.98 kWh/m2 (Figure 3).
4.2 Computation of optimal tilt angle and best orientation for PV array – optimisation stage 1
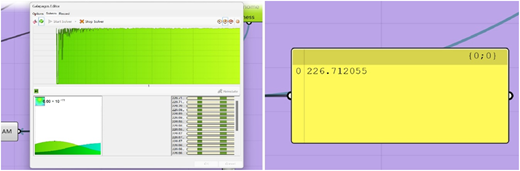
After evaluating the roof surface for photovoltaic (PV) suitability, the optimal tilt angle was identified using a 1 × 6 PV array modelled at roof level. The Ladybug Directional Solar Irradiance function calculated hourly irradiance for an unobstructed panel in any orientation. A shown in Figure 4, a simulated annealing solver in Grasshopper iterated until reaching a maximum irradiance of 226.71 W/m2 per hour. Galapagos performed inherent sensitivity analysis by testing multiple tilt angles, azimuths, and orientations across solution generations. The optimal tilt angle was determined as 28°, facing north, by rotating the PV array around the XYZ axis based on Melbourne’s geographic coordinates.
4.3 Comprehensive shadow analysis and optimisation algorithm for determining PV panel capacity – optimisation stage 2
4.3.1 Immersive shadow analysis and spatial validation using UE5
The outcome of the first optimisation stage, an optimal tilt angle of 28° with a northern orientation, was adopted as a fixed geometric input in the second optimisation stage, defining the spatial configuration for panel modelling within the UE5 environment. This predefined angle informed the calculation of an inter-row spacing of 1.68 m using Equation 4, establishing a deterministic framework for the subsequent optimisation phase. At this stage, the focus shifts to maximising panel quantity and placement efficiency while adhering to shadow-minimisation constraints. To achieve this, a dynamic integration of Grasshopper and UE5 was implemented to refine and optimise the configuration of photovoltaic panels on the building’s rooftop.
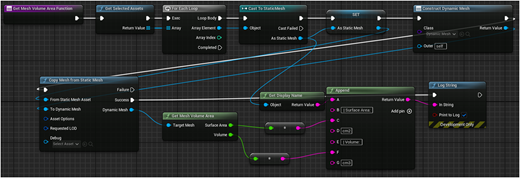
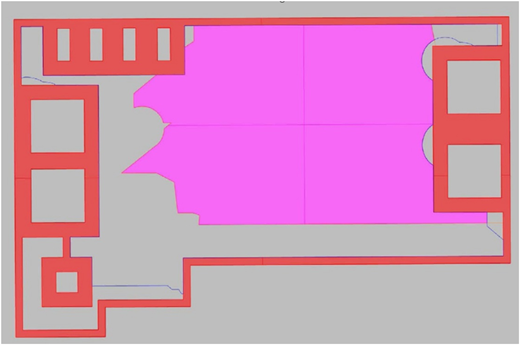
Recognising that solar potential is highest between 11:00 am and 4:00 pm, five sets of shadow analyses were conducted for both the winter solstice (21 June 2023) and the summer solstice (21 December 2023) in UE5. UE5’s dynamic shadow analysis functioned as a spatiotemporal sensitivity study by testing shadow impacts at multiple times (11:00 am, 12:30 pm, 2:00 pm, 3:30 pm, and 4:00 pm) during both solstices. This comprehensive approach ensured an accurate understanding of shading patterns throughout the most critical daylight hours. The immersive UE5 environment enabled the identification of spatial conflicts and shaded regions that were not evident in traditional BIM-based analysis, directly informing the exclusion of non-viable PV zones. Figure 5 presents the UE5 script used to calculate the available rooftop area for PV installation. The script employs UE5’s visual scripting tool to process roof geometry and account for shadows and obstructions. By treating the roof surface as a mesh, it identifies regions shaded between 11:00 am and 4:00 pm with high precision. Figure 6 illustrates the resulting available rooftop area (230 m2), which maximises sunlight exposure and ensures that no panels are placed in shaded zones during this period.
4.3.2 Calculation of roof utilisation factor
By combining the advanced visualisation and modelling capabilities of UE5, Revit, and Rhino, the comprehensive calculation of the roof utilisation factor (Roof UF) was carried out with precision. This multi-step process ensured accurate identification of optimal PV installation zones, maximising the roof’s solar potential. As indicated in Table 2, a Roof UF of 39.62% was attained using Equation (3) in the proposed office building. A roof utilisation factor of 39.62% highlights the significant impact of rooftop obstructions and dynamic shading on PV deployment potential, underscoring the importance of immersive, shading-aware assessment in existing buildings.
4.3.3 Inter-row distance analysis and optimal number of PVs
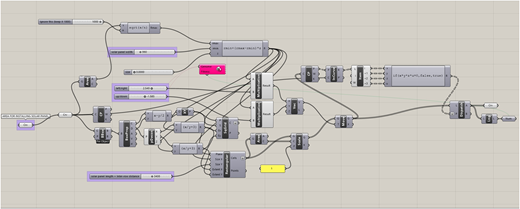
In the next step, the calculated available surface area and inter-row distance of 1.68 m (established using Equation 4) were used to determine the optimal number of PV panels. By analysing the inter-row distance, self-shadowing by the PV panels was eliminated from the model that enhances solar exposure while minimising shading losses. The Grasshopper plug-in was employed to calculate the optimal number of PV panels. This process involved parametric modelling, solar analysis, and optimisation using Grasshopper Galapagos and shading pattern analysis in UE5. First, Grasshopper algorithm shown in Figure 7 was applied to calculate the initial number of PV panels in the designated area (230 m2) on the building rooftop. In Grasshopper, the inter-row distance was set as a variable parameter, allowing the generation of a series of potential inter-row distances for analysis. This approach facilitated systematic evaluation to identify the most suitable spacing configuration. The optimisation process in Grasshopper Galapagos of Rhino 3D resulted in the deployment of 82 solar panels with an inter-row distance of 1.68 m between PV arrays. The inputs to the proposed algorithm included:
PV module length
PV module width
Area for installing PV modules.
In the final step of the optimisation process, the Rhino model containing 82 PV panels was imported into UE5 to explore the potential for increasing the number of panels exposed to full direct sunlight. This was achieved by leveraging UE5’s advanced real-time shading analysis, which allowed for precise evaluation of solar exposure between 11:00am and 4:00pm. Through iterative adjustments guided by UE5’s real-time shading visualisation, additional zones within the available roof area were identified as suitable for PV installation, enabling the placement of eight further modules beyond the initial Grasshopper-optimised configuration. As a result, a total of 90 PV panels were successfully positioned on the rooftop of the proposed office building, all within zones of uninterrupted sunlight during peak solar hours.
Without the integration of UE5, the detailed shading assessment and final optimisation step would have likely required multiple physical site visits. This highlights the significant role that immersive tools like UE5 can play in supporting solar engineers by streamlining the design process and enhancing the precision of PV panel placement.
5. Validation of the study outcomes using solar analysis tools
The efficacy and accuracy of the results were assessed through comparing the outcomes of the study with the results obtained from the PV*SOL (PV*SOL, 2025) platform for the same office building, which served as a benchmark for performance evaluation of the optimisation workflow. PV*SOL is a comprehensive solar analysis tool designed for calculating the performance of photovoltaic systems. It offers detailed configuration options and advanced shading analysis, enabling precise system evaluation. With PV*SOL, users can calculate solar output, optimise panel sizing, and forecast the economic feasibility of photovoltaic systems. Additionally, the platform supports the use of 3D models and integrates with Google Maps to analyse proposed surfaces for PV installations. In this project, the 3D model integration into PV*SOL was adopted to increase the accuracy of MEP placement on the rooftop and accurate use of roof dimension. The PV*SOL platform requires the definition of some important parameters in order to design the PV layout and energy output for a building project.
Following the setup of the 3D model, context environment, rooftop barriers identification, and parametre definitions in PV*SOL (Table 3), the authors simulated the proposed rooftop. They utilised the PV*SOL platform’s automatic layout design function to position the PV modules. The PV system designed on the building rooftop using PV*SOL included modules with shading levels ranging from 0.00% to 18%. According to Wrightsman (2025) an observed shading level of 3% has the potential to substantially diminish the energy yield of photovoltaic systems. Also, the study of Swart and Hertzog (2023) showed that an average shading level of 4.7% was found to cause a significant 59% reduction in the output power of the 10 W photovoltaic module. Therefore, modules with a shading level of more than 3.5% were excluded from the PV*SOL model, resulting in a total of 88 modules. This decision aligned with the research objective of ensuring that PV modules experience zero shading on sunny days, particularly from nearby structures and MEP systems, in order to optimise PV performance. The shading-aware refinement resulted in a configuration of 88 PV modules, yielding 148,708.90 kWh annually as calculated by the PV*SOL platform. This was compared with the optimised configuration of 90 modules, which produced 152,091.64 kWh. The comparative results, presented in Table 4, highlight how the detailed shading assessment in UE5 and the exclusion of shaded modules enhance methodological rigour and ensure more reliable performance estimates. The results show that immersive–technology - assisted PV layout design can increase energy yield by enabling more optimised spatial configuration, shading analysis, and module placement. This has meaningful implications for future PV system design, simulation workflows, and the broader field of renewable-energy engineering. Combining parametric modelling (Grasshopper) with real-time visualisation (UE5) leads to:
More efficient use of available area.
Higher module density without violating shading constraints.
Faster iteration cycles.
This suggests a shift toward immersive, interactive PV design environments where engineers can walk through the installation before it exists. From an industry perspective, the ability to generate a site-specific and obstruction-aware workflow with minimised costly on-site instrumentation represents a significant practical advancement. Building owners, energy consultants, and solar engineers can leverage this virtual assessment capability to prioritise retrofit scenarios before committing to detailed engineering design, thereby reducing upfront assessment costs. Additionally, the parametric nature of the workflow means that updated GIS data, revised clearance requirements, and any changes in rooftop design can be incorporated with minimal rework. Future applications could adopt this methodology to assist city planners and engineers in identifying aggregate PV capacity across entire urban precincts.
The accuracy of the optimisation workflow using immersive method was evaluated using a percentage accuracy formula, with the PV*SOL results serving as the reference benchmark (i.e. the “ground truth”). This comparison yielded a measurable accuracy value of 97.73%.
Estimated (Immersive) = 90 modules
Reference (PV*SOL) = 88 modules
6. Discussion
This study presents a novel workflow that reduces the need for physical site visits in PV array design by integrating BIM and immersive technologies. This approach enables solar engineers to perform accurate remote assessments, which is especially beneficial for projects with restricted site access or dense urban environments. The combined use of BIM and immersive platforms improves calculations for tilt angles, panel placement, shading impacts, and identification of rooftop MEP services, exceeding the capabilities of typical GIS-based tools. Immersive environments, such as UE5, allow detailed remote analysis of shading from surrounding structures during early design stages, enhancing accuracy through real-time 3D visualisation and interactive exploration. Integrating BIM authoring tools like Revit and Rhino with immersive platforms supports an automated and precise remote PV design process. Given the limited research on this integration, the proposed workflow fills an important gap by demonstrating how immersive technologies can strengthen PV array assessment. This study sought to enhance the integration of BIM and immersive tools to optimise solar panel array design, while reducing the need for site inspections in areas or buildings with limited access. The case study revealed a roof utilisation factor of 39.62%, placing it at the upper end of the utilisation range for offices (27%–39%) cited in the literature (Ghaleb and Asif, 2022a), thereby highlighting the method’s effectiveness in maximising available space. This precision can lead to more efficient PV systems and increased energy generation.
This research extends beyond existing methodologies in several significant ways. Unlike drone-based photogrammetry approaches (Hernández-López et al., 2023), which generate static 3D models of current conditions, our immersive BIM workflow facilitates dynamic temporal analysis of shadow patterns. Furthermore, while digital twin technologies provide real-time monitoring for post-installation performance (Jain et al., 2020), they primarily focus on operational insights rather than design optimisation prior to implementation. Our approach uniquely integrates BIM’s spatial precision with the interactive capabilities of game engines, creating a spatiotemporal analysis framework that surpasses the limitations of each individual technology.
A further finding was the identification of each tool's distinct strengths and limitations, reinforcing the value of integrating BIM and immersive platforms rather than relying on any single tool for PV array design assessment. It was observed that each tool had its unique strengths and weaknesses, reinforcing the notion that the synergy between BIM tools and immersive platforms can yield higher quality results in PV array design assessment. The presence of visual programming tools in both Rhino and UE5 further supported our optimisation process, allowing for detailed analyses to achieve the intended outcomes. Table 5 provides a detailed overview of the perceived benefits and drawbacks of each tool in relation to PV system design, as observed in this project.
7. Implication of findings
The findings of this study have both practical and policy implications. The practical applicability of this workflow extends beyond individual building assessments to address systemic challenges in urban solar energy deployment. From a policy perspective, the findings highlight the value of immersive-based PV assessment workflows in accelerating solar energy adoption in dense urban areas. City planners and policymakers can use these tools to create more consistent methods for evaluating rooftop solar suitability based on reliable data. Integrating BIM-immersive-based PV layout analysis into urban energy policy would help ensure more uniform assessments of solar potential, making it easier to deploy rooftop solar at scales as part of broader low-emission city initiatives.
For industry practitioners, this research provides practical insights into the integration of BIM and immersive technologies to enhance PV assessment workflows. Existing buildings often present challenges for physical site assessment due to restricted site access, safety risks, and the high cost and carbon emissions associated with repeated site visits. By introducing an immersive BIM-based workflow, the study provides a means to conduct detailed site assessment remotely to minimise physical site visits. This approach streamlines early-stage PV design by reducing reliance on on-site inspections and enhancing communication among project stakeholders. As the demand for rapid and cost-effective PV retrofits continues to grow, the proposed workflow presents a timely and scalable solution that can be integrated into existing BIM and PV design platforms.
According to the findings, the early integration of PV analysis within a BIM-immersive environment can boost collaboration between engineers, energy consultants, and suppliers. Solar engineers can implement this approach using commercially available software, with no requirement for specialised training beyond standard BIM competencies. The workflow achieves demonstrably more accurate results in complex urban environments where shading significantly affects system performance. The workflow requires only standard BIM competencies and commercially available software (Revit, Grasshopper, Ladybug, UE5), eliminating specialised training barriers. The methodology reduces assessment costs through eliminated site visit requirements while maintaining geometric accuracy, making PV feasibility studies economically viable for smaller-scale projects previously deemed uneconomical. By combining BIM, parametric modelling, GIS data, and immersive technologies for real-time shadow analysis, the proposed methodology supports informed decision-making while reducing reliance on repeated physical site visits. These capabilities align with the objectives of Sustainable Development Goal 11 (specifically Target 11.6: reducing the environmental impacts of cities) (United Nations General Assembly, 2015), which emphasises sustainable and resource-efficient urban development. The ability to evaluate PV potential remotely contributes to lower carbon emissions and increased solar energy uptake, thereby supporting more sustainable urban development.
8. Conclusion
This study presents an immersive BIM-based workflow that optimises virtual site assessment for PV array design on existing buildings. By combining BIM data, immersive visualisation, and integrated shading and spatial analysis, the proposed approach enhances the accuracy and efficiency of early-stage PV design. The findings indicate that the integration of BIM, parametric optimisation, and immersive visualisation enhances the virtual site assessment process for mounted PV array design by making it more shading-aware and contextually informed. Although quantitative outputs such as roof utilisation, installed capacity, and annual energy yield are specific to the case examined, the study highlights how immersive digital environments can improve decision-making by revealing spatial and shading limitations that are often overlooked in conventional practices. The primary contribution of this work lies in the structured digital methodology, offering a framework that can support more advanced optimisation and wider applicability in future research. The framework introduced in this paper offers a practical and scalable solution for virtual PV retrofit site assessment, tested through an office building case study. Its compatibility with existing BIM tools and GIS software and replicable structure across building typologies and climate zones represent meaningful methodological contributions to the field of sustainable building design. Its practical value is reinforced by a compelling policy and market context: Rooftop solar supplied 12.8%, or 15,463 GWh, of Australia’s total electricity generation in the first half of 2025 (Clean Energy Council, 2025). Beyond its economic and regulatory significance, the workflow also strengthens urban planning and decarbonisation efforts required to meet national net-zero commitments. This study demonstrates the significant potential of incorporating immersive technology in the inspection and assessment tasks within existing buildings, particularly in the context of PV array design. While the PV array design process traditionally relies on a variety of software packages at different stages, each with its own strengths and limitations, our research addresses the shortcomings of conventional tools such as 2D documents, 3D models, and GIS-based applications. These tools often lack immersive capabilities and can produce unreliable results when used independently without integration across platforms.re. The automated workflow developed in this research effectively reduces the need for physical site visits when calculating tilt angles and determining optimal locations for PV arrays on existing building rooftops. By integrating BIM and immersive platforms, we achieved an optimised number of PV panels while minimising calculation errors. The case study analysed in this paper yielded promising results, achieving a roof utilisation factor of 39.62% and optimal placement of 90 solar panels. These findings highlight the potential of our methodology to enhance the efficiency and accuracy of PV installation assessments in urban environments. This study makes five distinct contributions to the field: (1) establishing a novel methodological framework that integrates parametric optimisation with immersive visualisation technologies; (2) quantifying accuracy improvements through immersive shadow analysis; (3) minimising physical site visits during the assessment stage of PV layout design; (4) enhancing design confidence through real-time visualisation of complex shading patterns; and (5) improving client communication via immersive representations. Building on the outcomes of this study, several avenues for future research can further advance the integration of immersive technologies and BIM-based PV assessment workflows. First, expanding the methodology to support automated PV system sizing, electrical configuration, and energy yield prediction using machine-learning-based tools would enable a more comprehensive end-to-end design workflow. This may allow to enhance the predictive accuracy of PV output under varying urban conditions. Second, integrating this methodology with emerging technologies such as LiDAR, drone-based surveying, and satellite imagery analysis could be explored in future studies. This integration has the potential to further reduce the need for physical site visits and broaden the scope of PV potential assessments This integration may also improve the geometric accuracy and help to automate the process. Looking ahead, the framework can be well-positioned for extension into the AI era through machine learning-driven configuration prediction and generative AI-assisted simulations for real-time energy yield monitoring. Third, our focus on flat rooftops in buildings may restrict the applicability of our findings to other buildings and roof types. Future research may explore applying this approach to diverse architectural styles, such as HIP and Gable roofs in low-rise structures. Finally, while our study concentrated on the site assessment and inspection phase, future work could expand to include other crucial stages of PV array design, such as system design, panel mounting, installation, and ongoing operation and maintenance.
This research proposes a methodological reorientation from site-dependent PV array design toward site-independent assessment, enabled through the integration of immersive and BIM-based environments, particularly for existing buildings with restricted access. By integrating online geospatial data acquisition, solar simulation, and immersive visualisation, the workflow coordinates these tools to minimise physical site visits while maintaining assessment accuracy. Through the combination of parametric modelling and immersive validation, the study proposes a hybrid optimisation paradigm. This contributes to theory by demonstrating how computational design optimisation can be validated through real-time spatial analysis.
The implementation challenges associated with this methodology are also acknowledged. Despite the advantages of the workflow introduced in this paper, practitioners adopting this approach may encounter several challenges. First, the multi-platform workflow requires expertise across diverse software environments (Revit, Rhino, UE5). While individual components may be familiar to practitioners, the complete workflow often crosses traditional skill boundaries between BIM specialists, computational designers, and visualisation experts, necessitating targeted cross-training or interdisciplinary collaboration. Second, computational requirements for real-time shadow analysis in UE5 may exceed standard workstation specifications in many architectural and engineering offices, requiring hardware investments. Third, data transfer between platforms remains susceptible to geometry simplification and metadata loss, requiring careful quality control protocols during each transition. The accuracy of the proposed workflow is fundamentally dependent on the quality and availability of geospatial data. High-resolution digital elevation models and precise building footprint sources are essential prerequisites for reliable obstruction modelling. Furthermore, the instrumental case-study approach validates the workflow using a single commercial building in Melbourne, Australia, which constrains the generalisability of the findings across diverse climatic zones, building typologies, and regulatory contexts. Finally, while reducing physical site visits, this approach may front-load the digital modelling effort.
Ethical information
This study utilised publicly available data and simulations therefore, no ethical approval was required as the research did not involve human or animal subjects.
Data availability
The data that support the findings of this study are available from the corresponding author upon reasonable request.
Declaration of generative AI and AI-assisted technologies in the writing process
During the preparation of this work, the authors used GPT-3.5 for proofreading and improving the clarity of the writing. After using these tools, the authors reviewed and edited the content as needed and took full responsibility for the content of the published article.
The authors would also like to thank Prof. Rebecca Yang for their unwavering support and encouragement during this research.
Nomenclature
- al
Ground albedo
- D
Inter-row spacing [m]
- H
Panel length [m]
- W
Panel Width [m]
- Roof GFA
Total gross area of the roof
- Roof MA
Roof maintenance area
- Roof MEP
Roof area occupied by MEP services
- Roof NU
Roof non-usable area
- Roof SHA
Roof shaded area
- Roof U
Roof usable area
- Roof UF
Roof utilisation factor
- αDec.
Sun elevation angle
- β
Row inclination angle (Tilt angle)
- δ0
Sun declination angle
- φ
Latitude