Urban road infrastructure (roads, bridges, pavement and drainage systems) is increasingly vulnerable to climate change impacts, such as extreme weather events, flooding and heat stress, threatening its structural integrity and long-term functionality. This systematic literature review investigates how smart technologies can enhance the climate resilience of urban road systems.
A four-phase systematic literature review was conducted, beginning with the selection of 78 key studies from 1,684 Scopus-indexed publications. This was followed by bibliometric analysis using VOSviewer and qualitative content analysis with NVivo. The review employed an inductive approach, focusing on identifying technological applications, integration patterns, challenges and frameworks through systematic content analysis.
Through systematic content analysis, the review identified seven core technologies, including Geographic Information Systems (GIS), Building Information Modelling (BIM), Digital Twin (DT) systems, the Internet of Things (IoT), Artificial Intelligence (AI), Big Data (BD) and Remote Sensing (RS). These technologies form an integrated digital ecosystem: GIS and RS supply spatial and environmental data; IoT sensors provide real-time monitoring; BIM supports infrastructure design and lifecycle modelling; DT systems simulate infrastructure performance using live and historical data; and AI, in conjunction with BD, facilitates predictive analytics and automated decision-making. Despite their potential, implementing these technologies presents several challenges, including data interoperability issues, technological immaturity, fragmented policies and socio-technical barriers.
The study proposes a conceptual framework to guide the integration of smart technologies into climate resilience strategies for urban road infrastructure. It also recommends developing standardised integration frameworks to enhance interoperability, cross-sectoral governance structures and capacity-building initiatives to support practical implementation.
1. Introduction
Climate change has substantially increased the vulnerability of urban road infrastructure (including roadways, bridges, pavement systems and associated drainage infrastructure) to extreme weather events, flooding, heat stress and structural degradation. These challenges threaten not only infrastructure integrity but also urban safety and liveability, underscoring the urgent need for adaptive measures (Mishra and Sadhu, 2023). Climate resilience refers to the capacity of social, economic and environmental systems to withstand hazardous events while maintaining their core functions and structures (Salih and Báthoryné Nagy, 2024). The financial burden of climate inaction is well-documented; maintaining the US road network costs $134 billion annually, with climate-related expenses projected to reach $785 million annually by 2050 (Chinowsky et al., 2013). Rapid urbanisation further compounds these challenges, with approximately two-thirds of the world's population projected to live in urban areas by 2050 (Forzieri et al., 2016), demanding the systematic integration of innovative technological solutions into infrastructure planning and management.
In response to these imperatives, smart technologies have emerged as essential enablers of climate-resilient infrastructure management (Khazaee et al., 2025). Existing reviews have examined various aspects of this challenge: climate-related mitigation and long-term resilience planning (de Abreu et al., 2022), digital technologies such as sensor networks and predictive analytics for critical infrastructure resilience (Argyroudis, 2022), Geographic Information System (GIS)-based decision support tools for urban resilience (Rezvani et al., 2023) and Building Information Modelling (BIM) implementation challenges, including data integration and governance (Bradley et al., 2016). Industry 4.0 technologies, including BIM, Internet of Things (IoT), Artificial Intelligence (AI) and Big Data (BD) have been further explored for sustainability enhancement in infrastructure resilience (Abbasnejad et al., 2024; Cepa et al., 2023b). BIM has been specifically examined for transportation asset management optimisation (Cepa et al., 2023b) and road infrastructure digitalisation (Castañeda et al., 2024).
Integrated approaches have similarly gained traction, with BIM-GIS integration demonstrating effectiveness for urban road infrastructure analysis and design (Sohaib et al., 2024; Song et al., 2017) and hybrid BIM-GIS-Digital Twin frameworks proposed for road asset management (Cepa et al., 2023a). Recent studies in the Smart and Sustainable Built Environment journal have examined Digital Twin (DT) technologies for real-time infrastructure monitoring (Sohal et al., 2025) and BIM-GIS-IoT integration within a city information modelling framework (Okonta et al., 2025). Disaster management strategies have similarly advanced through digital tools for prevention and response (Khan et al., 2023), Web-GIS for disaster mitigation (Daud et al., 2024) and GIS-Remote Sensing applications for climate hazard monitoring (Tsatsaris et al., 2021). However, these studies remain domain-specific and do not collectively constitute a systematic synthesis of how all technologies function together as a coherent ecosystem for urban road climate resilience.
Despite this growing body of scholarship, significant gaps persist. As shown in Table 1, existing reviews either address individual technologies in isolation, cover multiple infrastructure types without urban road specificity or focus on climate adaptation without synthesising the digital technology ecosystem enabling it (Argyroudis, 2022; Castañeda et al., 2024; Rezvani et al., 2023). No systematic review has yet synthesised how BIM, GIS and other smart technologies collectively form a cohesive, interactive ecosystem tailored specifically to urban road climate resilience. Four critical gaps motivate this Systematic Literature Review (SLR): first, the full spectrum of smart technologies applicable to climate-resilient urban road infrastructure remains unclearly defined. Second, no existing frameworks demonstrate dynamic, bidirectional interactions among technologies where real-time data, predictive analytics and spatial planning function as interconnected components. Third, barriers to technology integration, including technical interoperability, institutional fragmentation and socio-technical constraints, remain insufficiently understood. Fourth, practical implementation guidance for urban planners and policymakers remains limited, with insufficient attention to economic feasibility, organisational readiness and context-specific adaptation for resource-constrained urban settings.
To address these gaps, this systematic literature review pursues four primary objectives: (1) identify and map the spectrum of smart technologies enhancing urban road climate resilience through systematic analysis of peer-reviewed literature; (2) analyse the functional roles and dynamic interactions of these technologies within an integrated digital ecosystem; (3) assess technical, institutional and socio-technical barriers hindering integrated deployment and (4) develop an operational framework with effective implementation strategies for diverse urban contexts. Three research questions guide the study:
What diverse smart technologies (identified through systematic content analysis) can enhance climate-resilient urban road infrastructure?
What are the specific roles and interactive dynamics of technologies to support the climate resilience of urban road infrastructure?
What are the key technical, institutional and socio-technical challenges for integrating smart technologies, and what implementation strategies can facilitate deployment in diverse urban contexts?
2. Materials and methods
This research employs the SLR methodology for exploratory research in emerging interdisciplinary domains (Snyder, 2019). SLR in engineering and management sciences uses systematic, transparent search and selection processes to map research landscapes and develop conceptual frameworks.
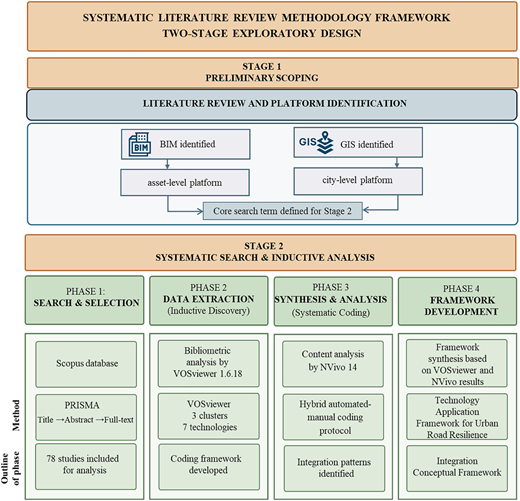
This methodology employed a two-stage exploratory design appropriate for inductive framework development. In Stage 1, preliminary scoping identified BIM and GIS as complementary integration platforms, with BIM for micro-scale asset-level applications and GIS for macro-scale spatial analysis (Bradley et al., 2016; Song et al., 2017). Importantly, this choice was methodological rather than substantive; BIM and GIS served as search anchors to retrieve a broad corpus, within which all other technologies emerged inductively. However, this anchoring may have introduced platform bias, potentially underrepresenting studies focused exclusively on IoT, DT or AI without mentioning BIM or GIS, a limitation acknowledged in Section 4.3.
In stage 2, a systematic search used BIM and GIS as core terms. This was followed by inductive content analysis using VOSviewer bibliometric analysis and NVivo qualitative coding, which enabled the technology taxonomy to emerge empirically from the data, rather than being predefined a priori. This inductive methodology aligns with exploratory research paradigms, in which frameworks emerge from data (Eisenhardt, 1989). The methodology comprised two stages and four sequential phases: Search and Selection (Phase 1), Data Extraction (Phase 2), Synthesis and Results (Phase 3) and Framework Development (Phase 4), as illustrated in Figure 1.
2.1 Systematic search and selection
2.1.1 Search strategy
Scopus was selected as the primary database due to its multidisciplinary coverage of over 95% of engineering and environmental journals, and compatibility with the SLR methodology. The VOSviewer bibliometric analysis requires Scopus-formatted metadata (van Eck and Waltman, 2010; Gusenbauer and Haddaway, 2020). A systematic search was conducted on 26 February 2025. The search strategy was designed to identify peer-reviewed research at the intersection of smart digital technologies, urban road infrastructure and climate resilience. Initial searches using “urban road infrastructure” yielded inadequate results due to terminological diversity across fields, necessitating broader search terms combined across three conceptual blocks using Boolean operators:
TITLE-ABS-KEY (“building information modelling” OR “BIM” OR “GIS” OR “geographic information system”) AND (“infrastructure” OR “transportation” OR “road”) AND (“climate change” OR “resilience” OR “climate adaptation” OR “climate mitigation”).
This query returned 1,684 records, demonstrating the breadth of relevant literature. To ensure contemporary relevance and methodological rigor, a series of filters were applied within the Scopus search interface.
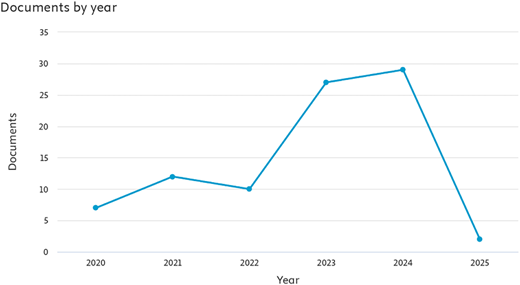
Filters were applied across six criteria: temporal range (2020–2025), publication stage, source type, disciplinary focus, open access status and keyword relevance, reducing the pool from 1,684 to 475 records. The 2020–2025 timeframe was selected because 75% of relevant literature emerged within this period, coinciding with the rapid maturation of DT, AI/ML and IoT from theoretical frameworks to practical applications (see Figure 2). Figure A1 in Appendix presents the full Scopus trend from 2004 to 2025, demonstrating a clear acceleration in publication output from 2020 onward, which justified this temporal scope. Subject-area distribution of the 475 filtered records showed a concentration in Engineering (45%), Environmental Science (28%) and Earth and Planetary Sciences (14%), consistent with the interdisciplinary scope of the review.
2.2 Screening and selection process
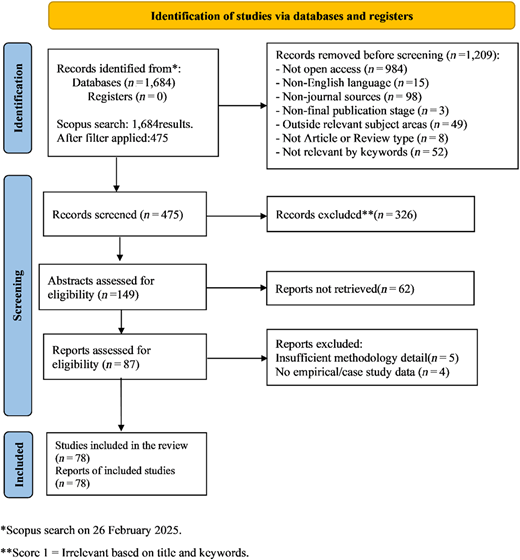
The screening and selection process followed PRISMA 2020 standards (Page et al., 2021), involving three progressive evaluation stages with escalating criteria. Initially, 475 records were subject to title and keyword screening.
A three-level scoring system was used, assigning score 3 for high relevance, score 2 for partial relevance and score 1 for irrelevance, resulting in the exclusion of 326 records (score 1) and leaving 149 records for abstract evaluation. In the second stage, the 149 abstracts were screened using refined criteria and 62 records were excluded, resulting in 87 cases eligible for full-text retrieval. Although efforts were made to access all full-text articles, nine studies were excluded for insufficient methodology (n = 5) and lack of empirical grounding (n = 4), yielding 78 studies. The diagram illustrating the numerical transitions and exclusion reasons is shown in Figure 3.
Quality assurance was ensured through rigorous inclusion criteria instead of formal appraisal tools. This approach aligns with exploratory SLR methodology (Templier and Paré, 2015), which differs from medical systematic reviews requiring standardised instruments (e.g., CASP, Cochrane). All 78 included studies met baseline quality standards, comprising peer-reviewed, Scopus-indexed, methodologically transparent and empirically grounded studies.
2.3 Data extraction phase
To facilitate the emergence of a technology taxonomy from the evidence (RQ1), the bibliometric software VOSviewer version 1.6.18 was used to analyse term co-occurrence before systematic qualitative coding. A total of 78 papers extracted from Scopus in RIS format were imported for automatic extraction of terms from titles, abstracts and keywords.
The terms were selected based on a minimum frequency of three papers. The VOS mapping algorithm produced a network layout using the LinLog/modularity normalisation method. The resolution parameter was set to 1.0 to enhance cluster detection, enabling data-driven identification of thematic links and technology groupings. A sensitivity study verified core cluster stability across parameter modifications (minimum occurrence: 2–5; resolution: 0.8–1.5).
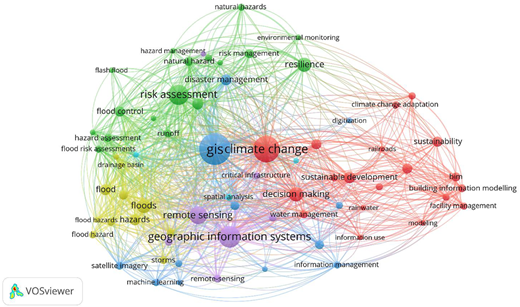
The keyword co-occurrence network visualisation, produced by VOSviewer, highlights the thematic relationships among frequently occurring terms in the literature (see Figure 4 and Supplementary Material S1). Each coloured cluster in the visualisation corresponds to a group of keywords that frequently appear together, indicating distinct research themes. BIM and GIS were intentionally used as platform-level analytical anchors, as they function as integrative environments through which multiple digital technologies are discussed in the literature, rather than as standalone tools. Accordingly, additional enabling technologies were not predefined but were allowed to emerge inductively from keyword co-occurrence patterns. Table 2 summarises the six identified clusters, their associated technologies and corresponding research themes. Collectively, these interconnected clusters illustrate the interdisciplinary landscape of climate resilience research, highlighting how multiple digital technologies emerge around BIM and GIS as core platforms, forming the empirical basis of the seven-technology framework developed in this study.
2.4 Systematic qualitative coding using NVivo
NVivo 14 was selected for its capacity to manage 78 simultaneous files and its full audit trail functionality supporting reproducibility. A hybrid coding strategy was adopted, combining deductive elements, where VOSviewer-derived keyword clusters established the initial coding framework, with inductive elements that allowed additional themes to emerge during manual review (Jackson and Bazeley, 2019). The coding framework consisted of three main categories and seventeen subcategories based on VOSviewer: (1) Digital Technologies (seven technologies), (2) Climate Resilience Strategies (six themes) and (3) Environmental Monitoring (four domains). Each category contained operational definitions sourced from the VOSviewer contexts, ensuring conceptual consistency across the coding process (refer to Table A1). The full NVivo 14 coding query results are provided in Supplementary Material S2.
The hybrid protocol began at stage 1, which involved automated text search queries utilising keywords derived from VOSviewer. All 78 imported papers were searched systematically in this manner, with query results saved and exported for subsequent review. In Stage 2, thorough manual validation was conducted, involving paper-level review of extracted text segments against predefined operational definitions, verification of abstracts and methodologies, and coding adjustments where automated queries produced irrelevant results. As coding was conducted by a single researcher, reliability was strengthened through two mechanisms: all codes were anchored to explicit operational definitions developed before coding; and the full coded output was reviewed by the research team before synthesis (Miles et al., 2014).
3. Results
3.1 Evidence-based characteristics and integration patterns
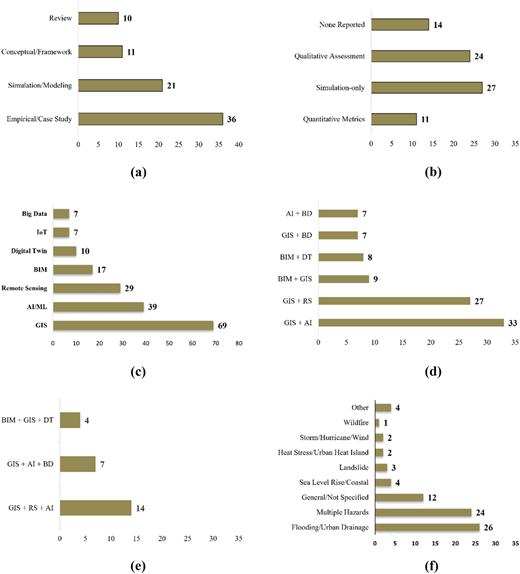
Table A2 in Appendix presents the 78 included studies that were systematically analysed across seven dimensions: study types, geographic distribution, technology usage, integration patterns, climate hazards, resilience strategies and stakeholder engagement, to establish the empirical foundation for technology-specific discussions (Sections 3.2–3.7). Figure 5 summarises dataset features, identifying key trends in methodological approaches, evidence maturity, technology convergence and implementation settings.
Methodological analysis (Figure 5a) shows that empirical case studies (46.2%, n = 36) and simulation/modelling studies (26.9%, n = 21) constitute 73.1% of research, providing empirical or simulation-based data. This dominance of applied and simulation-based approaches signals a maturing research field that has moved beyond purely theoretical proposals. However, performance validation is limited (Figure 5b), with just 14.1% (n = 11) reporting quantitative resilience measurements and 34.6% (n = 27) relying solely on simulation findings without real-world validation. This validation gap is analytically significant: while implementation is accelerating, the absence of quantitative operational evidence means that policy decisions are being made on largely unverified performance data, positioning most applications at proof-of-concept rather than the deployment-ready stage.
Technology adoption patterns (Figure 5c) reveal that, GIS (88.5%, n = 69) is the most frequently used platform, followed by AI (50%, n = 39) and RS (37.2%, n = 29), BIM (21.8%, n = 17), DT (12.8%, n = 10), IoT (9%, n = 7) and BD (9%, n = 7). GIS's near-universal adoption reflects its foundational role as a platform for spatial integration rather than simply one tool among many. Conversely, the low adoption of IoT (9%) and BD (9%) discloses that real-time data infrastructure and large-scale analytics remain underdeveloped, a critical structural gap that prevents the digital ecosystem from moving beyond spatial analysis towards predictive and adaptive operations. Two-technology integration (Figure 5d) shows GIS paired most frequently with AI (42.3%, n = 33) and RS (34.6%, n = 27). BIM is integrated primarily with GIS (11.5%, n = 9) and DT (9%, n = 7). Considering Figure 5e, the GIS-RS-AI combination is the most common three-technology integration (17.9%, n = 14), followed by GIS-AI-BD (9%, n = 7). BIM-GIS-DT convergence occurs in 5.1% (n = 4) of studies. The prevalence of GIS-centred pairing confirms that integration remains predominantly within the spatial-analytical layer, while the rarity of BIM-GIS-DT convergence (<5%) suggests that institutional and governance barriers, rather than purely technical incompatibilities, are the main obstacles to accomplishing fully integrated ecosystems.
Climate hazard analysis (Figure 5f) shows a focus on floods (33.3%, n = 26) and multiple-hazard methods (30.8%, n = 24). This flood dominance reflects the measurability of flood damage and the maturity of GIS and RS tools for hydrological modelling. However, heat stress (2.6%) and wildfire (1.3%) remain largely overlooked despite their direct implications for pavement integrity, structural stability and drainage performance, representing a significant gap that limits the applicability of current evidence as climate projections extend beyond flood-dominated scenarios. Resilience strategy and stakeholder distributions are summarised in Table 3. The dominance of risk assessment approaches (39.7%, n = 31) indicates the field remains predominantly diagnostic rather than prescriptive. The near-absence of private-sector and community actors (<5%) further reveals a governance gap that partially explains why technically demonstrated solutions have not yet translated into scalable implementation pathways.
Table 4 presents a cross-tabulation of technology applications by study type, revealing uneven maturity across the digital ecosystem. GIS dominates across all study types (78–90%), confirming its universal foundational role. In comparison, AI is stronger in conceptual frameworks (67%) and simulation studies (60%) than in empirical research (38%), indicating more theoretical than operational validation. Most critically, DT appears in only 3% of empirical studies despite featuring in 33% of review papers, representing the most significant maturity gap. This disparity likely reflects high implementation costs and data-integration requirements that limit real-world deployment, combined with limited organisational readiness among municipal agencies to operate sensor-linked simulation systems, meaning DT's current value remains largely conceptual rather than operational. This gap also signals that DT's role in supporting full-lifecycle infrastructure management remains aspirational, since real-time simulation requires the BIM and IoT foundations that are themselves still underdeveloped.
The cross-cutting synthesis highlights three fundamental patterns. First, while pairwise technology integration is now well-established, comprehensive convergence across BIM, GIS, DT and IoT simultaneously remains rare (<5%), suggesting that institutional barriers rather than technological limitations are the primary obstacle. Second, despite growing implementation evidence (73.1%), quantitative validation remains limited (14.1%), indicating that the field is advancing deployment faster than it is verifying real-world performance. Third, the concentration of research in advanced economies with a dominant focus on flooding means that current evidence offers limited guidance for resource-constrained or non-coastal urban contexts. The integration patterns, challenges and future directions associated with each technology are further elaborated in the technology-specific subsections (Sections 3.2-3.7), with cross-references to Figure 6 and Tables 5–7 providing visual synthesis across all seven technologies.
The literature also reveals methodological contradictions that complicate maturity assessments. DT is portrayed as near-mature in conceptual and review studies (33%) yet appears in only 3% of empirical research, while AI is similarly more prevalent in conceptual (67%) and simulation (60%) work than in empirical deployment (38%). This gap between conceptual optimism and empirical caution indicates that technology potential is often overstated relative to demonstrated performance, a distinction practitioners and policymakers should weigh carefully.
Technology use also varies meaningfully by hazard focus and validation approach (Table A3, Appendix). GIS remains near-universal across both dimensions (82–100%), confirming its role as the foundational platform regardless of hazard type or evidence base. In contrast, BIM and DT are markedly more common in studies without a specific hazard focus (77% and 31%) than in flood-specific studies (11% and 4%), indicating these technologies are currently applied more in general infrastructure modelling than in hazard-targeted resilience work. A similar pattern holds for validation: DT and BD are proportionally more frequent among studies reporting no empirical evidence (29% and 21%) than among those with quantitative validation (9% each), reinforcing that these technologies' resilience claims remain largely unverified relative to more established tools such as GIS and RS.
3.2 Geographic information systems applications
GIS is the most used technology in the reviewed corpus (88.5%, n = 69), often integrated with AI (42.3%, n = 27) and RS (34.6%, n = 27), with applications focused on flooding scenarios (33.3% of studies, n = 26), as stated in Section 3.1.
Ahmad et al. (2024) developed a GIS-Storm Water Management Model (SWMM) framework to identify flood-prone areas, assess stormwater system capacity and improve drainage infrastructure using Low-Impact Development (LID) practices in Lahore. Chamorro et al. (2023) introduced Sistema Integrado de Gestión del Riesgo–Redes Viales (SIGeR-RV) in Chile, a GIS-based risk management system designed for road networks exposed to multi-hazards. The platform integrates hazard maps, social vulnerability assessments and mitigation strategies to support proactive climate adaptation. In Southeast Texas, Amer (2024) examined the impact of climate change and Sea-Level Rise (SLR) on coastal road infrastructure. Utilising GIS-based modelling with NASA's SLR projections, researchers employed a 1-metre Digital Elevation Model and historical sea-level measurements to simulate inundation scenarios under different SLR conditions. The study recommended enhancing GIS flood models with higher resolution and integrating real-time climate data for dynamic infrastructure risk assessment.
Li et al. (2023) utilised GIS software to process multiple spatial datasets, including population density, road networks and land use data, to analyse environmental factors and aid the climate adaptation plan. Ahmad et al. (2024) employed GIS for air pollution modelling, assessing the relationship between vehicle emissions, heat stress and urban road resilience. GIS facilitated the mapping of pollution dispersion across road networks and identified emission hotspots contributing to urban heat islands. In Poland (Czyża and Kowalczyk, 2024), GIS and RS were used to optimise the placement of Blue-Green Infrastructure (BGI) to enhance climate resilience and urban liveability. The study highlighted the necessity of standardised GIS data formats, interoperability and the integration of open-source GIS platforms to enhance data accessibility and infrastructure sustainability.
Rezvani et al. (2023) highlighted GIS as a critical tool for urban resilience, disaster risk reduction and decision-support systems, emphasising the need for standardised frameworks and AI-driven simulations for risk assessment. Another study by Kaya et al. (2024) applied GIS-based modelling to assess tornado risk, community vulnerability and resilience in Texas and Mexico. GIS was utilised to map tornado hazard distribution and quantify road network disruptions due to tornado debris, an often-overlooked factor in disaster planning. Identified research gaps included the lack of a unified urban resilience model, the need for GIS-driven multidimensional tools and the integration of AI-based stochastic simulations for risk assessment.
3.3 Building information modelling applications
BIM appears in 21.8% (n = 17) of studies, primarily integrating with GIS (11.5%, n = 9) and DTs (9%, n = 7), as shown in Section 3.1. BIM integration improves efficiency and sustainability in publicly funded projects, and when combined with AI and smart city technologies, promotes multidisciplinary cooperation and decision-making (Hetemi et al., 2020). However, institutional challenges such as regulatory compliance and coordination must be addressed. Spain's Ministry of Development actively promotes BIM through the Innovation Plan for Transport and Infrastructure. Combining BIM with GIS and Life Cycle Assessment (LCA) optimises material selection and reduces carbon emissions, despite challenges such as decentralised workflows and interoperability issues (Hetemi et al., 2020; Zubair et al., 2024).
Kaewunruen et al. (2023) examined the applications of BIM and DT technologies in railway bridge maintenance and climate adaptation management. Their study demonstrates how integrating BIM reduces project costs, lowers greenhouse gas emissions and enhances infrastructure resilience to climate-related challenges. Through improved asset management and life cycle monitoring, the combination of BIM and DT improves transport infrastructure sustainability and operational efficiency.
Jrade et al. (2023) studied how to enhance infrastructure project decision-making by combining Bridge Information Modelling (BrIM) with Life Cycle Costing (LCC) and Life Cycle Assessment (LCA). The study demonstrates how BrIM improves sustainability and resilience by assessing environmental and financial factors. However, the lack of integration capabilities in existing LCA and LCC tools limits their effectiveness in identifying key attributes that enhance resilience. Also, Gilbert et al. (2021) investigated BIM integration with geospatial water utility networks to improve urban infrastructure resilience. By combining BIM with water distribution network models, their research demonstrates how spatial data can optimise network redundancy, reduce the risk of underground utility strikes and support long-term infrastructure planning.
3.4 BIM-GIS integration
BIM-GIS integration appears in 11.5% (n = 9) of reviewed studies, with BIM-GIS-DT convergence in 5.1% (n = 4), representing emerging integration maturity as determined in Section 3.1. GIS offers spatial information to enhance urban development and is commonly utilised for infrastructure planning and territorial analysis. BIM, on the other hand, provides fully detailed infrastructure modelling, improving urban project management and sustainability. BIM-GIS integration has been facilitated by open standards such as CityGML (City Geography Markup Language) and IFC (Industry Foundation Classes), as well as planning tools like ArcGIS and InfraWorks (Autodesk®) (Cepa et al., 2024).
Through improved network analysis models, studies show that combining GIS with emerging technologies like Machine Learning (ML) and AI can develop and improve urban resilience strategies (Isaac et al., 2024). In Islamabad, BIM 3D models have been effectively used to track energy efficiency and analyse environmental impacts, whereas GIS integration has optimised waste management, resulting in decreased emissions from construction. Additionally, LCA studies show that BIM-GIS integration can reduce GHG emissions at multiple stages of projects by 29.35% in materialisation and 21.14% in disposal stages (Zubair et al., 2024). This integration is also effective for bridge infrastructure: BIM reduces modelling time and integrates multi-source data into a unified model, improving climate impact studies, while GIS supports geospatial analysis to assess vulnerabilities. Furthermore, real-time inspection through Non-Destructive Testing (NDT) ensures structural integrity, and data-driven algorithms enable adaptive bridge design optimisation. (Pallante et al., 2024).
In addition to environmental sustainability, BIM-GIS integration greatly boosts disaster resilience and climate risk analysis. It has been used in wind hazard modelling, enhancing the resilience of infrastructure against extreme weather conditions like hurricanes. Using CFD simulations and high-resolution 3D models, planners can design infrastructure (Nofal et al., 2022). GIS-BIM integration also facilitates real-time automated design updates according to geospatial inputs, such that infrastructure can adapt to environmental conditions dynamically. This functionality is essential in post-disaster management, supporting damage assessment, resource planning and stakeholder engagement in building long-term climate resilience (Cepa et al., 2023a).
The integration of BIM-GIS also plays a pivotal role in infrastructure lifecycle management. For instance, the BIM-GIS-DCEs (Digital City Elements) approach enables system-of-systems-based flood vulnerability assessments, which aid in the evaluation of interconnected infrastructure, such as roads, buildings and drainage (Yang et al., 2021). Hetemi et al. (2020) explored how BIM-GIS integration enhances predictive maintenance in urban development infrastructure through automated design revisions utilising geospatial inputs. Despite these advantages, interoperability issues remain the primary bottleneck, particularly data format compatibility and information sharing between platforms. Addressing these issues and challenges requires developing standardised integration frameworks.
3.5 Remote sensing and IoT applications
RS appears in 37.2% (n = 33) of studies, frequently paired with GIS (34.6%, n = 27), as part of GIS + RS + AI triple integration (17.9%, n = 14), the most prevalent three-technology pattern. In contrast, IoT adoption remains limited (9.0%, n = 7), as shown in Section 3.1.
Amer (2024) in Southeast Texas used Light Detection and Ranging (LiDAR)-derived Digital Elevation Models (DEMs) and NASA's sea-level rise projections to simulate inundation scenarios for 2050 and 2100, demonstrating the increasing vulnerability of road networks under rising sea levels. RS data, including LiDAR and satellite imagery, were also employed to assess landslide risks and precipitation-runoff interactions in flood-prone areas through hydrologic models such as HEC-HMS (Hydrologic Engineering Center–Hydrologic Modelling System) and HEC-RAS (Hydrologic Engineering Center–River Analysis System), aiding infrastructure planning and climate adaptation (Rezvani et al., 2023).
Khan et al. (2023) used MODIS, ASTER, Landsat and RADARSAT satellite data for hazard mapping, flood modelling and disaster risk assessment, while Synthetic Aperture Radar (SAR) significantly improved flood detection in cloud-covered regions. In the Ganges River Delta, Lemenkova (2024) applied Landsat 8–9 OLI/TIRS satellite imagery, combined with deep learning algorithms, to perform real-time flood monitoring and vulnerability assessments, improving climate resilience strategies. Additionally, GIS and RS techniques have been integrated for wildfire risk modelling, where LiDAR and satellite imagery were used to evaluate bridge vulnerability and resilience (Daud et al., 2024).
RS has been effectively applied in urban ecological planning to optimise the placement of BGI (Blue-Green Infrastructure) and assess climate adaptation strategies. Czyża and Kowalczyk (2024) utilised geospatial data in Poland, including remote sensing data supported by GIS technology, to identify and optimise the location selection process for BGI components. In another study, the integration of FABDEM, Sentinel-2 and USGS datasets contributed to soil property analysis, road network assessments and bridge inventories, aiding long-term infrastructure resilience (Loli et al., 2022). Additionally, UAV-based LiDAR scanning has been used for high-accuracy infrastructure modelling, enhancing the monitoring and evaluation of road networks (Arvidsson et al., 2021). RS has also been applied in bridge and road infrastructure resilience, with high-precision 3D models used to assess structural integrity and identify climate-related vulnerabilities (Pallante et al., 2024).
IoT-enabled GIS and remote sensing systems help track environmental changes, assess infrastructure vulnerabilities and support adaptive planning in arid regions with limited land area (Li et al., 2023). In coastal regions, IoT-driven sensor networks strengthen GIS-based inundation models by continuously monitoring sea-level rise and its impact on roadways (Amer, 2024). IoT integration with BIM enhances infrastructure sustainability by improving data-driven decision-making in urban and hydropower development projects (Fekete and Nehren, 2024). RS technologies, including MODIS, ASTER and Landsat, work alongside IoT sensors to improve disaster risk mapping and flood forecasting, enhancing infrastructure protection and resource allocation (Wangchuk et al., 2024). Moreover, IoT-based real-time data-sharing initiatives, such as LiDAR-based flood mapping and wildfire adaptation strategies, enable cross-border collaborations for disaster preparedness (Daud et al., 2024).
3.6 Digital twin applications
DT technology appears in 12.8% (n = 10) of studies, primarily integrated with BIM (10.3%, n = 8) and part of emerging BIM-GIS-DT convergence (5.1%, n = 4) (Section 3.1). DT applications address multiple hazards (30.8% of studies) through real-time monitoring and adaptive management, though evidence relies heavily on simulation-only validation (34.6% across the corpus) rather than operational deployment metrics.
Vishnu et al. (2024) emphasised that DT applications for environmental monitoring of road resilience have been integrated into catastrophe risk assessment and analysis, particularly for water-related infrastructure. A notable example is in Cosenza, Italy, where a Decentralised Real-Time Control (DRTC) system combined AI and hydrodynamic models to mitigate flooding and sewer overflows (Saddiqi et al., 2023). Moreover, Web-GIS and DT frameworks have been utilised for road network risk assessment, disaster monitoring in urban areas and seismic risk. Integrating Web-GIS with real-time data sources enables near-instantaneous disaster evaluation and improved connectivity with emergency management systems (Daud et al., 2024).
The Polyfytos Bridge in Greece case study demonstrated the use of high-resolution UAV imagery, photogrammetry and Persistent Scatterer Interferometry (PSI) with satellite imagery to continuously monitor deformations and prediction (Argyroudis et al., 2022). Similarly, the Minnamurra Railway Bridge in Australia leveraged DT technology to predict maintenance needs, assess climate impacts and improve long-term sustainability through real-time data collection (Kaewunruen et al., 2023).
Another critical application of DT for climate resilience is in emergency response and evacuation planning. Following the Fukushima nuclear accident, DT models integrated with UAVs were used to optimise evacuation routes, helping reduce road congestion and improving response times during radiation hazards or extreme weather events (Kim et al., 2023). Large-scale agent-based simulation models have also been employed to analyse evacuation behaviour during disasters such as tsunamis, underscoring the role of road resilience in ensuring public safety. The UK's National Underground Asset Register (NUAR) initiative and the Centre for Digital Built Britain (CDBB) have employed DTs to map water distribution networks and underground assets. This prevents accidental strikes during excavation and enhances road sustainability (Gilbert et al., 2021).
3.7 Artificial intelligence and big data applications
AI appears in 50.0% (n = 39) of studies, most frequently paired with GIS (42.3%, n = 33) and as part of GIS + RS + AI integration (17.9%, n = 14) and GIS + AI + BD integration (9.0%, n = 7), demonstrating growing adoption, while BD adoption remains limited (9.0%, n = 7) as established in Section 3.1. AI strengthens data processing from DT models, GIS spatial analysis and BIM-driven infrastructure management, whereas BD integrates heterogeneous environmental datasets for risk assessment.
AI and ML improve data quality, automate spatial development monitoring and integrate with GIS, BIM and DT to boost infrastructure planning and disaster preparedness (Isaac et al., 2024). AI applications enhance road resilience by leveraging computer vision for urban classification (Isaac et al., 2024), predictive modelling for water failures and real-time hazard mapping using Sentinel-3 satellite images (Rezvani et al., 2023). They also facilitate real-time updates for road infrastructure through open-source data, RS and automated land use detection (Czyża and Kowalczyk, 2024). In the transport sector, AI enhances BIM adoption by supporting decision-making in infrastructure projects (Hetemi et al., 2020), while ML-based models like Boosted Regression Trees (BRT) and Generalised Linear Models (GLM) improve flood risk assessment (Rezvani et al., 2023). Furthermore, AI-driven DTs provide real-time infrastructure monitoring and predictive analytics for climate adaptation (Argyroudis, 2022). AI supports disaster risk management by assessing vulnerabilities in road networks through ML algorithms that integrate seismic, flood and landslide data (Daud et al., 2024). ML models such as Random Forest (RF) and Support Vector Machines (SVM) enhance flood prediction accuracy using satellite imagery (Lemenkova, 2024), while AI-driven UAV inspections help mitigate risks related to transmission line failures and wildfires (Fekete and Nehren, 2024). Despite these advancements, challenges remain, including data privacy concerns, interoperability issues and the need for regulatory frameworks to support AI integration into climate-resilient infrastructure planning (Argyroudis, 2022).
BD supports infrastructure resilience through flood risk assessment, stormwater management, climate adaptation and disaster response (Wangchuk et al., 2024). Multi-source data fusion, like SAR imagery and data fusion techniques, has been utilised to detect inundated areas in flood risk assessment, as indicated by Pakistan's 2022 mega-flood. Additionally, Google Earth Engine supports real-time flood monitoring, while hydrological and meteorological models improve preparedness (Khan et al., 2023). Beyond disaster resilience, BD-driven and GIS simulation frameworks optimise stormwater management in sponge city projects, urban drainage systems and airports (Saddiqi et al., 2023). In urban climate adaptation, BD and GIS support wind corridor planning to mitigate urban heat island effects and enhance air quality (Wu and Shan, 2024). Furthermore, a geospatial framework assesses urban infrastructure resilience, evaluating access flexibility, disruption risk and vulnerability (Haces-Garcia et al., 2022).
4. Discussion
4.1 Multi-scale technology integration framework
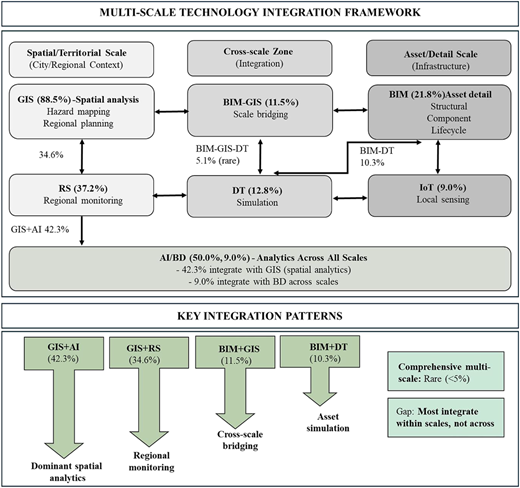
Figure 6 presents the Multi-Scale Technology Integration Framework, illustrating how smart technologies are functionally positioned across three operational scales. Spatial technologies, such as GIS and RS, operate at city and regional scales for hazard mapping and environmental monitoring, while asset-level technologies, BIM and IoT emphasise infrastructure-specific modelling and component-level sensing. This function differentiation positions GIS for broader spatial context and regional hazard exposure, while BIM focuses on component-level vulnerability assessment for lifecycle management and climate adaptation planning.
DTs synthesise these inputs with real-time sensor data to simulate infrastructure performance under varying climate conditions. At the apex, AI and BD provide analytical optimisation. Across all tiers, through bidirectional feedback, GIS provides spatial inputs to BIM, which feeds DT simulations. IoT and RS provide real-time data updates to DTs. AI/Big Data refines spatial analysis, structural designs and adaptive control across all levels. The framework directly addresses the deployment gap evident in the literature: while GIS is near-universally adopted (88.5%), cross-scale convergence involving BIM, GIS and DT simultaneously is achieved in only 5.1% of studies, confirming that the upper integration tiers remain an implementation frontier. By defining clear functional roles and bidirectional connections, the framework enables progression from isolated GIS deployment towards integrated multi-technology ecosystems.
4.2 Contributions
This review identifies four contributions that advance beyond previous systematic reviews in this domain, as summarised in Table 5. First, it highlights a multi-technology integration gap, revealing that while adoption of multiple technologies is common, comprehensive cross-scale convergence remains rare, pointing to institutional rather than purely technical barriers. Second, it establishes an empirically derived technology hierarchy and implementation sequence, positioning GIS as the dominant spatial integration hub from which a more complex multi-technology ecosystem can be systematically developed. Third, it exposes an evidence-practice validation gap, as most studies rely on empirical or simulation approaches, yet few report quantitative resilience measurements. Fourth, it maps bibliometric patterns of field evolution, identifying temporal concentration, geographic skew towards advanced economies and hazard concentration as a structural limitation of the current evidence base.
Compared with the three closest peer SLRs, this review offers three specific advances: de Abreu et al. (2022) examined climate adaptation strategies for road transport without synthesising multi-technology interactions or deriving an implementation sequence, Argyroudis (2022) addressed digital technologies for infrastructure resilience broadly across multiple infrastructure types rather than specifically for urban roads and Castañeda et al. (2024) examined BIM applications in road projects in isolation rather than within an integrated multi-technology ecosystem. This review uniquely combines bibliometric analysis and qualitative coding to empirically derive both a technology hierarchy and a challenge-solution framework tailored specifically to climate-resilient urban road infrastructure.
4.3 Challenges and limitations
Smart technologies have high potential to improve the resistance of urban road infrastructure to climate change. However, as shown in Table 6, several significant difficulties and challenges persist. First, data integration and interoperability issues are major obstacles. Data integration: 74.4% multi-technology but 5.1% comprehensive integration; BIM-GIS-DT limited to 5.1% despite CityGML/IFC standards, suggesting institutional rather than purely technical barriers. Another major challenge involves Technological maturity, which can delay and hinder implementation, especially in resource-constrained urban areas. Concerning validation gaps, there is evident technological maturity: only 14.1% (n = 11) offer quantitative resilience measurements, while 73.1% give implementation proof and 34.6% (n = 27) depend solely on simulation-based validation. Despite AI (50.0%), DT (12.8%) and IoT (9.0%) adoption, most are proof-of-concept. In addition, the escalating impacts of climate change exacerbate existing vulnerabilities in urban road networks. Traditional infrastructure systems, including drainage systems and structural designs, are often unable to withstand severe floods, heat stresses and extreme weather events, increasing the risk of operational failures. Moreover, Climate-exacerbated vulnerabilities reveal hazard coverage imbalances (flooding 33.3%, heat 2.6%, wildfire 1.3%), limiting adaptation guidance diversity.
Furthermore, governance and policy fragmentation restrict coordinated resilience measures. The integration of digital technologies into urban infrastructure systems is often hampered by insufficient inter-agency collaboration, inconsistent regulatory frameworks and a lack of geographic distribution (more than 70% of advanced economies. Moreover, digitising urban infrastructure poses significant cybersecurity and privacy risks. Minimal systematic attention represents an evidence gap. Lastly, socio-technical barriers hinder the transition to smart and climate-resilient infrastructures. Implementing advanced technologies is hindered by a lack of interdisciplinary experience, resistance to adopting new digital tools and inadequate practical training for agency staff. Socio-technical barriers manifest in low stakeholder diversity (<5% community, <5% private sector), indicating a technical demonstration focus over diverse implementation contexts.
As an exploratory SLR, several methodological limitations warrant acknowledgment. The single-database approach (Scopus only) may exclude relevant studies in other repositories; formal duplicate-rate reporting was not applicable, and Scopus's automatic deduplication was relied upon during export. The 2020–2025 temporal focus and English-language restriction limit historical perspective and linguistic diversity, while geographic concentration (∼70% advanced economies) constrains generalisability to resource-limited contexts. The inductive framework anchored to BIM and GIS potentially biases results towards these platforms. Geographic region was not cross-tabulated against technology use, as approximately one-third of the corpus lacks a specified country context, which would render a regional breakdown unreliable. Similarly, infrastructure lifecycle phase was not systematically coded during data extraction and is therefore not available as a cross-tabulation dimension; future reviews should incorporate lifecycle stage (design, construction, operation, maintenance) as an explicit coding category. These limitations are offset by PRISMA-compliant procedures, hybrid coding validation and comprehensive multi-dimensional analysis.
The single-database approach (Scopus only) may exclude relevant studies indexed exclusively in Web of Science or IEEE Xplore. In particular, highly technical IoT and sensor network studies published in IEEE journals, and grey literature on municipal infrastructure pilots, are likely underrepresented in the current corpus. This limitation is partially offset by Scopus coverage exceeding 95% of engineering and environmental journals relevant to this domain.
4.4 Future directions
This research provides different future perspectives summarised in Table 7. Future research should prioritise standardised framework integration, addressing the gap where 74.4% employ multiple technologies, yet <5% achieve comprehensive integration. Existing standards, CityGML and IFC for spatial-asset interoperability, and ISO 19650 for information management, offer agencies an adoptable starting point for smart infrastructure management, rather than requiring new protocol development. Furthermore, developing dynamic modelling capacities is a crucial research field. Future research should enhance validation frameworks, currently at 14.1% quantitative metrics, through explainable AI, standardised calibration and transfer learning. Expanding GIS and RS applications with multi-source data, higher-resolution imagery and predictive climate models can address hazard imbalances (flooding 33.3%, heat 2.6%, wildfire 1.3%).
Policy development and institutional strengthening are critical for successfully integrating smart technology into urban infrastructure. Future research should address fragmentation, evidenced by 70% concentration in advanced economies and minimal cybersecurity evaluation. Empirical validation through real-world pilots in coastal cities (33.3% flooding focus) and resource-constrained contexts (30% corpus) with 2-year monitoring can bridge the evidence-practice gap (73.1%→14.1%). Addressing the socio-technical aspects is crucial for sustainable and equitable resilience infrastructure. Capacity-building initiatives should address stakeholder gaps (<5% community, <5% private sector) through interdisciplinary training. Interdisciplinary collaboration requires defined roles: urban planners apply GIS for spatial analysis, engineers use BIM for asset management, data scientists develop AI/ML analytics and policymakers establish governance frameworks. Collaboration enablers include co-creation workshops, cross-training programs (GIS for engineers, structural principles for planners), integrated project teams and shared BIM-GIS digital platforms addressing stakeholder diversity gaps of <5%, such as interdisciplinary training programs for urban planners, engineers and policymakers. Public engagement initiatives should aim to improve community acceptance of smart infrastructure projects. Finally, combining Nature-Based Solutions (NBS) with digital monitoring and DT simulation can improve environmental resilience. These multidisciplinary approaches are crucial for creating resilient and sustainable urban road infrastructure networks that can withstand future climatic risks.
Implementation requires phased deployment: Phase 1 (1–2 years) establishes GIS mapping and sensor networks, requiring primarily staff training and software licensing rather than major capital investment; Phase 2 (3–5 years) advances BIM-GIS integration, prioritised for coastal/developed contexts, as demonstrated by Zubair et al. (2024), where BIM-GIS integration reduced GHG emissions by 29.35% in materialisation stages; Phase 3 (5+ years) implements DT and AI systems, following examples such as Kaewunruen et al. (2023), where DT-based railway bridge monitoring reduced project costs and emissions through improved lifecycle management. Given that U.S. Road maintenance alone costs $134 billion annually (Chinowsky et al., 2013), the incremental costs of digital-ecosystem adoption should be evaluated against this existing baseline rather than as a standalone expense. Developing countries should prioritise cost-effective GIS + RS combinations; coastal cities emphasise flood monitoring while inland cities focus on heat management. These phases align with, rather than duplicate, existing municipal capital planning and asset-management cycles: GIS mapping (Phase 1) supports routine infrastructure inventory updates, BIM-GIS integration (Phase 2) aligns with scheduled infrastructure renewal budgets and DT/AI deployment (Phase 3) can be introduced alongside major asset-management system upgrades rather than as a parallel investment stream.
4.5 Integrated framework synthesis
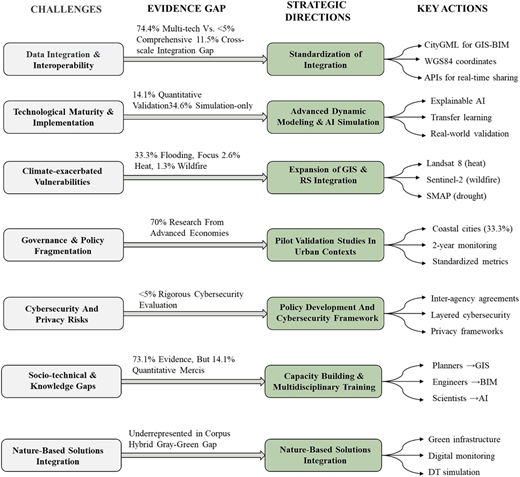
Figure 7 presents the Integrated Challenges-Solution Framework, synthesising the seven evidence-based challenges identified in Table 5 with the seven-priority research and implementation directions in Table 6. The framework reveals three critical analytical insights. First, the most urgent priority is standardisation (Priority 1), not because it is the most technically complex, but because it is the prerequisite for all other integration advances. First, the most urgent priority is standardisation (Priority 1), not because it is the most technically complex, but because it is the prerequisite for all other integration advances: 74.4% of studies employ multiple technologies, yet fewer than 5% achieve comprehensive cross-scale integration. Without common data exchange protocols. Without common data exchange protocols (CityGML for GIS-BIM integration, WGS84 coordinate systems for spatial consistency and APIs for real-time data sharing), the progression from pairwise GIS-centred integration towards a comprehensive multi-scale ecosystem cannot occur, regardless of advances in AI or DT capabilities. Second, the validation gap represents the field’s most significant structural weakness. The disconnect between widespread implementation evidence (73.1%) and limited quantitative validation (14.1%) means that policy decisions are being made on largely unverified performance evidence. This is addressed through two complementary priorities: Priority 2 (Advanced Dynamic Modelling and AI Simulation), which improves model calibration and explainable AI to strengthen simulation-based evidence through improved transparency and transfer learning for cross-context model adaptation and Priority 5 (Pilot Validation Studies), which targets real-world validation in coastal cities and resource-constrained settings, the two most underrepresented urban contexts.
Priority 3 (Expansion of GIS and RS Integration) responds to the hazard imbalance, addressing the underrepresentation of heat stress (2.6%) and wildfire (1.3%) relative to flooding (33.3%), through multi-source RS and predictive climate models, especially through Satellite platforms including Landsat 8 for heat stress monitoring, Sentinel-2 for wildfire detection and SMAP for drought assessment. Priority 4 (Policy Development and Cybersecurity Frameworks) addresses the geographic skew, as the concentration of over 70% of studies in advanced economies reflects governance and institutional fragmentation that cross-sectoral policy frameworks must overcome. Practical governance mechanisms should include inter-agency agreements for cross-sectoral data sharing, layered cybersecurity protocols for connected infrastructure systems and privacy frameworks to regulate data collection and access.
Priority 6 (Capacity Building and Multidisciplinary Training) targets the stakeholder diversity gap, where community and private sector actors appear in fewer than 5% of studies. Capacity-building initiatives should follow defined disciplinary pathways: planners developing GIS-based spatial analysis skills, engineers acquiring BIM-based asset management competencies and data scientists leading AI and ML analytics development. Priority 7 addresses Nature-Based Solutions integration, an underrepresented but analytically important dimension. Priority 7 addresses Nature-Based Solutions integration, an underrepresented but analytically important dimension: only 5.1% (n = 4) of reviewed studies incorporate Nature-Based or green infrastructure strategies (Table A2). Hybrid grey-green infrastructure approaches combining digital monitoring with ecological resilience strategies have been largely overlooked in the current evidence base. Future directions should encompass green infrastructure planning supported by digital monitoring systems and DT simulation frameworks. Together, these seven priorities form a sequenced implementation pathway rather than a parallel menu of options, where standardisation and validation form the foundational layer upon which geographic expansion, governance reform and capacity building can be systematically built.
5. Conclusion
This systematic literature review synthesised 78 peer-reviewed studies (2020–2025) to investigate how smart technologies can collectively enhance the climate resilience of urban road infrastructure, employing PRISMA-compliant selection, VOSviewer bibliometric analysis and an NVivo hybrid coding strategy.
Addressing RQ1, seven core technologies – GIS, AI, RS, BIM, DT, BD and IoT – collectively form an integrated digital ecosystem for climate-resilient urban road infrastructure. However, this ecosystem is currently incomplete in practice: GIS functions as the near-universal spatial foundation while IoT and BD remain significantly underutilised, implying that investment strategies must prioritise closing these adoption gaps to enable the real-time data flows and predictive analytics the ecosystem requires.
Regarding RQ2, the Multi-Scale Technology Integration Framework establishes that technologies operate across spatial, cross-scale and asset levels through bidirectional data flows. The empirically derived deployment sequence (GIS → RS → BIM → DT → AI/BD) offers practitioners a structured adoption pathway. Critically, cross-scale convergence involving BIM, GIS and DT simultaneously remains rare in current practice, indicating that institutional and governance barriers, rather than technological limitations, are the primary obstacle to achieving fully integrated digital ecosystems.
In response to RQ3, six interconnected barriers constrain integrated deployment: data interoperability, technological immaturity, hazard coverage imbalance, governance fragmentation, cybersecurity risks and socio-technical gaps. Three actionable recommendations emerge from these findings: first, standardisation of data exchange protocols (CityGML, IFC, SensorML) as a policy prerequisite for integration; second, bridging the evidence-practice gap through improved model calibration and explainable AI simulation, and real-world pilot validation in coastal and resource-constrained contexts; and third, governance reform should incorporate cross-sectoral collaboration and private sector engagement to address the predominantly academic and municipal implementation context that currently limits scalability.
This review contributes an evidence-based technology ecosystem framework, an empirically derived deployment sequence and a challenge-solution pathway that collectively advance beyond prior reviews, which examined technologies in isolation. Key limitations include single-database coverage, English-language restriction and geographic concentration in advanced economies, which collectively constrain generalisability to diverse urban contexts. Future research should prioritise multi-database replication, longitudinal quantitative validation studies in underrepresented urban contexts and governance frameworks incorporating hazard diversification and capacity-building initiatives for resource-constrained settings. Together, these three directions are most likely to advance the field towards operationally validated, globally applicable climate-resilient infrastructure systems.
This systematic literature review did not involve primary data collection from human participants or animals. All data analysed were derived from published peer-reviewed literature.
The supplementary material for this article can be found online.