This paper aims to examine the impact of extended reality-enabled e-commerce platforms on centennial customer engagement (CE). With the emergence of extended reality, several challenges are posed to marketers, developers and firms. These challenges concern the future of adequately using these technologies to enhance e-service quality, relationship quality (RQ) and CE.
A survey-based research design was employed to analyze a sample of 340 e-commerce users in the study’s conceptual model, which depicted relationships between the constructs. The data is analyzed using a hybrid approach including “partial least squares” and “fuzzy-set qualitative comparative analysis.”
The findings support extending reality technologies into the foreseeable future to enhance CE. The data analysis reveals that CE is positively influenced by RQ, RQ is positively influenced by e-service quality and e-service quality is positively influenced by reality congruence (RC). However, the relationship between e-service quality and CE could have been more significant. Mediation analysis illustrates various trials followed from RC to CE by interplaying with different constructs in the model.
The study provides strategies for marketers and e-commerce website developers. It emphasizes the value of RC as an effective marketing tool to build customer relationships and achieve CE. In particular, understanding the effect of extended reality features as new dimensions to service quality provides new practical insights into consumer behavior in a virtual shopping environment.
Examining the phenomenon of user experience in an extended reality virtual shopping environment to enhance engagement in centennial consumers is an original approach. It contributes to experience and engagement research in marketing.
1. Introduction
The trajectory of e-commerce is poised for substantial growth, with an annual growth rate of 9.49% (CAGR 2024–2029), projecting a market volume of US$6,478bn by 2029 (Statista, 2023). In India, this expansion shall be driven by widespread smartphone adoption, the deployment of 5G networks and rising consumer affluence. With evolving e-commerce consumer behavior, there is a need for the convergence of physical and virtual spaces (Ashfaq et al., 2019). Extended reality (XR) technologies – comprising augmented reality (AR), virtual reality (VR) and mixed reality (MR) – are pivotal to this integration, enabling immersive interactions that blur the boundaries between physical and digital environments (Flavián et al., 2019; Tussyadiah et al., 2018; Xi and Hamari, 2021). These technologies enhance not only functionality but also the overall customer experience (Kar and Varsha, 2023).
Successfully integrating XR technologies into e-commerce platforms necessitates maintaining high service quality (SQ) (Gleim et al., 2025). Prior research highlights the importance of factors such as customer experience (Zulauf and Wagner, 2022), security protocols, data integrity (Van Aaken et al., 2019) and interactivity (Pantano et al., 2017) in fostering positive consumer experiences (Inman and Nikolova, 2017). XR technologies further enrich consumer experiences by enhancing vividness, immersion and instructiveness, which enhance reality congruence (RC), elevate e-service quality and boost user satisfaction (David et al., 2021; Flavián et al., 2019; Park and Yoo, 2020).
The integration of XR technologies can strengthen relationships between consumers and e-commerce platforms by fostering trust, commitment and the likelihood of recommendations (Hollebeek et al., 2020; Kowalczuk et al., 2021). From both service-dominant (S-D) and customer-dominant (C-D) perspectives, these relationships generate value through enhanced customer commitment, engagement and recommendations (Hu et al., 2019). Over time, these strengthened relationships contribute to improved cognitive and emotional well-being, delivering a highly immersive customer experience (Augustine and Adnan, 2020; Farshid et al., 2018; Godovykh et al., 2022). To fully realize XR’s potential, e-commerce platforms must focus on improving system quality, product informativeness, RC and interactivity, thereby fostering customer enjoyment, product affinity, trust and purchase intent (Herz and Rauschnabel, 2019; Kowalczuk et al., 2021; Singh et al., 2022).
SQ plays a crucial role in shaping customer trust and satisfaction by influencing emotional responses during goal-directed activities on digital platforms (Kaewkitipong et al., 2022). As customer engagement (CE) in e-commerce encompasses cognitive, affective and behavioral dimensions, the integration of XR technologies calls for a deeper understanding of this complex, multidimensional phenomenon (Flavián et al., 2019; Hollebeek et al., 2020). The Experiential Hierarchy Model (EHM) by Holbrook and Hirschman (1982) offers a theoretical foundation for understanding interactions with XR technologies, illustrating how stimuli are perceived, evaluated and processed to guide subsequent behaviors (Kowalczuk et al., 2021). While previous studies mainly explored consumer reactions to XR, particularly focusing on immersiveness and vividness (Gil-López et al., 2023; McLean and Wilson, 2019; Pizzi et al., 2019; Ricci et al., 2023; Xi and Hamari, 2021), this study extends the discourse by examining the functional mechanisms of XR. Specifically, it explores how RC and service interaction (SI) influence customer perceptions and engagement within XR-enabled e-commerce environments (Pizzi et al., 2019). These factors shape overall SQ perceptions and predict CE with XR services, ultimately driving behavioral responses (Brengman et al., 2022; Zhang and Song, 2022; Johnson and Grayson, 2005; Kalia et al., 2021; Mohamed Ali, 2020; Urdea and Constantin, 2021; Blut, 2016; Kalia and Paul, 2021; Lim et al., 2024).
This study employs a mixed-method approach by integrating partial least squares structural equation modeling (PLS-SEM) and fuzzy-set qualitative comparative analysis (fsQCA) to provide a comprehensive analysis of CE on e-commerce platforms (Kurtaliqi et al., 2024; Pappas and Woodside, 2021). The research question addressed through fsQCA is to examine which combination of explanatory factors best explains CE on an e-commerce platform. The objectives pursued through PLS-SEM include understanding how RC in e-commerce enhances SQ and drives consumer engagement, as well as proposing a conceptual framework for CE in XR-enabled e-commerce.
PLS-SEM is particularly effective for assessing the collective influence of independent variables on a dependent variable (Sukhov et al., 2023), offering insights into the primary drivers of engagement. FsQCA complements PLS-SEM by providing an asymmetric analysis of how combinations of explanatory factors interact to foster CE (Perdomo-Verdecia et al., 2024). This approach is vital for identifying diverse pathways that contribute to engagement, offering nuanced perspectives on the conditions that promote it. By focusing on the interplay of factors rather than their isolated effects, fsQCA enriches the findings from PLS-SEM (Zheng et al., 2023). The combined application of both methodologies ensures a thorough and robust analysis, facilitating a deeper exploration of the dynamic relationships between RC, SQ and CE in XR-enabled e-commerce environments. Through this dual approach, the study seeks to expand the body of knowledge on CE and offer actionable insights into how XR technologies can improve SQ and enhance CE.
2. Literature review
2.1 Experiential hierarchy model
The EHM provides a robust framework for understanding consumer responses by integrating affective, cognitive and behavioral dimensions. The model recognizes the dual role of reasoned information processing and experiential exploration, capturing the interplay between conscious and subconscious factors in consumer decision-making (Holbrook and Hirschman, 1982). To enhance e-commerce experiences, particularly within XR-enabled environments, it is essential to design interactions that capture consumers’ attention, evoke emotions and foster a deep sense of connection.
This study leverages the EHM as the theoretical foundation for understanding customer responses to XR in e-commerce. The EHM outlines a structured sequence of cognitive, affective and behavioral processes that explain how individuals perceive, evaluate and decide about stimuli encountered in their environment (Kowalczuk et al., 2021). Unlike consumer response models that focus mainly on value generation through consumption patterns, the EHM emphasizes the experiential nature of customer responses, making it particularly suitable for XR applications (Bascur and Rusu, 2020; Kranzbühler et al., 2018).
Moreover, the EHM aligns well with the customer journey framework, as both emphasize the experiential aspects of consumer interaction. To ensure analytical clarity and avoid unnecessary verbosity, we refined the review of XR literature to focus on key experiential mechanisms operating within e-commerce contexts. This framework enables a targeted analysis of how XR stimuli shape perceptions, emotions and behaviors throughout the customer journey.
2.2 Reality congruence (immersiveness and vividness)
Existing research highlights the combined influence of immersiveness and vividness in enhancing realism and authenticity within XR environments (McLean and Wilson, 2019; Qasem, 2021). However, many studies overlook differences in users’ perceptions of RC, defined as the degree to which virtual elements align with real-world expectations and perceptual experiences. In line with the presence literature, the form of presence most relevant to XR-enabled e-commerce is telepresence, which refers to the subjective feeling of being perceptually immersed in a mediated environment rather than physically situated in one. While telepresence captures this sense of “being there,” RC emphasizes the degree of coherence between users’ expectations and their sensory–perceptual experience of the virtual environment, ensuring that the interaction feels authentic and contextually meaningful (Kowalczuk et al., 2021).
In XR e-commerce, RC supports engagement and decision-making by strengthening the alignment between virtual and real-world interactions. For example, an AR try-on that accurately reflects the fit, color and texture of apparel demonstrates high RC and enhances user confidence and satisfaction (Bretos et al., 2024; Lai et al., 2024). While immersiveness and vividness enhance user experience, excessive levels may overwhelm some users, underscoring the importance of matching XR representations to user expectations (Kim et al., 2023). Focusing on RC provides a concise and analytically precise construct that predicts authentic behavioral outcomes, such as purchase decisions and CE, without relying on unnecessarily broad experiential labels (Kim et al., 2021; Kumar et al., 2024).
2.3 Service interaction
Although SIs in XR occur on the user’s screen rather than in a physical environment, they encompass dynamic exchanges between users and the digital service system, as well as between users and service providers, shaping value co-creation and overall experience (Lemon and Verhoef, 2016). In XR-enabled e-commerce, effective SI relies on responsive and context-aware communication that fosters engagement and supports decision-making. RC strengthens these interactions through features such as interactive product demonstrations, 3D exploration, real-time support and visualization of complex product attributes (Söderström et al., 2024). Ensuring trust in these interactions is equally important, particularly in safeguarding personal data, shopping behavior and payment details during immersive use. Users expect robust security mechanisms to maintain confidence in XR-enabled transactions (Lampropoulos, 2025). Furthermore, seamless interactions extend beyond usability to include efficient product-return handling and secure transaction processes (Hoffmann and Mai, 2022). This study examines how interaction modalities and security mechanisms shape user experiences in XR environments, offering insights into minimizing disruptions while addressing privacy concerns and trust factors critical to adoption.
2.4 Service quality
The literature on SQ within XR environments primarily focuses on traditional dimensions such as responsiveness, reliability and overall user experience (Vatolkina et al., 2020; David et al., 2021; Van Aaken et al., 2019). SQ refers to customers’ overall evaluation of a service’s excellence or superiority, based on the extent to which the service performance meets or exceeds their expectations (Parasuraman et al., 1988). In XR-enabled environments, SQ reflects users’ holistic appraisal of how effectively the system performs, responds and fulfills expectations. Although existing studies apply established e-service quality metrics to XR contexts, their ability to capture experiential depth unique to immersive technologies remains underexplored (Huma et al., 2024). This study addresses the gap by examining how customers perceive overall SQ in XR environments, emphasizing user-reported satisfaction and behavioral intentions. Although this study employs Blut’s (2016) scale to assess global evaluations of SQ, it also incorporates XR-relevant constructs such as usability, SI and RC to more comprehensively capture the immersive and perceptual elements characteristic of technologically enriched environments. For instance, timely virtual assistance from an avatar guiding users through a 3D store can enhance perceived quality even when assessed through traditional indicators.
2.5 Relationship quality
Brodie et al. (2013) proposed that emotional connection as comprising the stimuli and characteristics necessary for fostering deep bonds between users and platforms. Relationship quality (RQ) typically includes trust, commitment, participation and recommendation (Hu et al., 2019; Agyei et al., 2020). These are nurtured through personalized experiences, high SQ and relational interactions (Nambisan and Baron, 2009; Palmatier et al., 2006).
Accordingly, RQ can be delineated into four dimensions: trust, commitment, participation and recommendation. However, these frameworks may not fully capture the dynamic nature of XR-empowered e-commerce, where the intensity of interaction and depth of experiential value differ from traditional settings (Gleim et al., 2025). This research examines how XR environments amplify these dimensions through immersive experiences. By distinguishing these constructs using XR-specific literature, the study clarifies how immersive technologies shape RQ dynamics without conceptual inflation.
2.6 Customer engagement
Research on CE in XR environments emphasizes cognitive, affective and behavioral dimensions (Mollen and Wilson, 2010; E. Kim et al., 2023), but often treats them in isolation. This segmentation may oversimplify the complexity of engagement in XR, where these dimensions tend to cooccur and interact (Du et al., 2024; Salem and Alanadoly, 2024). This study moves beyond compartmentalized approach by examining the dynamic interplay between these dimensions within XR experiences. By offering an integrated perspective on CE, the study establishes a clearer foundation for hypotheses that support holistic XR engagement strategies.
3. Model development
A conceptual model (Figure 1) has been proposed to elucidate the intricate interplay among XR stimuli (RC and SI), XR characteristics (SQ), emotional connection (RQ) and consumer responses (CE). The model hypothesizes that XR stimuli, when enhanced by compelling characteristics, evoke emotional responses that subsequently influence consumers’ affective, cognitive and behavioral reactions. In further exploration, we examine the role of RC and SI as mediators in eliciting cognitive, affective and behavioral responses via SQ, which in turn shape both the emotional connection (RQ) and consumer response (CE). Consequently, within the proposed model, the evaluative or perceptual response of SQ and the behavioral response of RQ are positioned between SI, RC and CE.
 The conceptual model includes constructs labelled service interaction, reality congruence, e service quality, relationship quality, and customer engagement. Relationships are labelled with hypotheses H 1 through H 11. Service interaction is linked to reality congruence through H 1 and to e service quality through H 3. Reality congruence is linked to e service quality through H 2. E service quality is linked to relationship quality through H 4 and to customer engagement through H 5. Relationship quality is linked to customer engagement through H 6. Additional labelled paths H 7, H 8, H 9, H 10, and H 11 indicate mediating relationships involving e service quality and relationship quality. A legend identifies direct effect and mediating effect.
Conceptual Model
The conceptual model includes constructs labelled service interaction, reality congruence, e service quality, relationship quality, and customer engagement. Relationships are labelled with hypotheses H 1 through H 11. Service interaction is linked to reality congruence through H 1 and to e service quality through H 3. Reality congruence is linked to e service quality through H 2. E service quality is linked to relationship quality through H 4 and to customer engagement through H 5. Relationship quality is linked to customer engagement through H 6. Additional labelled paths H 7, H 8, H 9, H 10, and H 11 indicate mediating relationships involving e service quality and relationship quality. A legend identifies direct effect and mediating effect.Conceptual Model
3.1 Hypothesis development
In the context of XR-enabled e-commerce websites, immersion (Meißner et al., 2020) and vividness (Yim et al., 2017) have been shown to influence consumer experiences positively (McLean and Wilson, 2019; Pantano et al., 2017; Tussyadiah et al., 2018). Although these attributes have been widely studied, a gap remains concerning the functional mechanisms of RC and SI. These mechanisms are central to shaping meaningful XR-enabled e-commerce experiences, yet they have received comparatively limited attention in existing literature.
RC leverages XR technologies to provide realistic and personalized features such as virtual try-ons, detailed product visualization, real-time assistance and tailored shopping experiences through customization and AR-based recommendations (Cook et al., 2020). RC has been shown to enhance interactivity (Pantano et al., 2017), responsiveness (Javornik, 2016), system performance, SQ (David et al., 2021), information quality (Bleier et al., 2019), product presentation quality (Hilken et al., 2017) and privacy control. However, fully realizing these benefits requires effective SI to support seamless functionality and strengthen e-service quality (SQ).
SI improves XR experiences by ensuring cross-platform consistency, smooth navigation, real-time personalized assistance and enhanced interactivity (Lim et al., 2024; Augustine and Adnan, 2020). SI operationalizes RC’s potential by addressing usability challenges and enabling a coherent user journey (Kranzbühler et al., 2018). Thus, SI functions as a key mediator between RC and SQ, ensuring that the advantages associated with RC translate into improved e-service outcomes (Gata and Oryza Gilang, 2017; Kalia and Paul, 2021; Pradana et al., 2019).
Based on this foundation, the following hypotheses are proposed to examine the functional mechanisms of RC and SI in enhancing e-service quality:
RC positively affects the SI of the website.
RC positively affects the e-service quality of the website.
SI positively affects the e-service quality of the website.
3.2 Customer response: Interplay of e-service quality, relationship quality and customer engagement
3.2.1 Emotional connection.
In scholarly discourse, it is posited that individuals deeply engaged in an activity may not immediately perceive positive emotions during the flow experience; however, such positive feelings are often experienced afterward (Mainemelis, 2001). While much of the literature focuses on immersion and vividness, the mechanisms of RC and SI remain less explored despite their crucial role in fostering trust, commitment (Mollen and Wilson, 2010) and relational attachment – factors pivotal for CE (Garbarino and Johnson, 1999; Hajli, 2014). Enhanced e-service quality strengthens relationships between customers and providers by facilitating interactive exchanges that build trust and commitment (Rupik, 2015). These relationships are reflected in active behaviors such as participation and recommendation, representing higher levels of CE (Nambisan and Baron, 2009; Palmatier et al., 2006; Xu et al., 2015). Recognizing CE as encompassing cognitive, emotional and behavioral dimensions further aligns with the importance of RQ in XR-enabled contexts (Hu and Chaudhry, 2020). Thus, the hypotheses focus on the positive impacts of e-service quality on RQ and CE, along with the influence of RQ on CE in shaping long-term XR-enabled e-commerce outcomes.
We hence posit:
E-service quality will positively affect the RQ with the e-commerce website.
E-service quality will positively affect CE with the website.
Active relationships with the website or other computer-mediated entities play a crucial role in fostering cognitive and affective commitment, ultimately driving CE (Johnson and Grayson, 2005). Relationship exchanges are inherently multidimensional – encompassing cognitive, emotional and behavioral components – which aligns with the widely accepted three-dimensional framework of CE (Islam et al., 2019; Gong, 2018; Hollebeek et al., 2020; Pansari and Kumar, 2017). While significant research has addressed CE in traditional online contexts, the rapid adoption of emerging technologies such as AR and VR introduces new dynamics to relational quality. These technologies enhance interactive experiences and may reshape the cognitive, affective and behavioral aspects of engagement (Zeng et al., 2024). However, the interplay between RQ and engagement in digitally enriched environments remains underexplored. This study aims to bridge this gap by examining how AR- and VR-driven relational quality influences engagement dimensions. By integrating these advanced technologies into the RQ framework, we extend the theoretical understanding of engagement within e-commerce platforms. Hence, we posit:
RQ will positively affect CE with the e-commerce website.
3.2.2 Mediating effects.
As noted earlier, RC and SI are assumed to elicit cognitive, affective and behavioral responses via SQ (Ali et al., 2022), which in turn affect the RQ and CE (Tunjung Dewi, 2022). Thus, in the suggested model, the evaluative or perceptual response of SQ and the behavioral response of RQ are placed between SI, RC and CE. This perspective highlights the need to examine how the interplay between RC, SI and the evaluative and behavioral mechanisms impacts CE. The proposed mediations aim to provide deeper insights into how RC contribute to enriched relational dynamics within e-commerce platforms. Hence, RC and SI through the evaluative and behavioral mechanism in the proposed model result in the following mediations:
The effect of SQ on CE is mediated by RQ.
The effect of RC on SQ is mediated by SI.
The effect of RC on CE is mediated by SQ and RQ.
The effect of RC on CE is mediated by SI and SQ.
The effect of RC on CE is mediated by SI, SQ and RQ.
4. Method
4.1 Data collection
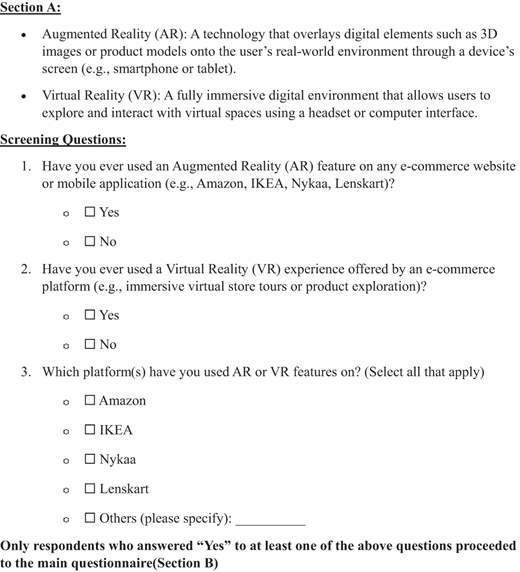
The study used an online survey targeting undergraduate students, a commonly examined demographic in digital consumer behavior and immersive technology adoption research (Kim et al., 2023; Rachmawati et al., 2024). A pilot survey with online shoppers was conducted to refine the items and instructions. The final survey was administered through Google Forms using purposive sampling, with inclusion criteria requiring prior experience with XR (AR/VR) features. Screening questions confirmed respondents’ interactions with XR tools on multi-retail platforms such as Tira, Amazon India, Nykaa, Lenskart, Flipkart, Pepperfry and Myntra. These platforms offer AR/VR functionalities like virtual try-ons (fashion, cosmetics), 3D product visualization (furniture) and interactive demonstrations (electronics).
To ensure validity, participants identified the specific XR features they had used. Of the respondents, 60 reported using Lenskart’s 3D Try-On, 80 engaged with Amazon AR View for electronics and home décor and 20 used Tira’s Virtual Try-On. In addition, 58 used virtual mirrors for makeup, 65 viewed furniture through Flipkart Camera, 24 explored Pepperfry’s 3D visualization features and 33 interacted with Myntra’s digital avatars.
A total of 400 responses were collected. Sixty outliers were removed using box plots and Z-scores to maintain data integrity, as extreme values can distort statistical estimates and compromise assumptions of normality and homoscedasticity (Wada, 2020; Wilcox, 2017). The final sample comprised 340 respondents, meeting the minimum requirement for statistical analysis. With 38 measurement items, the sample exceeded the recommended ratio of at least five respondents per item (Bujang et al., 2018). Demographic characteristics of the sample are presented in Table 1.
4.2 Measures
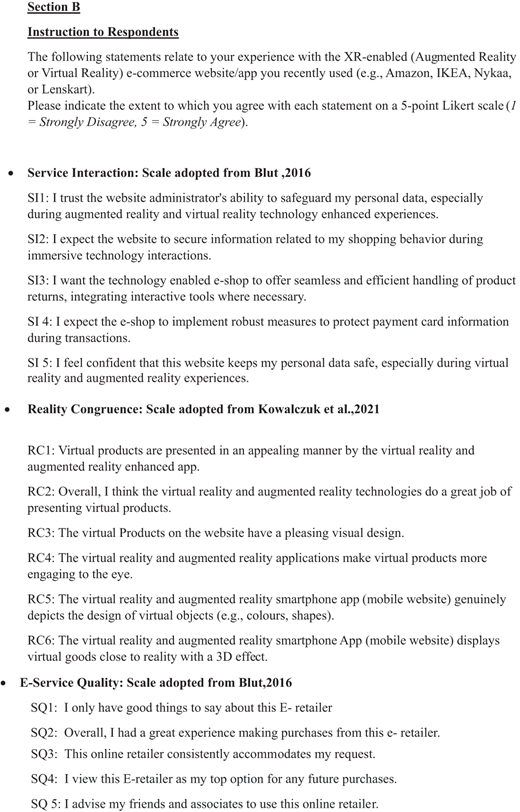
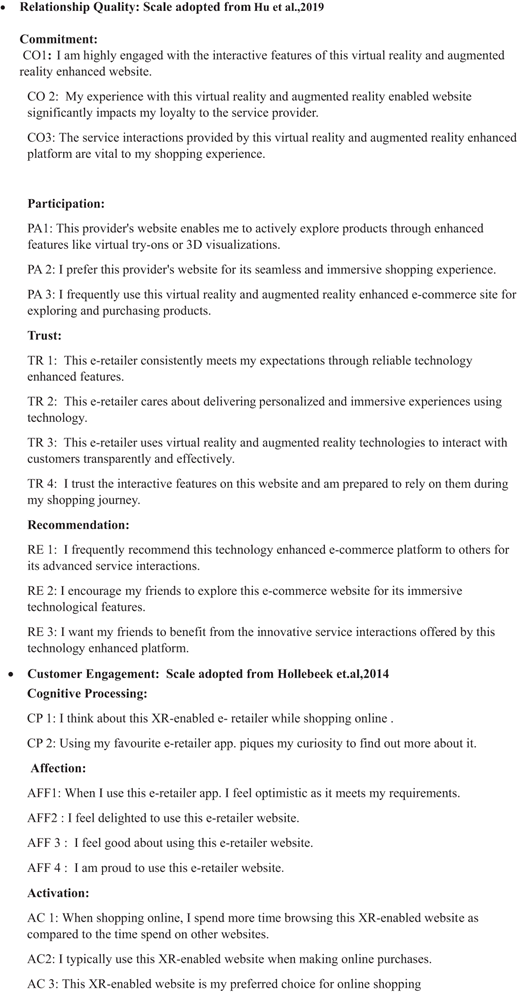
We developed the measurement instrument through an extensive literature review, using established and validated scales within the e-commerce domain ( Appendix). All items were adapted from prior studies and measured on a five-point Likert scale (1 = Strongly Disagree to 5 = Strongly Agree). The study employed first-order constructs, including SI (5 items) and SQ (5 items) from Blut (2016) and RC (6 items) from Kowalczuk et al. (2021). RQ was modeled as a second-order construct comprising commitment, participation, recommendation and trust, represented by 13 items adapted from Hu et al. (2019). CE was treated as a multidimensional construct encompassing cognitive, affective and behavioral dimensions, measured using nine items from Hollebeek’s scale (Islam et al., 2019).
To ensure content validity, the questionnaire was reviewed and refined based on feedback from seven academicians and five researchers. Face validity was assessed by engaging ten frequent users of the XR-enabled webshop. These participants interacted with features such as virtual try-ons and 3D product visualization and completed tasks simulating real shopping scenarios (Lavoye et al., 2023). They were selected based on predefined criteria, including more than five XR-feature sessions in the previous month. Their feedback helped improve clarity and ensure accurate representation of XR-based SIs. After revisions, the final 38-item instrument was distributed through Google Forms, consistent with earlier XR adoption research (Xi and Hamari, 2021).
5. Methodology
This study adopts a mixed-method approach by integrating PLS-SEM with fsQCA to provide a clearer and more comprehensive understanding of the research phenomena. PLS-SEM evaluates the linear relationships among key constructs such as e-service quality (SQ), RQ and CE, while fsQCA complements this by capturing nonlinear and configurational patterns that linear models cannot address. Through its focus on multiple causal pathways, fsQCA identifies how SI, RC, SQ and RQ jointly shape CE. The combined use of symmetric (PLS-SEM) and asymmetric (fsQCA) techniques enhances the analytical rigor of the study and strengthens the general applicability of the proposed model across varied service contexts. Overall, this integrated design improves the study’s explanatory depth and contributes meaningful insights to research on CE and e-service quality.
5.1 Analysis and results
We used the component-based partial least squares (PLS) structural equation modeling (SEM) approach to analyze the survey data. The PLS-SEM method examines complex relationships among latent variables (Ringle et al., 2012). This approach is well suited because it imposes minimal restrictions on measurement scales, sample size and residual distribution (Hair et al., 2018). In addition, we employed an asymmetric analytical technique (fsQCA) to capture the nonlinearity and complexity of the relationships among the factors. The following subsections present the results obtained from both methods.
Measurement validation involved testing internal consistency, convergent validity and discriminant validity using composite reliability and AVE (Table 2). Cronbach’s alpha values above 0.70 and AVE values exceeding 0.50 indicated strong internal consistency and construct validity (Gefen et al., 2000), with all factor loadings above 0.70 supporting convergent validity (Bagozzi and Yi, 1988). Discriminant validity was confirmed using the Fornell–Larcker criterion (Table 3) and multicollinearity tests indicated non-problematic interrelationships among constructs. First-order constructs such as RC, SI and e-service quality contributed uniquely to higher-order constructs, including RQ and CE (Figure 2). The measurement model results further confirmed the nomological validity of second-order constructs (Diamantopoulos and Winklhofer, 2001), supported by significant indicator weights, acceptable VIF values (<3) (Diamantopoulos and Siguaw, 2006) and the absence of conceptual overlap among dimensions.
Psychometric properties
| Latent constructs | Cronbach’s alpha | CR | AVE |
|---|---|---|---|
| AC | 0.782 | 0.873 | 0.697 |
| AFF | 0.864 | 0.907 | 0.710 |
| CO | 0.820 | 0.893 | 0.735 |
| CP | 0.783 | 0.873 | 0.697 |
| PA | 0.752 | 0.858 | 0.669 |
| RC | 0.880 | 0.909 | 0.626 |
| RE | 0.844 | 0.906 | 0.762 |
| SI | 0.744 | 0.835 | 0.559 |
| SQ | 0.851 | 0.894 | 0.628 |
| TR | 0.877 | 0.915 | 0.730 |
AVE = average variance extract; CR = composite reliability; AC = activation; AFF = affection; CO = commitment; CP = cognitive processing; PA = participation; RC = reality congruence; RE = recommendation; SI = service interaction; SQ = e-service quality; TR = trust
Fornell and Larcker criteria
| Latent constructs | AC | AFF | CO | CP | PA | RC | RE | SI | SQ | TR |
|---|---|---|---|---|---|---|---|---|---|---|
| AC | 0.835 | |||||||||
| AFF | 0.627 | 0.843 | ||||||||
| CO | 0.408 | 0.634 | 0.857 | |||||||
| CP | 0.547 | 0.748 | 0.623 | 0.835 | ||||||
| PA | 0.478 | 0.702 | 0.654 | 0.646 | 0.818 | |||||
| RC | 0.375 | 0.539 | 0.476 | 0.466 | 0.609 | 0.791 | ||||
| RE | 0.526 | 0.719 | 0.570 | 0.659 | 0.661 | 0.517 | 0.873 | |||
| SI | 0.335 | 0.386 | 0.321 | 0.313 | 0.409 | 0.598 | 0.384 | 0.747 | ||
| SQ | 0.473 | 0.673 | 0.639 | 0.603 | 0.654 | 0.619 | 0.703 | 0.515 | 0.793 | |
| TR | 0.549 | 0.736 | 0.610 | 0.613 | 0.659 | 0.507 | 0.687 | 0.41 | 0.715 | 0.855 |
AC = activation; AFF = affection; CO = commitment; CP = cognitive processing; PA = participation; RC = reality congruence; RE = recommendation; SI = service interaction; SQ = e-service quality; TR = trust
 A model includes a construct labelled relationship quality connected to four constructs labelled commitment, participation, recommendation, and trust. The link from relationship quality to commitment shows the value 0.221 followed by three asterisks. The link from relationship quality to participation shows the value 0.209 followed by three asterisks. The link from relationship quality to recommendation shows the value 0.372 followed by three asterisks. The link from relationship quality to trust shows the value 0.361 followed by three asterisks.
Weight coefficients of first-order formative subconstruct dimensions
A model includes a construct labelled relationship quality connected to four constructs labelled commitment, participation, recommendation, and trust. The link from relationship quality to commitment shows the value 0.221 followed by three asterisks. The link from relationship quality to participation shows the value 0.209 followed by three asterisks. The link from relationship quality to recommendation shows the value 0.372 followed by three asterisks. The link from relationship quality to trust shows the value 0.361 followed by three asterisks.Weight coefficients of first-order formative subconstruct dimensions
5.1.1 Structural model assessment.
After determining the validity of the measurement model, PLS-SEM software was used to conduct a SEM analysis to test the proposed hypotheses (Figure 3). The results indicate that all direct hypotheses, except one, were supported. RC had a significant effect on SI (H1; β = 0.597; p ≤ 0.001) and e-service quality (H2; β = 0.498; p ≤ 0.001). The findings also show that SI enhances SQ (H3; β = 0.202; p ≤ 0.01). The results further confirm the relationship between SQ and RQ (H4; β = 0.797; p ≤ 0.001), indicating a strong positive link. However, the direct effect of SQ on CE was insignificant (H5; β = 0.042; p = 0.557). RC (β = 0.56; p = 0.575) and SI (β = 0.35; p = 0.726) also did not have significant direct effects on CE, suggesting that their influence may operate through other constructs. RC was found to directly enhance RQ (β = 3.451; p = 0.001), while the effect of SI on RQ was not significant (β = 0.759; p = 0.448). Overall, these results highlight the central role of RQ, which exerted a strong and significant influence on CE (H6; β = 0.796; p ≤ 0.001).
 A tested path model includes constructs labelled service interaction, reality congruence, e service quality, relationship quality, and customer engagement. Paths are labelled with hypotheses H 1 through H 11 and include numerical coefficients with p values. H 1 shows a value of 0.597 with p less than 0.001. H 2 shows a value of 0.498 with p less than 0.001. H 3 shows a value of 0.202 with p equals 0.001. H 4 shows a value of 0.797 with p less than 0.001. H 5 shows a value of 0.042 with p equals 0.557. H 6 shows a value of 0.796 with p less than 0.001. H 7 shows a value of 0.634 with p less than 0.001. H 8 shows a value of 0.121 with p equals 0.001. H 9 shows a value of 0.316 with p less than 0.001. H 10 shows a value of 0.005 with p equals 0.562. H 11 shows a value of 0.077 with p equals 0.004. A legend labels direct effect and mediating effect.
Results of the proposed conceptual model
A tested path model includes constructs labelled service interaction, reality congruence, e service quality, relationship quality, and customer engagement. Paths are labelled with hypotheses H 1 through H 11 and include numerical coefficients with p values. H 1 shows a value of 0.597 with p less than 0.001. H 2 shows a value of 0.498 with p less than 0.001. H 3 shows a value of 0.202 with p equals 0.001. H 4 shows a value of 0.797 with p less than 0.001. H 5 shows a value of 0.042 with p equals 0.557. H 6 shows a value of 0.796 with p less than 0.001. H 7 shows a value of 0.634 with p less than 0.001. H 8 shows a value of 0.121 with p equals 0.001. H 9 shows a value of 0.316 with p less than 0.001. H 10 shows a value of 0.005 with p equals 0.562. H 11 shows a value of 0.077 with p equals 0.004. A legend labels direct effect and mediating effect.Results of the proposed conceptual model
5.1.2 Mediation tests.
To investigate the indirect pathways linking RC to CE, mediation analyses were conducted using the PLS bootstrapping method with 5,000 resamples. The results in Table 4 indicate how RC influences cognitive, affective and activation responses through key mediators. The analysis shows that SQ and RQ act as critical mediators in the model. The sequential pathway from SQ to RQ and then to CE was significant (β = 0.634, t = 9.775, p = 0, 95% CI [0.513, 0.761]), supporting H7. The path from RC to SI and then to SQ also showed a significant positive effect (β = 0.121, t = 3.289, p = 0.001, CI [0.051, 0.193]), supporting H8. The extended sequential pathway from RC to SQ, then to RQ and finally to CE demonstrated a strong significant effect (β = 0.316, t = 6.346, p = 0, 95% CI [0.228, 0.416]), confirming H9. In contrast, the indirect path RC → SI → SQ → CE was nonsignificant (β = 0.005, t = 0.580, p = 0.562, 95% CI [−0.010, 0.024]). This outcome suggests an attenuation effect on the SQ → CE link, which was also nonsignificant (β = 0.042, p = 0.557, 95% CI [−0.092, 0.181]). Overall, while RC enhances SI and perceived SQ, these improvements do not directly translate into engagement unless relational or affective mechanisms – such as trust, authenticity or emotional resonance – are activated (Hollebeek et al., 2014; Vivek et al., 2022).
Summary of the results
| H | Hypothesized path | β | t statistics | p-values | 95% CI | Results |
|---|---|---|---|---|---|---|
| H1 | RC → SI | 0.597 | 12.118 | <0.001 | [0.492,0.685] | Supported |
| H2 | RC → SQ | 0.498 | 8.877 | <0.001 | [0.385,0.608] | Supported |
| H3 | SI → SQ | 0.202 | 3.294 | 0.001 | [0.078,0.316] | Supported |
| H4 | SQ → RQ | 0.797 | 26.257 | <0.001 | [0.719,0.844] | Supported |
| H5 | SQ → CE | 0.042 | 0.588 | 0.557 | [−0.092,0.181] | Not supported |
| H6 | RQ → CE | 0.796 | 12.491 | <0.001 | [0.673,0.917] | Supported |
| H7 | SQ → RQ → CE | 0.634 | 9.775 | <0.001 | [0.513,0.761] | Supported |
| H8 | RC → SI → SQ | 0.121 | 3.289 | 0.001 | [0.051,0.193] | Supported |
| H9 | RC → SQ → RQ → CE | 0.316 | 6.346 | <0.001 | [0.228,0.416] | Supported |
| H10 | RC → SI → SQ → CE | 0.005 | 0.580 | 0.562 | [−0.010,0.024] | Not supported |
| H11 | RC → SI → SQ →RQ → CE | 0.077 | 2.905 | 0.004 | [0.030,0.132] | Supported |
To validate this interpretation, the extended pathway RC → SI → SQ → RQ → CE was examined and found to be significant (β = 0.077, t = 2.905, p = 0.004, 95% CI [0.030, 0.132]), supporting H11. This confirms that RQ functions as a key conduit through which experiential and service-related dimensions of XR-based e-services translate into sustained engagement.
To assess the relative importance of each construct in influencing CE, an importance–performance map analysis (IPMA) was conducted (Table 5). RQ (0.796) emerged as the most influential determinant, followed by SQ (0.676), RC (0.418) and SI (0.137). These results indicate that while RC and SQ provide essential perceptual foundations, RQ ultimately converts these gains into active engagement behaviors.
5.2 Asymmetric analysis
To complementarily evaluate the joint impact of predictors, fsQCA uses an asymmetrical approach that provides diverse configurations capable of achieving a significant level of CE (Fainshmidt et al., 2020; Nakamura et al., 2016). In addition, by conducting a necessity analysis, we can determine whether a crucial predictor independently correlates with CE. Identifying necessary and sufficient conditions for a given outcome requires assessing the criteria of consistency and coverage. The adequacy of a configuration is established when coverage and consistency values reach at least 0.2 and 0.8, respectively (Douglas et al., 2020). A necessary antecedent is identified when both coverage and consistency exceed 0.90 (Dul, 2016).
The current research applied fsQCA 4.1 to conduct a configuration analysis, leveraging its ability to reveal complex causal relationships. To initiate the analysis, we examined the intermediate solution to provide a theoretical explanation and assess model fit. The solution coverage of 0.9837 indicates that the configurations collectively explain a substantial portion of the data set. However, the solution consistency of 0.6854 suggests that although coverage is high, the predictive strength of the configurations is moderate, warranting further scrutiny. Table 6 presents the coverage and consistency of the respective factors in the model, showing SQ and RQ as particularly important for CE due to their high raw and unique coverage and strong consistency. These findings support the structural integrity of the model. Furthermore, Tables 7 and 8 present the results of the sufficient configurations and necessary conditions contributing to CE.
Intermediate solution analysis
| Antecedents | Raw coverage | Unique coverage | Consistency |
|---|---|---|---|
| SI | 0.854932 | 0.0147474 | 0.687412 |
| RC | 0.851639 | 0.00355619 | 0.858777 |
| SQ | 0.892166 | 0.00617099 | 0.894131 |
| RQ | 0.897292 | 0.00794894 | 0.909032 |
SI = service interaction; RC = reality congruence; SQ = e-service quality; RQ = relationship quality
Analysis of necessary conditions for CE
| Condition tested | Consistency | Coverage |
|---|---|---|
| SI (∼SI) | 0.854932 (0.404613) | 0.687412 (0.757193) |
| RC (∼RC) | 0.851639 (0.607208) | 0.858777 (0.772162) |
| SQ (∼SQ) | 0.892166 (0.574522) | 0.894131 (0.736325) |
| RQ (∼RQ) | 0.897292 (0.582210) | 0.909032 (0.736065) |
“∼”denotes “negation”
Sufficient configurations for customer engagement
| Configurations | 1 | 2 | 3 | 4 | 5 | 6 | 7 | 8 | 9 | 10 | 11 |
|---|---|---|---|---|---|---|---|---|---|---|---|
| SI | | | | | | | | | | | |
| RC | | | | | | | | | | | |
| SQ | | | | | | | | | | | |
| RQ | | | | | | | | | | | |
| Consistency | 0.970 | 0.947 | 0.960 | 0.952 | 0.968 | 0.875 | 0.905 | 0.928 | 0.939 | 0.957 | 0.948 |
| Coverage | 0.701 | 0.726 | 0.732 | 0.743 | 0.761 | 0.777 | 0.781 | 0.781 | 0.789 | 0.799 | 0.844 |
| Combined | 0.833 | 0.843 | 0.851 | 0.853 | 0.868 | 0.850 | 0.866 | 0.870 | 0.879 | 0.889 | 0.909 |
= Presence of construct; = Absence of construct
The 11 configurations outlined in Table 8 emphasize their role in stimulating CE. Notably, Configuration 1, which includes all four conditions (SI, RC, SQ and RQ), demonstrates the highest consistency and coverage, suggesting that their combined presence is strongly associated with the outcome. Configuration 11, consisting only of SQ and RQ, exhibits the highest explanatory power among the tested configurations, whereas Configuration 7 (SI and SQ) also shows a relatively high combined score of 0.866.
To further examine necessary conditions, we performed a necessary condition analysis (NCA) to determine which predictors – SI, RC, SQ and RQ – serve as key drivers of CE. Generally, consistency and coverage values exceeding 0.9 are required for a predictor to be classified as “necessary” (Dul, 2016). However, when consistency scores range between 0.80 and 0.90 and coverage exceeds 0.75, predictors are categorized as “almost always necessary” (Perdomo-Verdecia et al., 2024; Sukhov et al., 2023b). The results in Table 7 show that although RC, RQ and SQ do not strictly meet the 0.9 threshold, their relatively high consistency and coverage justify their classification as “almost always necessary.”
6. Discussion and implications
The objective of this study was to examine whether RC in an e-commerce setting constitutes a novel factor influencing e-service quality – and, ultimately, CE. The proposed conceptual model aligns with the EHM (Kowalczuk et al., 2021; Oppen et al., 2005; Yin and Xu, 2021), offering a coherent framework to explore relationships among key constructs. The findings confirm that RC and SI are central to enhancing e-service quality (SQ). Furthermore, the study reveals a linear relationship from e-service quality, through RQ, to CE, while also examining how SI influences both RC and SQ.
Our results show that RC significantly improves SI and SQ, corroborating prior research demonstrating that reality-congruent features in digital environments elevate perceived service quality and enrich user experience (e.g. Archibald et al., 2020; David et al., 2021; Flavián et al., 2019; Hollebeek et al., 2020; Park and Yoo, 2020). Notably, e-service quality by itself does not directly drive CE. Instead, its effect is mediated by RQ factors – such as trust, commitment, recommendation and participation (Agyei et al., 2020; Blut et al., 2015; Bucko et al., 2018; Hollebeek et al., 2014; Vatolkina et al., 2020). From a theoretical perspective, this suggests that SQ functions as an organismic state within the stimulus–organism–response (S–O–R) framework (Mehrabian and Russell, 1974; Eroglu et al., 2001), and that its influence on engagement emerges through relational affect and trust formation rather than direct cognitive appraisal.
PLS-SEM bootstrapping and IPMA identify RQ as the key predictor of CE. Although SQ is a widely recognized determinant of CE, our findings imply its influence is indirect – mediated through RQ. This may reflect evolving expectations of digitally empowered consumers, who increasingly value experiential factors such as interactive engagement and trust-building mechanisms over traditional SQ (Xu et al., 2022). Prior research (e.g. Hollebeek et al., 2014; Roy et al., 2023) similarly suggests that high SQ enhances user perceptions but does not guarantee engagement unless supported by relational and affective bonds. This underscores the growing importance of RQ as a mediator in digital and XR-enabled service contexts.
In AR/VR-enhanced e-commerce, users’ perceptions of SQ are shaped not only by traditional service dimensions but also by the immersive and interactive characteristics of the platform (Martínez-Navarro et al., 2019). When these expectations are unmet, customers may find it difficult to form the emotional or relational commitment necessary for sustained engagement, even if objective SQ is high (Diana et al., 2023). These findings imply that firms should consider to pair SQ with engagement strategies centered on trust, commitment and active participation. RC plays a pivotal role by enhancing e-service quality through seamless interactive experiences that strengthen RQ. AR-powered virtual try-ons in fashion e-commerce can enhance RC by aligning digital representations with users’ real-world expectations, thereby reducing uncertainty and potentially increasing purchase confidence. Similarly, VR-based automotive showrooms may provide immersive interactions that support trust and relational commitment.
Engagement in XR-enabled environments may be influenced by the intuitiveness of user interactions, for instance, through mechanisms such as hand-tracking in VR or gesture-based navigation in AR, which facilitate smoother interaction experiences. In addition, incorporating gamification elements, including loyalty-based or socially interactive XR features, can reinforce trust and relational commitment, potentially supporting sustained CE.
Moreover, our fsQCA analysis highlights RC, SQ and RQ as “almost always necessary” conditions, according to necessary-condition analysis. In the context of Industry 5.0 – where service robots become integral to customer interactions – SQ emerges both as an almost necessary condition and as a cornerstone of configurational analysis, validating our fsQCA results (Roy et al., 2023). Likewise, RQ has appeared as an essential condition in global manufacturing-sector studies, underscoring its importance in driving behavioral outcomes (Roy et al., 2023).
Our findings suggest organizations can achieve CE via multiple pathways, tailored to their strengths. For instance, firms leveraging strong RC (e.g. AR/VR-enabled platforms) may offset weaker SI; others with robust SQ and RQ can reach similar outcomes. These alternative configurations offer valuable guidance for designing practical strategies to enhance CE across diverse industry contexts.
A notable finding concerns the moderate solution consistency (0.6854), which suggests that although the fsQCA configurations exhibit strong coverage, their predictive reliability remains constrained. This result underscores the presence of meaningful heterogeneity in CE behaviors across respondent segments – heterogeneity that fsQCA is able to capture configurationally but cannot fully account for at the individual level. Future research that systematically examines segment-specific patterns may enhance the predictive validity of configurational models in XR-enabled contexts. Moreover, the strong performance of Configuration 11 (SQ and RQ), which demonstrates high explanatory power in the absence of SI and RC, indicates that SQ and RQ alone can substantially drive CE. This challenges the commonly held assumption that experiential or immersive factors must necessarily dominate in XR environments, suggesting instead that foundational service and relational mechanisms may remain influential even when advanced technological features are present.
Our findings align with recent studies (e.g. Gil-Cordero et al., 2024; Zheng et al., 2023) in domains such as crypto-wallet adoption and tourism, where RQ, SQ, SI and RC are pivotal in configurational analyses using fsQCA. This reinforces the robustness of these constructs across digital environments and supports the multi-method approach adopted in our study.
According to the IPMA, RQ is the most important predictor of CE, whereas fsQCA identifies RC as the leading configurator and SQ as secondary. This divergence underscores the complementary value of linear and configurational perspectives and reinforces the idea that CE emerges from multiple pathways rather than a single dominant mechanism. By elucidating these interconnected dynamics, our study offers meaningful insights into mechanisms driving CE – contributing significantly to the broader discourse on e-service quality, CE and XR-enabled commerce.
6.1 Theoretical implications
Our study contributes to the existing literature by examining CE in the context of extended reality technology assimilation in e-commerce purchasing (Flavián et al., 2019; Hilken et al., 2017; Nambisan and Baron, 2009). Second, our theoretical model advances understanding of the role of RC as a driver of SQ and the effect of SQ on RQ and CE (Orús et al., 2021; Smink et al., 2020). Third, while previous research has often relied on TAM (Davis, 1989), UTAUT (Venkatesh et al., 2003) and social cognitive theory (Bandura, 1986), our EHM perspective extends scholarly understanding of the proposed conceptual model (Kowalczuk et al., 2021). This model outlines the stages of customer interaction (RC, SI and SQ) with an online platform or service, starting from key drivers and characteristics (Orús et al., 2021) and progressing toward more profound relational outcomes (RQ) and enriched experiences (XR), ultimately leading to behavioral outcomes (CE). Finally, although RQ is widely examined as a response to SQ (Kalia et al., 2021; Mohamed Ali, 2020; Palmatier et al., 2006), few studies have investigated it as a mediator between SQ and CE.
Methodologically, our study demonstrates the value of using both symmetric (PLS-SEM) and asymmetric (fsQCA) methods as complementary analytical tools in CE research. This integrative approach offers a more comprehensive understanding of the factors shaping CE, providing robust and actionable insights for researchers and practitioners (Sukhov et al., 2023; Zheng et al., 2023).
6.2 Managerial implications
This study underscores the significance of incorporating XR to enhance CE by fostering interactive and immersive experiences. This finding supports the idea of an experiential hierarchy (learning, interaction and immersion) in XR contexts (Chandramouli et al., 2025).
Findings suggest that perceived SQ increases when users experience seamless, reality-congruent interactions (Laato et al., 2021). For example, gamers often pay premium subscription fees for enhanced XR experiences, indicating that e-commerce businesses can strategically position high-value products for digitally engaged customer segments. However, XR technologies must be optimized to ensure a smooth, intuitive browsing experience free from glitches and lag (Morotti et al., 2022; Yang et al., 2022).
To ensure reliable and engaging XR services, businesses should implement advanced tracking solutions (such as computer vision, motion capture sensors and inertial measurement units) that strengthen RC (Marimon and Ebrahimi, 2016). A feedback-based trust evaluation system can further support transparent service provision and reinforce customer trust and commitment (Kiron et al., 2012; Sun et al., 2021; Xu et al., 2022). In addition, virtual try-ons and interactive product explorations enhance RQ and foster higher engagement with digital platforms (Siagian and Gui, 2024; Hossain and Rahman, 2021). E-commerce enterprises should also highlight customer feedback, ratings and payment security measures to improve credibility.
XR technologies support emerging personalization and marketing approaches, and research shows that multimodal cues, including haptics, can increase immersion and presence – key antecedents of engagement (Doolani et al., 2020; Han and Windsor, 2011). For instance, foveated rendering, which incorporates eye tracking and gaze-based interactions, enables real-time consumer behavior insights that help businesses develop personalized product recommendations.
From a strategic perspective, firms should design trustworthy and adaptable graphical user interfaces (GUIs) that address diverse customer needs. Based on interface design research in XR, future-oriented GUIs should prioritize intuitive navigation, interaction frameworks that support user commitment and modular features that allow upgrades and adaptation as platforms evolve (Topliss et al., 2025).
6.3 Limitations and future research
While the theoretical and managerial implications outlined above offer meaningful insights into CE in XR-enabled retail environments, their interpretive scope must be considered alongside the study’s methodological and contextual constraints. These limitations help delineate the boundaries within which the findings remain valid and clarify where future research is needed to extend or refine the proposed conceptual contributions.
Although this study offers valuable insights into CE antecedents in XR-based retail environments, several limitations must be acknowledged. First, the data were collected through an online questionnaire survey, which, while widely used, may be subject to respondent bias and measurement inconsistencies. To enhance respondents’ understanding of AR and VR and reduce misinterpretation, a short explanatory video was embedded in the questionnaire. These videos illustrated how AR and VR technologies operate within retail websites, helping participants visualize the context before responding. Screening questions were then introduced to ensure that only individuals with prior AR or VR experience on e-commerce platforms proceeded to the main survey. Although this approach improved ecological validity and comprehension, participants’ experiences with different retailers (e.g. Amazon, IKEA) may still have varied, potentially introducing brand-related perceptual bias. At the same time, this heterogeneity mirrors the inherent diversity of contemporary XR-enabled retail environments. As consumers routinely engage with AR and VR across multiple platforms and product categories, incorporating such real-world variation enhances ecological validity and enables the findings to reflect broader cross-platform XR usage rather than the dynamics of a single controlled interface.
Second, although established scales were employed to measure CE, the items referenced engagement with participants preferred online retailers rather than the specific XR-enabled platform evaluated. This framing may have influenced internal validity, as responses could reflect preexisting brand associations rather than engagement with XR-specific features. However, given the study’s aim of examining how XR experiences influence general engagement tendencies in online retail, employing a validated, platform-neutral engagement scale enabled the model to capture broader behavioral patterns that extend beyond any single retailer. Future research should develop and validate context-sensitive engagement instruments tailored to XR-enabled environments.
Third, despite the inclusion of explanatory materials, participants’ understanding of “Augmented Reality” and “Virtual Reality” may still have differed from academic definitions, potentially affecting their interpretation of XR-related items. Future studies should provide standardized operational definitions and conduct pretesting to ensure consistent comprehension.
Fourth, minor inconsistencies in questionnaire wording and grammatical slips were noted and corrected during revision; however, these issues may still have influenced how respondents interpreted item intent. Future studies should include pretesting and linguistic validation procedures to improve instrument clarity and reliability.
In addition, the cross-sectional design limits the study’s ability to capture changes in customer expectations and engagement behaviors over time, particularly within rapidly evolving XR contexts. Such temporal constraints affect the internal validity of causal inferences and restrict the generalizability of the findings to specific points in time. Longitudinal and experimental designs would provide deeper insights into how engagement develops with sustained or repeated exposure to immersive technologies. To mitigate some of these design limitations, the study employed both PLS-SEM and fsQCA, which together offer a more nuanced interpretive lens. While PLS-SEM identifies overarching linear effects across respondents, fsQCA reveals alternative configurational pathways that may arise within heterogeneous XR contexts. This complementary analytical strategy strengthens the conceptual robustness of the findings and enables a more comprehensive representation of both dominant patterns and meaningful variations across diverse XR experiences.
Finally, although AR and VR were considered collectively under XR, the two technologies may differ in their cognitive, affective and behavioral effects. Future research should distinguish between AR and VR experiences to achieve a more granular understanding of their respective impacts on perceived SQ and engagement.
7. Conclusion
In conclusion, this study highlights the pivotal role of XR technologies in enhancing perceptions of SQ, thereby creating enriched experiences that lead to favorable behavioral outcomes in e-commerce environments. RC, a key component of these technologies, emerges as a critical stimulus for fostering the level of SQ needed to elicit desired behavioral responses. Our empirical findings show that both SQ and RQ significantly enhance CE with e-commerce websites. The analysis identifies multiple pathways through which the model’s constructs interact to drive engagement. Thus, fostering effective CE requires a holistic approach that integrates RC, seamless SIs, high SQ and strong RQ. E-commerce platforms should prioritize improving SQ and relationship-building efforts while leveraging XR technologies to strengthen RC, ultimately achieving better CE outcomes.
Future research could examine the long-term effects of sustained RC on customer loyalty and retention, as well as its influence on customer satisfaction across different industries. Further investigation into emerging XR technologies, such as mixed reality and haptic feedback, may offer deeper insights into how these innovations shape the broader service ecosystem. Expanding the scope to include cross-cultural perspectives on XR and its relationship to SQ could also advance the field by providing a more comprehensive understanding of XR’s role in global e-commerce experiences.
References
Appendix