This study aims to investigate how the classical academic resources of universities contribute to their innovation and entrepreneurship performance. Academic inputs such as the total number of academic publishing, citation scores, scientific documents, number of PhD studies and faculty-to-student ratios are used for this analysis. The criteria used for innovation and entrepreneurship rating are competence in scientific and technological research, intellectual property pool, cooperation and interaction and economic contribution and commercialization.
Two ranking systems for Turkish universities are used in this study. Academic performance (URAP) is used as input, and entrepreneurial performance (TUBITAK) is the output. A sample of 48 Turkish universities (32 public universities and 16 private universities) is evaluated via data envelopment analysis (DEA).
The results of the DEA show that 23% of the selected universities are fully efficient, while 62% are partially efficient – of which 81.7% are public universities and 44% are private universities. Furthermore, the study’s slack analysis of outputs indicates that although the academic performance of the selected universities is relatively high, these universities have difficulty converting the outcomes of their academic studies into real-life socioeconomic applications.
The goal of higher education institutions has traditionally been purely academic, focusing on teaching and scientific research. However, contemporary universities are expected to consistently focus on innovation and entrepreneurship in addition to their traditional roles of teaching and research. This study examines the relationship between classical academic resources and the contemporary entrepreneurial aspect of the universities in a sample of 48 Turkish universities. Two well-established university ranking systems are used to evaluate performance and efficiency, constituting a novel contribution to the academic entrepreneurship field.
1. Introduction
Universities are essential and prestigious components of modern education systems. The quality of higher education is commonly believed to substantially determine the quality of the human resources in society (Esposito et al., 2013; Montesinos et al., 2008). Universities have traditionally had two main functions: teaching and scientific research. As a result, factors affecting the quality of higher education – both in theory and practice – continue to be important areas of study.
The evaluation of university performance is essential in determining how efficiently available resources are allocated to achieve desired outcomes. However, developing and implementing reliable performance assessment systems for universities is a challenging task that persists mainly because universities are complex organizations with multiple and diverse objectives as well as complex operational systems (Salas-Velasco, 2019).
Most studies in the relevant literature on academic performance measurement, with some recent exceptions, focus exclusively on research measures such as publication output, citation impact and number of PhD students without considering their broader impact on innovation and entrepreneurship. However, understanding the application and contribution of these research outputs to economic and commercial growth is more important than researching individual research measures.
This study aims to examine the alignment between the traditional academic performance indicators of universities and their entrepreneurial and innovative achievements. Specifically, we investigate how effectively universities use their academic resources to achieve their desired levels of innovation and entrepreneurship. To accomplish this, we use an input/output-based efficiency assessment approach using data envelopment analysis (DEA). The proposed assessment model incorporates academic performance indicators as inputs. The model’s outputs encompass four key dimensions: competence of scientific and technological research, economic contribution and commercialization, intellectual property (IP) development and industry–academic collaborations related to innovation and entrepreneurship.
The research uses data from the two main Turkish national ranking systems, URAP (University Ranking by Academic Performance) and TUBITAK (Scientific and Technological Research Council of Turkiye) to achieve its aims. URAP has published national and international university rankings annually since 2010, while TUBITAK has systematically tracked and reported Turkish universities’ entrepreneurial and innovative performance since 2012. These complementary data sources enable a robust analysis of the relationship between academic excellence and entrepreneurial outcomes.
2. Background
2.1 Higher education system in Turkey
Turkey’s higher education system has undergone a substantial transformation in recent decades and has expanded to include over 200 universities (131 public and 79 private). This growth, representing a nearly threefold increase between 2000 and 2020, has significantly enhanced educational access in Turkey while simultaneously raising critical concerns about maintaining academic standards across institutions (YÖK Report, 2020).
In terms of academic standing, some Turkish universities have achieved international recognition with performance metrics that indicate positive trends in terms of research impact (e.g. citations per faculty member), Turkish institutions’ overall research impact lags behind that of their counterparts in North America, Europe and Asia in terms of global rankings for academic standing (SCImago Institutions Rankings, 2024).
Efforts to internationalize Turkish universities have yielded notable results, with international student enrollment reaching 250,000 in 2022. This achievement is partially attributable to strategic initiatives such as the Turkey scholarships program, which provides over 5,000 scholarships annually to students from more than 170 countries (UNESCO Institute for Statistics, 2023; YÖK Internationalization Report, 2022). While these numbers indicate improvement, Turkish universities still lag behind leading countries in terms of global partnerships and faculty mobility.
Entry into Turkish universities is determined by the Higher Education Institutions Exam, which is administered annually by the Student Selection and Placement Center (ÖSYM). In 2023, approximately 3.5 million students registered for the exam (ÖSYM Report, 2023). As of the 2022–2023 academic year, the total number of students enrolled in higher education institutions (HEIs) in Turkey was approximately 8.3 million, comprising 6.7 million undergraduate and 1.6 million graduate students across public and private universities (YÖK Statistics, 2023). In 2023, Turkish universities produced over 900,000 graduates, including undergraduate, master’s and doctoral degree holders. This figure is in line with the government’s emphasis on increasing higher education output to meet the demands of the workforce (YÖK Statistics, 2023).
Although Turkish higher education has made considerable progress in terms of access and infrastructure, it continues to face challenges that affect the quality of education, research output and global competitiveness. Funding remains a significant challenge for Turkish universities, which receive less financial support for research and development compared to institutions in other countries, with Turkey’s public expenditure on higher education as a percentage of GDP lower than the average for OECD countries (OECD, 2021). This resource limitation affects research capacity and institutional development.
Furthermore, while research output in Turkish universities has increased, the impact of this research and the extent of university–industry collaboration remain areas of improvement (SCImago Institutions Rankings, 2024). Despite Turkish universities attracting over 250,000 international students, these institutions’ global competitiveness is hindered by their limited international partnerships, language barriers and low representation in global rankings (UNESCO Institute for Statistics, 2023). Centralized governance under the Council of Higher Education (YÖK) also restricts institutional autonomy, making it difficult for these universities to innovate (World Bank, 2019). This administrative framework, combined with rapid system expansion, has complicated the maintenance of consistent academic quality, particularly among newer institutions.
Additionally, retaining academic talent – many academics and researchers migrate to institutions abroad for better opportunities – remains a critical concern, as it significantly affects the development of knowledge-based economies (Akçomak, 2021). Turkish higher education must address these challenges through reforms, increased investment in research and stronger international collaborations to enhance its global standing.
2.2 Academic innovation and entrepreneurship
The purpose and objectives of higher education have been the subject of constant debate (Todorovic et al., 2011). While universities have made significant progress in basic research, they are also expected to enhance their capabilities in applied research and technological innovation – a necessity of today’s competitive global economy. The innovation and entrepreneurial roles of universities, often referred to as the “third mission,” and relevant strategies for achieving this mission have been extensively discussed (Montesinos et al., 2008; Diaz‐Gonzalez and Dentchev, 2022; Saoula et al., 2025) in recent years alongside traditional teaching and research.
The “triple helix” model introduced by Etzkowitz and Leydesdorff (1995) highlights the importance of collaboration between academia, industry and government in driving innovation. This model emphasizes the need for universities to not only disseminate knowledge but also engage in research commercialization and start-up incubation while contributing to the economic growth of society. The term “research ambidexterity” introduced by Chang et al. (2016), refers to research publication and commercialization – a new paradigm reflecting a shift in the traditional role of universities from being merely institutions of higher learning to becoming key players in driving innovation and entrepreneurship. In line with this direction and these strategies, new performance criteria, such as the number of patents held by university faculty and the number of start-up companies owned by university professors/students, have emerged for HEIs.
The concept of entrepreneurial orientation in organizations has been a long-standing subject of study (da Cruz et al., 2021). Rasmussen et al. (2011) worked on developing entrepreneurial competencies for new ventures within the academic environment, focusing on four university spin-offs from the UK and Norway. Their research underscored the pivotal role of academic assets such as research expertise, institutional frameworks and knowledge networks in driving innovation and venture creation. They suggest that by delineating the mechanisms through which universities can strategically nurture entrepreneurial capabilities, academic institutions can bridge the gap between academic knowledge production and the commercialization of innovation and academic entrepreneurship. Similarly, Philpott et al. (2011) delved into the concept of an entrepreneurial university, particularly focusing on key indicators that include the establishment of technology parks, the creation of spin-off firms, the number of patents and licenses, contract-based research, industry training courses, consulting services, grantsmanship, academic publication output and the production of highly qualified graduates.
Furthermore, as initially defined in Pasteur’s Quadrant Paradigm introduced by Stokes (1997), the innovation capabilities of universities have been assessed across various categories and have primarily been categorized as scientific and technological innovation capabilities. Fan et al. (2021) analyzed the innovation capabilities of 61 selected Chinese universities, considering the impacts of basic and applied research as well as the role of private research funding. They used two sets of indicators: “scientific innovation capability,” which measures basic research capability, and “technological innovation capabilities,” which focuses on applied research.
Holley and Watson (2017) define academic entrepreneurial behavior as “birds of more than one feather.” Although entrepreneurial behavior typically implies the starting and running of new ventures, mentioned that academic entrepreneurial behavior is somewhat unique, as it extends beyond a focus on startups to include both commercial and noncommercial activities. Similarly, Abreu and Grinevich (2013) suggested that academic entrepreneurship should extend beyond activities primarily reliant on patents, such as spinouts and licensing, to encompass any academic initiative that transcends the conventional realms of teaching and research, such as those that are innovative, involve risk and have the potential to yield financial rewards. Lam (2011) studied the motivations behind scientists’ engagement in commercial activities, focusing on three key concepts: “gold,” which represents financial rewards, “ribbon,” which denotes reputational and career-related awards, and “puzzle,” which signifies intrinsic satisfaction.
Mõttus and Lukason (2021) investigated the relationship between academic assets and startups founded by academicians at different academic career stages in Estonia using logistic regression. Their findings revealed that the influence of assets such as IP, publications and supervision experience shifts over the academic lifecycle, with IP emerging as a key driver of entrepreneurship in later stages. A more recent study by Thomas et al. (2023) introduced the concept of “multidextrous” universities, which strategically balance economic and social missions through teaching, research and community engagement. Their findings emphasize the importance of entrepreneurial management styles not only in fostering regional capacity building but also in enhancing institutional resilience and adaptability in dynamic environments. Furthermore, their study revealed that such universities play a pivotal role in driving innovative ecosystems, strengthening partnerships with local stakeholders and addressing societal challenges, thereby reshaping the traditional role of higher education in regional development (Thomas et al., 2023).
2.3 University rankings
International university rankings are an inevitable reality of higher education. While they are becoming more and more popular, they have increasingly become the subject of debate. These rankings are helpful, in the sense that they increase the public awareness and transparency of HEIs. On the other hand, the methodology they use and their selection and weighting of indicators have been highly criticized by researchers. The misuse and abuse of rankings has also raised concerns.
There are numerous global, national and regional university ranking systems that incorporate different perspectives, with the Quacquarelli Symonds World University Rankings (QS), Times Higher Education (THE), Shanghai Academic Ranking of World Universities (ARWU), U.S. News, The Performance Ranking of Scientific Papers for World Universities (NTU Rankings), University Ranking by Academic Performance (URAP) and Webometrics being among the most well known of these systems. Some of these systems, such as ARWU and URAP, focus on both research and academic performance, while others, such as the NTU Rankings, only consider published research articles. Additionally, THE rankings incorporate various factors such as teaching, research environment, research quality, industry and international outlook, whereas QS considers academic/employer reputation, faculty–student ratio, international faculty and international student ratios, citations per faculty, international research network, employment outcomes and sustainability.
Additionally, other national-level ranking systems, such as the Center for Higher Education Development (CHE) Ranking (Germany), the Austrian Agency for Quality Assurance and Accreditation (AQA), the Indian National Assessment and Accreditation Council (NAAC), URAP (Turkiye), exist. Each of these ranking systems differs in their specific focus area, methodology, approach and criteria (Kumar and Thakur, 2019).
The contemporary Germany-based ranking system “U-Multirank” (Link to the website of) is funded by the European Commission and compares university performances across five dimensions: teaching and learning, research, knowledge transfer, international orientation and regional engagement. U-Multirank’s 2022 edition encompasses 2,202 institutions from 96 countries and includes a series of 30 subject-specific rankings.
Federkeil (2008) was one of the earliest researchers in the field and discussed the relationship between rankings and quality assurance to understand their usefulness as well as their limitations. The number of publications per faculty member is commonly used to measure research productivity, while the number of citations is used as the key indicator of influence (Afzal et al., 2018; Thottoli et al., 2025). Since the number of university ranking systems, which use diverse methods, is increasing, can an index be developed to measure a university’s performance in all rankings taken together? Jajo and Harrison (2014) attempted to answer this question using real data extracted from different ranking systems. Millot (2015) criticized the fact that well-known international rankings only focus on a few hundred universities out of more than 20,000 HEIs. He compared the major rankings with the recently introduced U21 system ranking.
Lin and Chen (2021) also questioned whether considering different kinds of indicators can provide better ranking results. They introduced a novel ranking approach that combines academic, environmental and resource indicators in consideration of four well-known rankings (ARWU, QS, THE and US News) and the position of several renowned universities in all of rankings. They then listed these universities with their proposed ranking methodology and performed country-wise comparisons.
Another article by Mok (2012) critically reviewed the national innovation systems of Singapore, South Korea, Chinese Hong Kong and Chinese Taiwan in fostering technological research. Camanho et al. (2023) compared the educational performance of different European countries using a Global Malmquist Index based on the Strategic Framework for European Cooperation in Education and Training.
Montesinos et al. (2008) included the “third mission” of universities, namely, “services to society,” in their proposed ranking model. This new mission is expected to have a social approach, entrepreneurial focus and innovative dimension.
Researchers have published numerous studies on country-based local university rankings, both classical and with entrepreneurship and innovation dimensions. These studies include the works of Berbegal-Mirabent and Ribeiro-Soriano (2015) for Spain, Fernandes and Singh (2022) for India, Esposito et al. (2013) for Italy, Hutaibat et al. (2021) for the UK, Oguz (2022) and Orhan and Yalcin (2021) for Turkey, Viiu et al. (2016) for Romania and Williams and Kluev (2014) for Russia.
2.4 Measuring academic performance and efficiency
Within the extant literature, the measurement of teaching and research performance in universities primarily falls into three categories: relative performance measurements between universities (e.g. Yang et al., 2018; Nazarko and Šaparauskas, 2014; Zhang and Shi, 2019), between departments (e.g. González-Garay et al., 2019) and between courses (e.g. El-Mahgary et al., 2014).
The selection of input and output indicators for measuring the efficiency and effectiveness of universities is considerably diverse across the literature. For instance, González-Garay et al. (2019) included inputs such as student entry standards, expenditure per student, the ratio of students to staff and research intensity, while their outputs included student satisfaction, research quality, graduate prospects and value-added scores. By contrast, Zhang and Shi (2019) considered inputs such as human resources (e.g. the number of full-time faculty members), fixed assets (e.g. the number of books per student and the number of state key laboratories) and scientific and technological funds. Their outputs comprised academic achievements (e.g. the number of excellent doctoral dissertations) and personnel training (e.g. the number of undergraduates, postgraduates and master’s students).
Yang et al. (2018) selected inputs such as the number of teaching and research staff, R&D funds received from the central government and R&D funds from outside sources. Their outputs included the number of SCI/SSCI publications, total student enrollment (at the BSc, master’s and PhD levels), total patents and total intellectual properties. On the other hand, Kuah and Wong (2011) categorized indicators into two groups: teaching and research. Teaching inputs included the number of academic staff, student enrollment, average student qualifications and university expenditures. Research inputs included the number of research staff members, average research staff qualifications, research student numbers and research grants. Related teaching output factors were listed as the number of graduates, average grades of graduates, graduation rate and employment rate of graduates, while the number of publications, awards, IP and graduates from research indicators were considered research outputs.
Various measurement tools have been proposed in recent years to assess the entrepreneurial orientation of organizations. Todorovic et al. (2011) introduced the ENTRE-U Scale, designed to assess the entrepreneurial adaptation of universities using four primary indicators: private-sector firms, university policy, research mobilization and unconventionality. Additionally, this scale has the potential to evaluate university departments by considering commercialization outcomes, such as spinouts, patenting and licensing. However, Tatarski et al. (2020) argued that this scale might not be suitable for nonprofit organizations such as universities. Felgueira and Rodrigues (2020) combined metrics from the ENTRE and ENTRE-U scales to assess the entrepreneurial level of university faculties and researchers.
Tijssen et al. (2009) studied the innovative performance of universities through global benchmarking of university–industry research cooperation. Their study used a range of indicators, including overall research performance in different disciplines and the profile of university–industry cooperation. Kucińska-Landwójtowicz et al. (2023) proposed a performance measurement model for technical universities that included 90 KPIs. Liao and Suprapto (2023) present an integrative framework that links entrepreneurial behaviors and dynamic capabilities to competitive advantage and university performance through an extensive study of 240 universities in 13 Asian countries. Also, various studies have investigated the relationships among the key concepts of third-mission universities and their effect on performance, such as the influence of university–industry collaborations on firms’ innovative performance (Baba et al., 2009) and the relationship between entrepreneurial activities of universities and their competitiveness (Guerrero et al., 2016a) and regional competitiveness (Guerrero et al., 2016b).
While DEA is widely used to assess academic efficiency, other methods can also provide valuable insights. Stochastic frontier analysis (SFA), for example, models’ inefficiencies by estimating a “frontier” that accounts for random noise. While effective in contexts with significant stochastic elements, SFA requires researchers to make assumptions about inefficiency distributions, which may not always apply to higher education and is more complex than DEA. Ferro and D‘Elia (2020) reviewed studies using SFA in higher education, exploring its methodologies and variables.
Multi-criteria decision making (MCDM) methods, like AHP and TOPSIS, integrate multiple criteria, allowing for a more holistic assessment of performance. However, these methods can be subjective, as they depend on the weightings and criteria used, which might introduce bias. Maral (2024) proposed an MCDM-based model for evaluating university research performance, showcasing the utility of MCDM in academic efficiency.
Machine learning approaches, such as decision trees and SVM, have gained popularity for their ability to model complex relationships in large data sets. While they show promise, their application in higher education efficiency is still developing, and their “black box” nature limits interpretability. Perroni et al. (2024) discussed integrating machine learning with traditional efficiency models to enhance university efficiency assessment.
Despite the strengths of these approaches, DEA is the most appropriate method for this study due to its non-parametric nature, flexibility and ability to handle heterogeneous data without prior assumptions. DEA’s capacity to assess multiple inputs and outputs simultaneously makes it ideal for evaluating academic efficiency, especially across diverse institutions with varying resources and structures.
2.5 Data envelopment analysis to assess academic efficiency
DEA is a widely used efficiency assessment and benchmarking method in various areas. DEA is a linear programming methodology that empirically quantifies the relative efficiency of multiple similar entities or decision-making units (DMUs). Measuring an organization’s efficiency through DEA involves the use of both input-oriented and output-oriented models. Input-oriented DEA primarily targets cost minimization by proportionally reducing the inputs without decreasing outputs. Conversely, the output-oriented DEA model focuses on output maximization by proportionally increasing outputs without altering inputs.
This methodology first builds a convex envelope, often referred to as the “efficient frontier” or “best practice frontier,” that encompasses the assessed units. Units falling within this envelope are categorized as “efficient,” while those outside the enveloped are considered “inefficient” (González-Garay et al., 2019).
DEA results, when considered alongside a reference set of “efficient” and “inefficient” organizations, reveal organizational strengths and weaknesses, thereby supporting managers as they make their future projections. This novel perspective on university performance evaluation provides novel insights and inspirations that enable more realistic methods for evaluating the performance of universities. Agasisti and Ricca (2016) compared the efficiency of Italian public and private universities using DEA, while Brzezicki (2020) conducted a similar analysis for Poland. Another remarkable study by Kumar and Thakur (2019) proposed an original performance ranking for HEIs using dynamic DEA.
Previous studies have extensively used two-stage network DEA in various contexts. For example, Yang et al. (2018) investigated the productivity and efficiency of Chinese research universities, thereby revealing increasing average efficiency but notable technology deficiencies, while Nazarko and Šaparauskas (2014) assessed the efficiency of Polish colleges considering potential input, output and environmental variables. Kuah and Wong (2011) and Chen et al. (2021) evaluated teaching and research efficiency.
Furthermore, Zhang and Shi (2019) used an output-oriented DEA to compare the performance rankings of selected universities, conducting projection analyses for identified inefficiencies, while Orhan and Yalcin (2021) benchmarked Turkish universities in terms of entrepreneurship and innovation. Moreover, Chen et al. (2021) examined the teaching and research performance of Chinese universities. Finally, Salas-Velasco (2020) compared the efficiency of Spanish universities, while Singh et al. (2022) did the same for Indian universities using DEA.
The key gaps in DEA applications to emerging economies stem from data quality and availability issues, the difficulty of integrating unique contextual factors (e.g. market imperfections or institutional weaknesses) and methodological challenges in adapting DEA to these complex environments (Ullah et al., 2023).
3. Methodology
This study uses DEA to measure the efficiency of universities in using their academic resources for strategic innovation and entrepreneurial goals. By using a linear mathematical programming method, DEA identifies best practices across similar organizations, focusing on efficiency, commonly termed “technical efficiency” (TE). TE is the ratio of the total weighted sum of outputs and the total weighted sum of inputs. The evaluation of each unit derives weights through the DEA optimization process. A detailed description of the DEA algorithm and its calculation procedures can be found in the study by González-Garay et al. (2019).
DEA is a performance measurement method often used to evaluate the efficiency of DMUs such as businesses, organizations and departments. It compares multiple input and output variables to identify how well a unit transforms resources (inputs) into results (outputs). Essentially, DEA helps individuals highlight the most efficient units, which can then serve as benchmarks and indicate areas of improvement for other units.
While DEA is a powerful tool for assessing relative efficiency, its assumptions and limitations require careful consideration. First, DEA assumes homogeneous technology among DMUs, ignoring external factors (e.g. policies and economic conditions) that may influence performance; our study mitigates this issue by using objective indicators while acknowledging unobserved environmental influences. Second, DEA measures efficiency relative to the sample’s “best practice” frontier, meaning that the results are dependent on the context and are not absolute. Third, the model presumes linear/additive relationships among indicators – a criterion met by our selected inputs/outputs, as detailed in the methodology section. Fourth, we adopted a variable-returns-to-scale (VRS) approach, as university outputs (unlike manufacturing) rarely scale proportionally with inputs. Fifth, DEA is sensitive to data errors – we minimized this risk by relying on standardized, objective data sets (URAP and TÜBİTAK). Sixth, to ensure discriminatory power, we maintained a sample size (48 DMUs) that exceeded the recommended threshold (three times the total inputs/outputs). Finally, DEA’s static nature limits its ability to capture dynamic efficiency changes; while Malmquist-DEA could address this, our analysis focused on a single year due to data constraints. By transparently addressing these limitations, our study provides a robust yet context-aware efficiency evaluation of Turkish universities and contains implications for future longitudinal or cross-regional research.
DEA uses two primary types of frontier scales: constant-returns-to-scale (CRS) and VRS. Both scales estimate efficiencies in cases where changes in inputs or outputs result in a proportional change in outputs or inputs, respectively. Both output-oriented CRS and VRS models are applied in this study.
Selecting input and output indicators is a critical step in efficiency evaluation due to its influence on outcomes. In this study, the input and output indicators are drawn from the URAP and TUBITAK databases, respectively, with the indicators selected based on their theoretical relevance to the university’s academic and entrepreneurial performance, grounded in the established literature on higher education efficiency. While the main indicators align with those commonly used in the literature, this study accommodates four to seven sub-indicators with relevant weights. This approach fosters more realistic outcomes and enables more specific improvement recommendations for the sub-indicators.
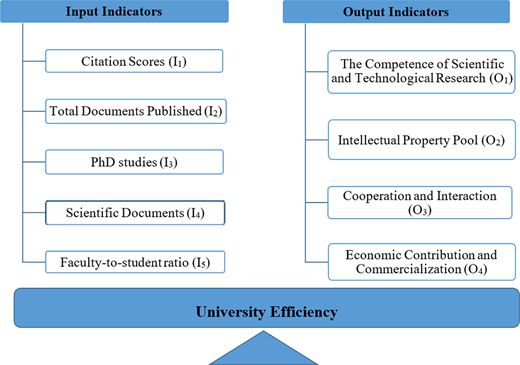
URAP ranks all Turkish universities based on five prevalent academic indicators:
Citation scores: The total number of citations of faculty publications in the last five years.
Citation scores constitute a widely recognized indicator of academic influence and research quality. Higher citation scores suggest impactful research, which reflects an efficient use of academic resources toward producing valuable knowledge:
Total documents published: The number of articles published in journals included in SCI, SSCI and AHCI scans in the first 75% of journal quartile rankings in terms of efficiency multiplier.
Research productivity, as measured by the volume of publications, is a key performance metric in academia. A higher number of publications indicate greater resource utilization in terms of generating research output.
Scientific documents: Total number of publications or papers published in the last five years.
The number of scientific documents published reflects the overall academic contribution of a university to a specific field. This indicator is essential for assessing the output efficiency of academic institutions.
PhD studies: Number of PhD students/total number of students.
The proportion of PhD students reflects the research capacity of a university, which is often seen as a critical indicator of academic excellence.
Faculty-to-student ratio: Total number of students/number of faculty members.
This ratio is linked to teaching quality and resource allocation efficiency. A balanced ratio can enhance learning outcomes and directly impact a university’s educational efficiency.
This study uses these input indicators, with lower values implying better performance. The input and output indicators used in this study are presented in Figure 1.
Additionally, TUBITAK evaluates and indexes the top 50 Turkish universities based on their entrepreneurial and innovative performance using four distinct indicators: competence of scientific and technological research, IP pool, cooperation and interaction and economic contribution and commercialization. These output indicators are ideally maximized. An overview of the output indicators and their corresponding sub-indicators are as follows:
Competence of scientific and technological research (15%):
Number of scientific publications (2.5%)
Number of citations (3.5%)
Number of projects (2%)
Amount of funds obtained from projects (3%)
Number of national and international science awards (1.5%)
Number of doctoral graduates (2.5%)
This output aligns with the increasing emphasis on universities’ roles in innovation and research. A university’s ability to produce scientific outputs and secure funding is crucial for its efficiency in advancing academic and technological knowledge.
IP pool (20%)
Number of national patent documents (5.2%)
Number of national utility model documents (3%)
Number of international patent applications (5%)
Number of international patent documents (6.8%)
Universities are major contributors to innovation, and the number of patents they hold indicates the commercialization of research outputs. IP is a key measure of a university’s entrepreneurial activity.
Cooperation and interaction (25%):
Number of projects completed with industry cooperation (5%)
Amount of funds obtained from industrial cooperation projects (6%)
Number of projects completed with international cooperation (5%)
Amount of funds obtained from international cooperation projects (6%)
Number of faculty/number of students ratio (1.44%)
Number of students registered with the industrial doctoral program (1.56%)
Interactions with industry and international collaborations are widely deemed to enhance a university’s research and innovation efficiency. These collaborations facilitate knowledge transfer and increase the university’s external impact.
Economic contribution and commercialization (40%):
Number of firms owned by academics (6%)
Number of companies owned by students/graduates (8%)
Net sales income of firms owned by academic (8%)
Net sales income of firms owned by students/graduates (11%)
Number of licensed patents and utility models (4%)
Number of companies funded by TUBITAK entrepreneurship programs (3%)
Universities are increasingly seen as economic drivers that contribute to the commercialization of research and job creation. A university’s number of startups, patents and other economic outputs is directly tied to the institution’s entrepreneurial efficiency.
This study’s analysis used data from 48 universities that appeared in both the URAP and TUBITAK rankings in 2022.
These input and output indicators are chosen for their alignment with theoretical models of academic performance, innovation and entrepreneurship, which are crucial for evaluating universities in the context of their strategic goals. By integrating these indicators, this study aims to provide a comprehensive measure of university efficiency in Turkey, specifically in the areas of academic research and entrepreneurial activity.
4. Analysis and results
This study analyzes and compares the efficiency of 48 selected Turkish universities encompassing both public and private institutions. The analysis is approached from the perspective of innovation and entrepreneurship, as it uses output-oriented DEA CRS and VRS models. The analysis uses numerical data detailed in Table 2. To streamline the analysis, the data for input and output indicators are normalized to fall within the range of [0.1–1.0].
4.1 Correlation analysis of indicators
The correlation coefficient values between the indicators are presented in Table 1. According to the statistics, a strong positive correlation exists among the indicators, indicating that an increase in input indicators corresponds to an increase in output indicators. For example, the indicator for the competence of the scientific and technological research indicator (O1) displayed the highest correlation with the input indicators. Conversely, the correlation between the IP pool indicator (O2) and all the input indicators was notably weaker than that of all other indicators. In general, four out of the five input indicators exhibited a strong correlation with all output indicators, which is acceptable for DEA.
Cronbach’s alpha reliability coefficient was calculated as 0.906, surpassing the common benchmark score of 0.7 observed in most social science research studies. After an analysis of standardized data used to assess universities’ efficiency was conducted, Cronbach’s alpha scores were found to range from 0.812 to 0.918, indicating a high level of internal consistency. These results suggest that each indicator significantly contributed to the alpha value.
To ensure that the data for all universities were reliable, individual checks of alpha values were performed. In each case, the alpha score exceeded 0.7, emphasizing the internal consistency of the scales and data used in this analysis. Cronbach’s alpha score for model reliability was 0.906, and excluding any input or output indicators does not notably increase this score. Therefore, Cronbach’s alpha analysis confirms that all indicators were sufficiently valid for further analysis.
4.2 Overall university efficiency analysis
The efficiency scores of the universities, determined through DEA, are presented in Table 3. An efficiency score of 1 signifies that the respective university operates at full efficiency and aligns with the efficient frontier line. An analysis of the comprehensive university analysis outcomes revealed that out of the 48 universities, 11 (23%) were operating at full efficiency. These universities (U1, U2(*), U4(*), U9(*), U10, U24, U28(*), U30(*), U36(*), U46(*) and U48(*)) are characterized as “perfectly efficient.” This designation arises from their achievement of technical efficiency (CRS), pure technical efficiency (VRS) and scale efficiency (SE) while maintaining a summation of zero for the slack and surplus variables. In simpler terms, these 11 universities demonstrate neither “excessive input” nor “deficient output,” with all input and output indicators operating optimally. Universities with efficiency scores below 1 are inefficient. Consequently, these universities must improve their internal resource allocation and ensure effective utilization to boost output indicators, thereby enhancing overall efficiency.
Descriptive statistics are summarized in Table 4. The mean VRS efficiency score is 0.894, with a standard deviation of 0.110. This value implies that these universities have the potential to enhance their outputs by an average of 11% without necessitating an increase in inputs. The efficiency scores for CRS and SE are also provided in Table 4.
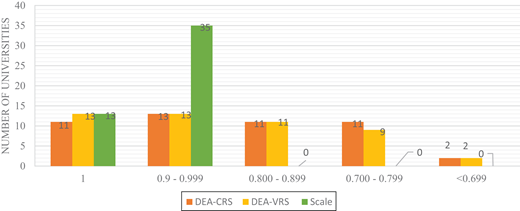
The VRS efficiency scores range from 0.645 to 1, and only 11 out of 48 universities achieved complete efficiency. Figure 2 graphically represents the distribution of the universities’ efficiency scores based on the CRS, VRS and SE methods. The SE score is derived from the ratio of CRS and VRS results.
Among the 48 universities analyzed, 46 (95.83%) exhibited efficiency scores greater than 0.7, with only two universities scoring below this threshold (U43(*) and U44). Although their VRS and CRS efficiency scores were notably low, ranging from 0.637 to 0.671, respectively, their SE scores were considerably higher at 0.988 and 0.995, respectively, indicating their relative operational efficiency in comparison to the potential for scale adjustment while maintaining efficiency.
Table 4 also illustrates that the average scores for CRS and VRS methods were 0.881 and 0.894, respectively, with corresponding standard deviations of 0.113 and 0.110, respectively. A significant portion of the universities showed efficiency scores ranging from 0.8 to 0.99, as made evident in the median values in Table 4, which shows that most universities boasted efficiency scores closely approximating 1 (falling between 0.904 and 0.994). Overall, Turkish universities displayed relatively high levels of innovation and entrepreneurship efficiency. Notably, the number of universities reported as efficient based on both the CRS (11 universities) and VRS (13 universities) results is consistent with those found to be efficient on the scale (13 universities).
4.3 Scale efficiency and returns-to-scale analysis
The SE score is calculated as the ratio between TE and pure technical efficiency (PTE) scores. These scores are derived from the CRS and VRS models, respectively. These SE ratings are vital in evaluating a university’s performance at its optimum level and offer insights into how efficiently a particular university operates. Additional analysis may be required if the SE score is less than 1, indicating inefficiency. This analysis might involve exploring the returns-to-scale (RTS) analysis, such as increasing-returns-to-scale (IRS), decreasing-returns-to-scale (DRS) and CRS models. SE scores not only indicate the level of efficiency but also assist in evaluating a university’s size. Inefficiency stemming from a low SE value suggests that the university operates at a relatively smaller scale, and that expansion efforts may be necessary.
Table 3 and Figure 2 present both the numerical results and graphical representations of the SE scores. The mean SE score was 0.985 with a standard deviation of 0.022. This average is notably higher than the CRS and VRS efficiency scores.
According to the SE scores presented in Table 4, the chosen universities exhibited relatively high efficiency scores, ranging from 0.914 to 1. Notably, none of the universities had significantly low SE values.
RTS results in Table 3 illustrate that 15 universities (31.3%) are fully efficient, 16 (33.3%) are categorized as DRS and 17 (35.4%) as IRS. A more detailed analysis in Table 3 indicates that the SE value of universities U1, U2, U4, U9, U10, U14, U19, U24, U28, U30, U32, U34, U36, U46 and U48 is equal to 1. These universities effectively used their available resources and operating on the most productive scale. It is crucial for these universities to maintain their current management strategies to sustain this level of performance.
As noted in Table 3, the SE values of universities U3, U5, U8, U11, U12, U15, U16, U20, U25, U26, U27, U31, U40, U44, U45 and U47 were less than 1. The corresponding RTS values for these universities indicate the DRS mode, signifying that an increase in input resources does not proportionally increase output resources. Therefore, these universities should explore strategies to enhance resource utilization.
It is crucial to highlight that for these universities, any additional increase in input indicators for these universities will not result in a proportional increase in output rates and, consequently, efficiency. Although these universities exhibited high input and output resources as well as SE scores ranging from 0.914 to 0.996, their efficiency rates cannot be assumed to be at their optimum. They seem to have faced challenges in the utilization of the input resources. While exceling in theoretical academic studies (e.g. citation scores, number of articles published, scientific documents, etc.), they encountered difficulties translating these accomplishments into real-world applications, such as licensed patents and utility models, collaborative industry ventures and establishing academic-affiliated firms.
Finally, the SE values of universities U6, U7, U13, U17, U18, U21, U22, U23, U29, U33, U35, U37, U38, U39, U41, U42 and U43 were also less than 1. However, their RTS is in IRS mode, signifying that a one-unit increase in input indicators leads to a higher increase in output indicators. In other words, these universities possess significant development potential, and their efficiency can be directly enhanced by increasing their resource investments.
4.4 Public vs private university efficiency analysis
Out of the 48 universities under study, 16 are private universities, denoted by “*” in Table 2, while the remainder being public universities. Descriptive statistics for the efficiency scores of public and private universities are presented in Table 4.
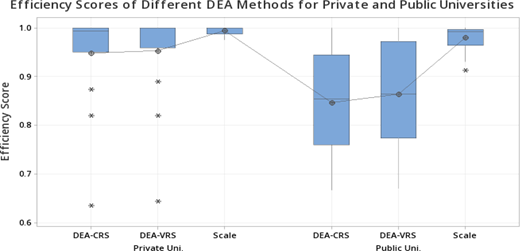
When considering the CRS and VRS results, the 95% confidence intervals (CI) for the average efficiency scores of public and private universities were calculated as (0.038–0.164) and (0.027–0.151), respectively. The calculated 95% CI values demonstrate a significant difference in efficiency scores between private and public universities. By contrast, the SE scores for public and private universities exhibit remarkable similarities. Figure 3 visually illustrates these similarities and differences through boxplot graphs.
The VRS results in Table 3 reveal that while nine out of 16 private universities are identified as “perfectly efficient,” only four out of 32 public universities achieved this status. This observation is particularly significant considering that many public universities have more extensive input resources than their private counterparts. These results suggest issues concerning the allocation and efficient utilization of input resources in public universities.
These findings notably align with the research of Agasisti and Ricca (2016), who examined the efficiency of Italian universities using different academic indicators. A similar conclusion regarding the higher level of efficiency of private universities was also drawn by Brzezicki (2020) Polish universities, particularly in terms of graduate earnings.
4.5 Projection/target analysis
Determining the slack values for the input and output indicators of DEA is essential for identifying any surplus input or deficient outputs. This surplus or shortage in input and output indicators quantify the discrepancy between the performance of an inefficient university and that of its peer university. The efficient frontier line illustrates the discrepancy between inefficient and peer universities.
Tables 1 and 2 in the Appendix contain detailed information on the target analysis results of the input and output indicators for each inefficient university. Additionally, Table 5 provides a descriptive analysis of the original and target values for the input and output indicators.
Table 5 reveals that among the Turkish universities selected for his study, the weakest outputs are associated with the IP pool (O2) and economic contribution and commercialization (O4). The potential for improvement is substantial, with the average enhancement potential for IP tools (O2) standing at 95.85%, while economic contribution and commercialization (O4) exhibit a gap of 38.73%.
Other output indicators, such as competence of scientific and technological research (O1) and cooperation and interaction (O3), also play significant roles in the observed inefficiencies and thus necessitate improvement. The summary of the slack analysis results for the output indicators suggests that while the selected universities perform well in theoretical areas like scientific research and publication, they face challenges in converting these theoretical outputs into practical, real-life solutions and economic applications. For a detailed slack analysis of the output indicators for all 48 universities, see Table A1 in the Appendix.
Our study revealed that most Turkish universities effectively utilize their resources. However, certain indicators, namely, PhD studies (I4) and faculty-to-student ratio (I5), significantly contribute to inefficiency, with average excesses of 12.75% and 20.57%, respectively. The selected universities perform well concerning the rest of the input indicators and require only minor improvements.
Negative percentage change values in Table A2 in the Appendix indicate an overabundance of input resources. This does not imply a reduction in essential inputs for academic life, such as the number of scientific publications and citations. Instead, it suggests enhancing the utilization of the current input resources to meet target performance levels.
Developing strategies to align critical research activities with desired outcomes in innovation and entrepreneurial success could constitute an effective approach in this regard. Encouraging researchers at these universities to concentrate more on priority areas and activities that strongly contribute to innovation and entrepreneurial success, such as IP development, economic contribution and commercialization, can also be productive. Table A2 in the Appendix contains a more detailed slack analysis of input indicators.
5. Conclusion
In this research, we conducted technical and operational efficiency analyses using the output-oriented DEA method on a sample of 48 Turkish universities, including 32 public and 16 private institutions. This analysis provided valuable insights into university performance from an innovative and entrepreneurial perspective, revealing that many institutions do not utilize their resources efficiently. With efficiency scores ranging from 0.637 to 1, most universities (95.83%) had efficiency scores above 0.7, with 73% surpassing the 0.8 threshold. However, only 23% of universities achieved perfect efficiency, with private universities generally outperforming public ones.
One of the study’s key findings is that Turkish universities underutilize their available resources. On average, these universities could achieve current output levels using only 89.4% of their resources. Excessive allocations in areas such as PhD studies and faculty-to-student ratios contribute significantly to these inefficiencies. Private universities consistently demonstrate higher efficiency scores, suggesting that they effectively manage their resources in innovation and entrepreneurship, unlike public institutions, where resource utilization varies greatly.
The study also crucially observes identifies inverse relationship between university size and efficiency. Smaller universities tend to have higher efficiency scores, a trend that is more prominent in private institutions. This indicates that larger public universities may need to reassess their resource distribution and administrative practices. Public universities operating under DRS should consider downsizing or reallocating resources to institutions with IRS, thereby optimizing their operational capacities.
The identified inefficiencies in research commercialization and IP, particularly in public universities, point to broader structural challenges. Many universities face obstacles in transforming research output into tangible economic and social contributions. These challenges stem from insufficient entrepreneurial skills among faculty, inadequate funding for technology transfer offices and weak university–industry collaboration mechanisms. Addressing these gaps requires the implementation of specific policy measures, such as enhancing funding for technology transfer initiatives, developing structured training programs to foster an entrepreneurial culture among academic staff and establishing incentive mechanisms for faculty to engage in industry-related projects.
Moreover, the need to revise the academic and administrative structures of Turkish universities to facilitate interdisciplinary research and better align with modern scientific trends is pressing. Transdisciplinary research is now essential for innovation; however, many institutions remain entrenched in traditional academic structures. Universities should adopt more flexible, dynamic governance models that encourage collaboration across disciplines and promote innovation ecosystems.
We propose specific policy recommendations tailored to Turkey’s higher education system to further enhance the practical impact of these findings. First, resource allocation should be adjusted by prioritizing efficiency in both public and private universities. For public institutions, targeted downsizing or resource redistribution could optimize performance. Second, strengthening university–industry-research collaboration is vital. This can be achieved through the establishment of dedicated innovation hubs and industry liaison offices and by providing financial incentives for collaborative research projects. Universities should also focus on expanding their academic autonomy to promote innovation, thus allowing for greater flexibility in curriculum design, research priorities and resource management.
Finally, Turkey’s higher education system must evolve to meet global challenges. By fostering a collaborative ecosystem that links universities, industry and research institutions, the country can drive forward the “third mission” of universities: supporting economic development through innovation and entrepreneurship. Providing academic, financial and administrative autonomy will further empower universities to adapt to global trends, thereby paving the way for a more contemporary and innovative higher education landscape.
By implementing these policy reforms and fostering a culture of collaboration, Turkish universities can achieve greater efficiency and more effectively contribute to national and global innovation. These recommendations offer actionable pathways for addressing current inefficiencies while positioning the Turkish higher education system as a leader in research, innovation and entrepreneurship.
Our study uses a quantitative DEA framework that uses objective input–output metrics derived from two well-established ranking systems: URAP, which measures academic performance, and TÜBİTAK, which assesses entrepreneurial and innovative activities. As these indicators are quantitative and standardized, our methodology can, in principle, be applied to other countries or regions provided that comparable data sets on academic assets and entrepreneurial outputs are available.
However, several contextual factors may influence the generalizability of our findings. First, data availability poses a challenge: global academic rankings such as QS, THE and ARWU are widely accessible, while systematic data sets on university-level entrepreneurial performance remain scarce. For instance, we identified only one specialized scale for assessing entrepreneurial orientation in universities, ENTRE-U. Second, institutional and socioeconomic differences, including variations in national education policies, industry–academia collaboration norms and funding mechanisms, may require adjustments in the selection of input and output variables. For example, in countries with strong government-led innovation ecosystems, such as Germany’s Fraunhofer model, additional parameters, such as public R&D grants, might be necessary. Finally, cultural and regulatory factors such as local attitudes toward risk, IP laws and start-up incubation support may influence entrepreneurial outcomes – elements that our current model does not explicitly capture.
Future research directions for enhancing the international relevance of this work include several key extensions. First, cross-regional comparative studies can be conducted by applying the DEA framework to universities in different regions, such as the European Union, East Asia or North America, to identify region-specific efficiency drivers. Second, longitudinal analyses can be performed to track trends in universities’ efficiency over time, allowing for the assessment of policy changes such as new innovation laws or funding schemes. Third, integrating qualitative metrics by supplementing DEA with qualitative methods, such as surveys on university–industry linkages, can help contextualize quantitative findings and provide a more comprehensive understanding of efficiency determinants. Finally, parametric methods such as SFA can be utilized to conduct dynamic efficiency analyses.
We acknowledge that our study’s generalizability is currently constrained by data limitations, particularly in terms of entrepreneurship metrics. Collaborative efforts with international research bodies could help standardize such data sets, thus broadening the applicability of our approach.
Funding
This research did not receive any specific grant from funding agencies in the public, commercial or not-for-profit sectors.