This empirical paper is an endeavor to explore the relationship between social media advertising (SMA) and customers' purchase intention (CPI) in three South Asian countries. SMA was further divided into three relevant dimensions: perceived relevance (PR), perceived informativeness (PI) and perceived credibility (PC). Furthermore, the authors incorporated a single mediator: customers' brand consciousness (CBC) to test the mediating effects on the direct relationships.
The authors purposively selected 1937 fashion-conscious individuals based on a cross-sectional survey design. The authors applied SPSS 25 for explanatory statistics and structural equation modeling (SEM) (through AMOS 25) for testing the hypothesized relationships.
Based on the responses and the application of statistical measures, the authors revealed that all of the three dimensions of SMA have significant positive relationships with CPI. CBC is also significantly and positively related to CPI. Regarding the mediating effects, CBC was identified to have full mediation effects on the relationships between PR and CPI and PI and CPI. On the contrary, the same variable was found to have partial mediation on the relationship between PC and CPI.
South Asia is a growing business hub and the largest consumer market in terms of population. This empirical study was undertaken to reveal the role of SMA on CPI in the three highly populated South Asian countries, which is rare in academia. The outcomes of this empirical study are expected to be useful for further research attempts regarding SMA and consumer behavior. Businesses and policymakers are also expected to benefit from formulating SMA-related strategies to retain present buyers as well as attract the prospective ones.
1. Introduction
Social media (SM) influences everything from purchasing to entertainment. More and more people from all backgrounds are joining these online social sites in recent years. “SM” refers to WEB 2.0 applications facilitating information exchange, user-generated content and association (Elefant, 2011). In 2021, there were over 2.7 billion Facebook users, 370 million Twitter users and 350 million LinkedIn users, according to a study (WebsiteSetup.org). User postings, comments, likes and other shared contents on such an SM platform give a wealth of information.
SM is rapidly influencing enterprises. In reality, all the organizations—bigger or smaller, profit-seeking or charitable, local or international—use the vast consumer base to boost reachability. Due to such a dramatic development, every firm seeks to manage a promising SM platform. The target audiences are the users on popular social networking sites (SNSs) and engaging with their favorite businesses on multiple levels. Social media advertising (SMA) may help a company to increase sales and improve client relations simplifying digital marketing. If the customers like SMAs, 71% of them will promote a brand, according to Infographic (2021).
Several companies leverage this large user base to promote, market and sell their products online. Since 2015, many major and minor, local and worldwide companies have been developing their presence on SM platforms, including Facebook, LinkedIn, Google+, YouTube, Twitter, WeChat and others. Professional and corporate groups can connect with clients using social media. Most SNSs allow firms to publicly promote their products/services or link to their sales website. These prospective one-to-one relationships make it easy to expand a business's reach. SMAs support many small firms and entrepreneurs with promising business concepts for free.
India has the second largest population base in the world just after China while South Asia has the highest population density. Southern Asia's population as of Wednesday, June 29, 2022, was 1,984,245,743, according to UN estimations (Worldometers.info). Southern Asia's median age is 27.6 years, accounting for 24.89% of the world's population (Worldometers.info). Nonetheless, South Asia has the most Internet and social media users and it is multiplying (WebsiteSetup.org). Every firm would want such a broad customer market, especially young individuals. Academics and scholars haven't studied SMA's impact on South Asian fashion customers' buying intentions. Our extended empirical examination may lessen such research gap and encourage additional research.
This empirical work investigates how three SMA components—perceived relevance (PR), perceived informativeness (PI) and perceived credibility (PC)—affect the customers' purchase intention (CPI) of 20 online fashion firms from India, Pakistan and Bangladesh. Customers' brand consciousness (CBC) was the only mediator used to test the mediating role over the direct connections. This study proposes to answer the subsequent questions:
What is the association between the components of SMA and CPI of South Asian fashion brands?
What is the mediating role of CBC on the relations between the components of SMA and CPI?
2. Literature review
2.1 SMA and CPI
SMAs can increase general CPI by increasing brand engagement, brand loyalty and positive feedback (Hosain, Jamil, & Rasel, 2022; Tajvidi & Karami, 2021; Ndung’u, Kinyanjui, & Abayo, 2020; Khan, Yang, Shafi, & Yang, 2019a, Khan, Fatima, & Matlloob, 2019b; Alalwan, 2018; Alalwan, Rana, Dwivedi, & Algharabad, 2017; Yao, Shanoyan, Peterson, Boyer, & Baker, 2017). SM-based ads may help a company meet its sales goals, boost conversions and boost ROI. SMAs have been suggested to be more dynamic, practical and effective in saving customers' time and effort (Mustafi & Hosain, 2020; Shareef, Baabdullah, Dutta, Kumar, & Dwivedi, 2018; Alalwan, Rana, Dwivedi, & Algharabad, 2017; Dwidevi et al., 2017; Venkatesh, Thong, & Xu, 2012; Venkatesh, Morris, Davis, & Davis, 2003).
SMAs are more likely to engage customers emotionally if they think the customized ads are helpful and practical (Rana, Dwivedi, Lal, Williams, & Clement, 2017; Chang, Yu, & Lu, 2015). Practically, Chang, Yu, and Lu (2015) validated convenience as a parallel element of performance expectations on consumer tastes and preferences such as intent and sharing intent. An additional study found that Internet-based advertising's usefulness primarily influences customers' online purchasing intentions (Ahn, Ryu, & Han, 2005). Lin and Kim (2016) established further proof that perceived utility affects customers' attitudes and purchase intention. Shareef, Mukerji, Dwivedi, Rana, and Islam (2019) found that advertisement value strongly affects SMA-based purchasing intention.
SMAs' ingenuity and appeal usually draw customers (Dwidevi, Rana, Tajvidi, Lal, Sahu, & Gupta, 2017; Wamba, Bhattacharya, Trinchera, & Ngai, 2017; Jung, Shim, Jin, & Khang, 2016; Lee & Hong, 2016). SMAs allow customers to manage, add and engage with each other, which lead to larger purchases. SMAs may also capture targeted leads for businesses. As per Marketing Promotion Online (2017), a social blog dedicated to SMA, social proof, also known as informational social influence, is a psychosomatic phenomenon where people assume the behaviors of others show appropriate conduct for a specific context. People follow others. They like to follow the majority. Social proof works by reassuring business prospects and promoting the product's benefits. Social evidence is abundant on SM (Jawad, Parvin, & Hosain, 2022). Others might mention a Facebook post praising a brand. The brand/company can leverage tweets on how the product/service transformed someone's life. A cheerful Instagram photo of a customer enjoying the service is also excellent feedback. SMA contents must be outstanding. Instead of the firm, fans should produce these contents. The company's SM profile might display positive comments from SMA followers. The corporation may design it by urging individuals to share certain content to be characterized to bigger viewers. Even a firm has a decent number of followers; most SM users would love to share it. SMAs may boost sales and conversions in several ways. The organization must first understand social media's business value and take action.
2.2 SMA and CPI in fashion industry
Clothing brands have occupied a large share of SMAs from their establishment. M2PressWIRE (2018) reports that fashion's hottest trend is the SM platform. Digital Research (Digitalresearch.biz), a digital marketing business, reports that fashion merchants' social media presence has grown more than any other industry. Fashion firms, designers and merchants build brand personalities using Facebook, Twitter and blogs. SMAs let designers talk to customers. They release movies, ads, behind-the-scenes and off-screen material and fashion exhibitions to make consumers feel like part of the brand family. Users' interactions on the brand's SM platforms can spread fashion and trend information through word-of-mouth (Dewi & Adine, 2022; Sikrant, 2020).
Luxury fashion brands' SMA initiatives emphasize hedonic and experiential values that may be obtained through indirect brand experience rather than product or service value. According to Killian and McManus (2015), fashion retail showroom managers divide SM platforms into 4 major segregations— news gathering, creative, entertainment and relationship management. They employ the 4 C’s— consistency, commitment, caution and customization, to develop a brand personality across all four channels. SMAs significantly affect brand awareness and image, according to Godey et al. (2016). Respondents said they would pay a premium for their preferred brand after seeing its SM messaging. SMAs help consumers modify their behaviors and views of high-street fashion businesses, according to Nash (2019).
South Asian countries such as India, Bangladesh and Pakistan experience this frequently (Wang, Ahmed, Deng, & Wang, 2019). Many small businesses and entrepreneurs are active on SNSs, especially Facebook and LinkedIn. Ahmed, Salman, and Ashiq (2015) examined SMA's influence on Pakistan's fashion sector. SMAs can increase sales by 20% in South Asian fashion business by 1% increase in advertisements. Kumari (2019) showed that Indian buyers increasingly use SM-based online purchases, particularly young individuals. She also observed that the Indian online SMA business is growing 50% annually and is expected to reach a thousand corers (1 crore = 10 million) in 2022. According to studies, Pakistani clothing manufacturers are rapidly generating new patterns and designs, making it difficult for marketers to build brands and attract potential buyers (Abrar, Bashir, Safeer, Shabbir, & Baig, 2019; Nasir, Vel, & Mateen, 2012). Most previous studies showed how Pakistan's garment and textile businesses use SMAs to attract clients (Husnain & Toor, 2017). Wang et al. (2019) found that Bangladeshi fashion sector SMA techniques successfully develop customer connection and preference.
2.2.1 PR and CPI
With SM platforms, advertisers may better customize messages and contents based on customer preferences (Jawad et al., 2022; Zhu & Chang, 2016). According to Laroche, Habibi, and Richard (2013), Liang, Chen, Du, Turban, and Li (2012), Ball, Coelho, and Vilares (2006), personalization keeps customers loyal and satisfied. As per Celsi and Olsen (1988), relevance may be defined as “the degree to which consumers perceive an object to be self related or in some way instrumental to achieving their personal goals and values” (Alalwan, 2018). For PR of SMAs, this paper adopted the definition provided by Zhu and Chang (2016), “the extent to which consumers perceive a personalized advertisement to be self-relevant or in some way influential in achieving their individual goals and values”.
Zhu and Chang (2016), Campbell and Wright (2008), Drossos and Giaglis (2005), Pavlou and Stewart (2000) have shown that consumers' perception of posted advertising information as relevant and tailored to their needs and preferences is essential. As an example, Pavlou and Stewart (2000) found that personalization affects consumers' trust, contentment and buying propensity. According to Pechmann and Stewart (1990), customers are more possibly to be fascinated in advertising if they consider it is more relevant to their tastes. PR affects customers' frequent usage intentions through self-awareness (Zhu & Chang, 2016). According to the conversations so far, customers would favorably evaluate SMAs and be more likely to rely on them while making purchase decisions if they believe such adverts are relevant to their aims and preferences. Consequently, we suggest testing the following research hypothesis:
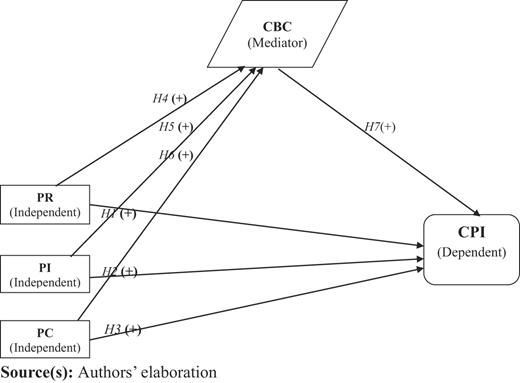
PR has a positive relationship with CPI.
2.2.2 PI and CPI
The term “Informativeness (PI)” was first expressed by Rotzoll and Haefner (1990) as “the extent to which a firm can offer sufficient information based on which customers can make better purchasing decisions”. PI is a perceptual concept assessed by a self-reported scale, according to Pavlou, Linag, and Xue (2007). This concept helps the sender (advertiser) attract potential consumers by allowing them to cognitively analyze the information and messages offered (Lee & Hong, 2016). In e-commerce, Gao and Koufaris (2006) noted the significance of PI on customer views.
Taylor, Lewin, and Strutton (2011) found that PI improves customers' attitudes toward SM. Phau and Teah (2009) found that PI affects customer views toward mobile SMS ads. Lee and Hong (2016) found that PI positively affects customers' SMA feedback and desire to buy SMA-advertised items. Kim and Niehm (2009) found a clear correlation between corporate website information quality and e-loyalty intention. SMAs' PI can promote brand loyalty and purchasing intention. Ott, Vafeiadis, Kumble, and Waddell (2016) found that high and medium SMA interactions boost PI, product and brand likeability and CPI (Mustafi & Hosain, 2020; Wang & Wen, 2017). Thus, we propose testing the subsequent hypothesis:
PI has a positive relationship with CPI.
2.2.3 PC and CPI
This research also examined SMA's credibility or trustworthiness. Ducoffe (1996) described credibility as reliable, persuading, compelling and offering trustworthy product information (Wang & Wen, 2017). E-advertising trust is influenced by PR, PI and perceived trustworthiness (Gao & Wu, 2010; Chowdhury, Parvin, Weitenberner, & Becker, 2010). Wang and Wen (2017) say advertising source trustworthiness affects effectiveness.
When trust is poor, mobile-based SNS advertising is less successful (Wang & Wen, 2017), presumably owing to the ambiguity of not being requested to “opt-in” while getting the SMS. An opt-in option might give it legitimacy and boost its efficacy (Mustafi & Hosain, 2020). Muzaffar and Kamran (2011) found that believability significantly affects young consumers' views of SM-based advertising. Sponsored links worry consumers more than other advertising strategies (Mustafi & Hosain, 2020). Thus, we recommend investigating the following research hypothesis:
PC has a positive relationship with CPI.
2.3 SMA and CBC
Brand consciousness can be defined as “the individual and indescribable assessment of the customers’ product over on top of its objective implication” (Lemon, White, & Winer, 2002). Each brand has three essentials. First, it attracts purchasers. Second, it fosters client loyalty. Lastly, it bonds customers emotionally (Ou, de Vries, Wiesel, & Verhoef, 2014; Vogel, Evanschitzky, & Ramaseshan, 2008; Lemon et al., 2002). Brands typically reflect consumers' tastes and attitudes (Manrai, Lascu, Manrai, & Babb, 2001). Brand-conscious customers want premium brands (Liao & Wang, 2009; Sprotles & Kendall, 1986). Brands signify prestige and class (Escalas & Bettman, 2005; Jamal & Goode, 2001). However, CBC is yet to be tested in SMA activities, despite its importance.
Customers strive to understand a brand's strengths, quirks and suitability while assessing it (Verhoef, Langerak, & Donkers, 2007). They create a good picture of a brand that matches their preferences and images, which raises the chance of their brand selection over competitors. Bolton, Lemon, and Verhoef (2004) claim that good product views can boost customers’ emotional involvement. According to Rust, Lemon, and Zeithaml (2004), brand consciousness influences customers' inclination to buy and brand recommendations. TV, radio and newspapers have been shown to improve brand loyalty, association and recognition (Yoo, Donthu, & Lee, 2000). As they trust SM platforms more than traditional marketing communication channels, consumers use them more to find information (Hosain et al., 2022; Mustafi & Hosain, 2020; Mangold & Faulds, 2009). Hence, SMA actions improve CBC. Consumer brand preference (CBC) is subjective (Lal & Sharma, 2021). Therefore, we propose to test the following hypotheses:
PR has a positive relationship with CBC.
PI has a positive relationship with CBC.
PC has a positive relationship with CBC.
2.4 CBC and CPI
Brand-conscious shoppers choose their preferred brands. Dresses or accessories with their favorite brand/logo catch their attention. Brand-conscious people only buy clothes and accessories with familiar brand names because they believe certain brands offer higher quality and comfort (Clark, Black, & Judson, 2017). Fashion-conscious shoppers who become loyal even pay a premium price for their favorite brand items since they gain joy from wearing their expected branded clothes. Brands are attracting their target audience, giving fashion marketers a new edge. Many customers think wearing a brand shows their personality, while others think it brings them mental pleasure (Shafaat, Shareef, Kishwar, & Aleem, 2020). Brands are emblems of prestige and trust among brand-conscious customers (Rageh, 2017). Many people worldwide are enamored with local and international fashion brands, buying them at a premium and recommending them to family, friends and coworkers. SMA is increasing brand awareness. Customers who want their favorite companies' newest fashion and accessories select brands to express their uniqueness and social position (Shah et al., 2012). SMAs are raising fashion awareness and purchasing intent. Most apparel businesses have daily-updated SM sites. Followers of such pages may immediately learn about new designs, collections and discounts. Clothing brands with consumer-known tags and SM pages attract more customers (Shafaat et al., 2020). Thus, the study proposes to test the subsequent hypothesis:
CBC has a positive relationship with CPI.
2.5 SMA, CBC and CPI
Fashion brand fans focus on clothing quality, design and fit (Kaiser, 1997). Jamal and Goode (2001) found that brand-conscious consumers value brand names. Bello and Holbrook (1995) claim that customers will pay more for branded items of equivalent quality. Globalization, SMAs and effective distribution networks have made many well-known local and multinational brands popular worldwide, giving great buy potential (Hosain et al., 2022). According to this, brand-conscious SMA followers are more likely to buy their favored brands.
Liu and Lopez (2016) define brand consciousness as customers' psychological direction of brand names before making a purchase. Ou et al. (2014) noted that brand consciousness goes beyond familiarity with a brand or selecting it over others to encompass the brand's value, image, quality and features that distinguish it from other brands. According to Giovannini, Xu, & Thomas (2015), well-known brands provide customers a sense of familiarity and emotional attachment, which motivates them to buy such brands. This empirical study should evaluate the following hypotheses:
CBC can mediate the positive relationship between PR and CPI.
CBC can mediate the positive relationship between PI and CPI.
CBC can mediate the positive relationship between PC and CPI.
2.6 Conceptual model
This empirical study included three dimensions of the independent variable (SMA): PR, PI and PC with a single dependent variable, CPI. Additionally, the study included a single mediator, CBC. The conceptual model of our empirical study has been illustrated in Figure 1.
3. Research method
3.1 Nature of data sample respondents
This study utilized primary data since secondary data were inapplicable to the perception-based quantitative scale dimension. We used a standardized questionnaire to obtain primary data. We purposively selected 1837 fashion-conscious individuals having three essential features: (1) those who have at least one SNS account (Facebook, Twitter or Instagram), (2) those who regularly follow SMAs; and (3) those who frequently/occasionally purchase clothing/accessories products. Those respondents were selected from three South Asian countries: India, Pakistan and Bangladesh.
3.2 Measurement tool
As a component of measuring instrument, we employed a structured survey instrument with 22 items having a “Five-point Likert Scale” that ranged from 1 “Strongly Disagree” to 5 “Strongly Agree”. Before sending out the questionnaire, the respondents were properly informed about the survey items to prevent misunderstandings and decrease the possibility of non-response bias.
3.3 Sampling procedure and sample size
We preferred purposive sampling technique for selecting the respondents. Purposive sampling can be used to choose respondents who can supply the exact information needed for the study, either because they are the only ones who know or because they match many of the researchers' requirements (Sekaran & Bougie, 2010). This sampling strategy lets investigators match specified criteria (Blumberg, Cooper, & Schindler, 2011). Pre-selected SM users who frequently follow SMAs and know fashion-related SMAs were sampled using purposive sampling.
We distributed 2000 online survey instruments to respondents in those three nations and 1870 instruments (93.5%) were returned to us. Out of those, 33 instruments were found incomplete, biased and oddly filled; and therefore, rejected. Eventually, 1837 samples (n) were taken for consideration.
4. Analysis and explanation
4.1 Respondents’ profile
As noted earlier, this empirical study's respondents were chosen to form a sample cluster that accurately represents the fashion customer market base having at least one active SNS account. Table 1 shows the respondents' demographics, including age, gender, education, occupation, daily SNS login and monthly purchase frequency.
According to Table 1, female responses (64.13%) outnumbered male respondents. 46.10% of responders were 18–27 years old, followed by 28–37 years (42.41%). 58.85% of our respondents held a Bachelor's degree. 61.57% of our respondents were doing different jobs. Half (50.79%) of those respondents checked into SNSs twice a day while two-thirds (65.49%) of them bought at least one fashion-related item in a month.
4.2 Reliability and validity
We used “composite reliability (CR)” and “average variance extracted (AVE)” to assess data dependability (Table 4). It can be observed that no CR value is below 0.70 as advised by Henseler, Ringle, and Sinkovics (2009), MacKinnon (2008), Hair, Anderson, Tatham, and Black (1998), Fornell and Larcker (1981).
We used Fornell and Larcker's (1981) criteria for discriminant validity, which compares AVE value with other variables' corresponding correlation values. They require AVE's square root value to exceed other variables' correlation values (Hair, Black, Babin, & Anderson, 2014). Table 2 shows the factor's discriminant validity.
4.3 Data normality
Tabachnick and Fidell (2001) recommend skewness and kurtosis values between −4 and +4. Table 3 shows that all values are inside the permitted range, showing overall normalcy.
Nevertheless, one of the independent variables' two indicators (PI3 and PI5) showed a little deviation in kurtosis (PI). The kurtosis values varied from −1.20 to 1.26. Sposito, Hand and Skarpness (1983) offer 3.3 to −3.3 as the upper and lower thresholds for normalcy, which allows us to consider those values as the relaxed rule for normality.
4.4 Model assessment
4.4.1 Measurement model
“Exploratory factor analysis (EFA)” is evaluated using four universal assumptions (Field, 2000; Hair et al., 1998): (1) sampling adequacy (Kaiser–Mayer Olkin [KMO]) greater than 0.5; (2) the minimum Eigen value for each factor; (3) factor loading of 0.50 for each item was considered the threshold for retaining items to make sure superior confidence; and (4) varimax rotation was used because it is an excellent common approach that simplifies factor analysis (Field, 2000).
Table 4 indicates the EFA outcomes. Hair, Black, Babin, and Anderson (2010) recommended that factor analysis can be proper when the KMO Test and Bartlett's Test of Sphericity were significant. Kaiser's sample adequacy index (Overall MSA = 0.828) and Bartlett's Test of Sphericity 2 (p = 0.000) indicate that this study's factor analysis was suitable for additional research. The EFA pattern matrix shows that all items had factor loading values greater than 0.50 (Table 4).
The first independent factor (PR) can explain 24.54% of the overall variance with four items, the second one (PI) 16.6% with five items, the third one (PC) 10.6% with four items, the fourth one (mediator) 8.71% with four items; and the fifth and only dependent factor (CPI) explained 9.13% of the overall variance with five items. All factors' reliability values (Cronbach's Alpha) above 70%, meeting Nunnally and Bernstein (1994) criterion value. Finally, CFA and SEM were suitable for all 22 items (SEM).
Statistics show that the factor analysis was correct. After validating study components, “Maximum Likelihood (ML)” and the “Promax Method (PM)” were used to extract factors from all the 22 items. Hair et al. (2010) advised that significant item factors should have loading values greater than 0.50. A five-factor model with Eigen Value greater than 1 explained 69.58% of the dataset's variation. Eigen Value categorized all 22 elements into five components. EFA indicated factor loadings of 0.716 and 0.922. All factors were suitable for further study after factor analysis (Table 4).
4.4.2 Measurement model outcomes (CFA)
CFA confirms the factor structure of observable variables. It lets researchers to verify that variables are linked to associated factors. The measurement model's relative Chi-Square was 2.016, lower than Marsh and Hocevar (1985)'s 5.0; and other fit indicators indicated a proper fit. The model's GFI was 0.921, higher than Joreskog and Sorbom's (1993) recommended value (0.90). Table 5 shows the CFA outcomes. The fit indices show a superior model-data fit.
The current study's “Adjusted Goodness of Fit Index (AGFI)” was 0.871, greater than Anderson and Gerbing (1984)'s suggested value of (>0.85), indicating a good fit. The non-incremental fit index Comparative Fit Index (CFI) was 0.908, above the proposed cut-off threshold of 0.90. (Bentler, 1990). In the CFA, the Root Mean Residual (RMR) was 0.077, below 0.08 and considered acceptable (Hu and Bentler, 1999). The Root Means Square Error of Approximation (RMSEA) was 0.076, lower than the recommended excellent fit to the data (Browne & Cudeck, 1993). Finally, the “Standardized Means Square Residual (SRMR)” was 0.077, below Browne and Cudeck's (1993) recommendation of 0.08.
4.5 Collinearity assessment
This study calculated variance inflation factors to determine multicollinearity (VIF). VIFs can be 1–10 or higher. The VIF number shows each coefficient's variance inflation percentage. In general, the VIF values range from 1 to 5, with 1 representing no correlation and 5 representing a strong correlation (Hair et al., 1998).
To confirm the impact of multicollinearity among the listed factors, the VIFs were calculated (Table 6) and identified to have a highest value of 2.111 as indicated on the table that is within the allowable limit as recommended by Hair et al. (1998).
4.6 Common method bias (CMB)
“Harman's single-factor test” can determine if one component explains the most variance. If a single component cannot explain the greater part of variation, we can assume that CMB did not take place (Aguirre-Urreta & Hu, 2019).
As per the outcomes presented in Table 7, a single factor can only explain 17.538% variance of this study demonstrating that CMB did not occur in our study.
4.7 Structural model
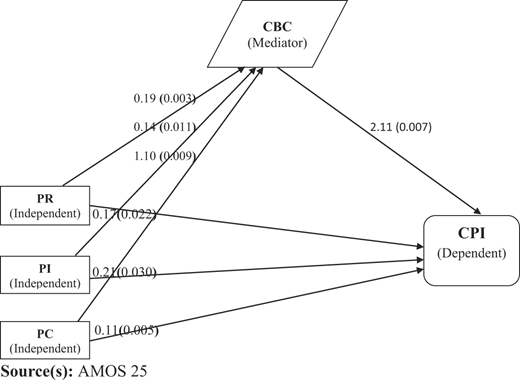
A covariance-based SEM was utilized in this study to identify the impact of three independent factors and a mediator on CPI. The statistical outcomes have been illustrated in Table 8 and Figure 2 with the structural parameter estimates and hypotheses testing outcomes.
Table 8 indicates that PR, PI and PC positively and significantly can explain 53% variance of the CPI in the three South Asian nations, validating the first three hypotheses (H1, H2 and H3) and suggesting positive linkages among the variables. Those three independent components also exhibit a strong and positive link with the mediator (CBC), confirming the subsequent three hypotheses (H4, H5 and H6) and demonstrating three positive indirect relationships. Further, the study found that CBC positively correlates with CPI, supporting hypothesis H7. Statistical analysis validated all three direct and four indirect hypotheses. Table 8 and Figure 2 exhibit structural equation model findings.
4.8 Mediation effects
The impacts of the mediating variable on the relationships among the dependent variable and independent factors have been presented in Table 9.
5. Discussion
According to the statistical analysis, PR has a significant positive relationship with CPI (β = 0.17; C.R. = 2.292; P < 0.05) which is consistent with the previous arguments and findings reported by Alalwan (2018), Zhu and Chang (2016), Laroche et al. (2013), Liang et al. (2012). PI had been identified to have a significant positive relationship with CPI (β = 0.21; C.R. = 0.308; P < 0.05) which is supported by Mustafi and Hosain (2020), Wang and Wen (2017), Lee and Hong (2016), Ott et al. (2016) who empirically identified a positive association between the influence of PR on consumers’ feedback toward SMA. Regarding PC, it was found that the factor has also a significant positive relationship with CPI (β = 0.11; C.R. = 2.736; P < 0.05) duly supported by Mustafi and Hosain (2020), Wang and Wen (2017), Muzaffar and Kamran (2011).
On the other hand, the analysis exposed that all the three components of SMA are significantly and positively related to the single mediator, CBC (β = 0.19; C.R. = 2.956; P < 0.05); (β = 0.14; C. R. = 1.430; P < 0.05); (β = 1.10; C.R. = 0.301; P < 0.5). Such outcomes are consistent with the findings previously reported by a number of scholars such as Mustafi and Hosain (2020), Lal and Sharma (2021), Ou et al. (2014). According to them, consumers try their best to be conscious or knowledgeable regarding their particular preferred brand and they do it mostly by following SMAs. Additionally, CBC was identified to have a significant and positive relationship with CPI (β = 2.11; C.R. = 1.139; P < 0.05) which is supportive to the earlier findings reported by Shafaat et al. (2020), Clark et al. (2017), Rageh (2017) who argued that SMAs are playing its role in escalating fashion consciousness and purchase intention based on their empirical investigations.
Finally, concerning the mediating role of CBC over the three direct relationships, the study identified that CBC can fully mediate the first two direct relationships: PR and CPI (β = 2.016; P < 0.05); and PI and CPI (β = 1.011; P < 0.05). However, the same variable can partially mediate the third one: PC and CBC (β = 2.002; P < 0.05). Such outcomes have been supported by a number of scholars such as Hosain et al. (2022), Liu and Lopez (2016), Giovannini et al. (2015), Ou et al. (2014). According to them, with the growing influence of globalization and increasing activities of SMAs and efficient distribution channels, many reputed local and international fashion brands have become admired in any part of the world offering high prospective of purchase. Brand conscious consumers who follow SMAs will have higher purchase intention of their preferred branded products.
6. Implications
6.1 Implications for theory
This study investigates how SMAs affect fashion-conscious customers in three South Asian nations. Once the fashion industry structure changed and businesses searched for low-cost marketing tactics, SM-based marketing and advertising became more popular. While several recent studies have examined the role of SMAs on sales performance (Yao, Shanoyan, Peterson, Boyer, & Baker, 2017), firm performance (Tajvidi & Karami, 2021), brand consciousness/loyalty (Jawaid & Rajadurai, 2021; Rrustemi & Baca, 2021); customer retention (Khan et al., 2019a, b; Wang et al., 2019); fashion consumption (Chu & Seock, 2020; Shafaat et al., 2020; Hsiao et al., 2019); and purchase intention/decision (Alatawy, 2022; Dewi & Adine, 2022); This study uses original data from a fashion consumer survey in three South Asian nations with roughly 25% of the world's population.
The proposed study model has provided a significant theoretical contribution to researchers in relevant fields by capturing several vital elements. This research adds constructs. This study also evaluated how perceived informativeness affect brand consciousness-driven purchasing intention. The results demonstrate such relationships. The current study explained SMAs' primary features and how they affect customers' perceptions and intentions. So, this study based on such a vast quantity of consumer data will be a torch-bearer for empirical examination of SM-related fashion sector marketing and advertising activities.
6.2 Implications for practice
The results of this study suggest that marketers using SM-based marketing and advertising should focus on crucial factors. The study suggested that marketers could encourage customers to engage with SM ads by soliciting feedback and comments (Jiang, Chan, Tan, & Chua, 2010). Instead of merely putting ads from marketers and disregarding customer complaints, SMAs should be two-way communication. Marketing and advertising teams can also monitor SMA-related consumer comments, questions and feedback. SMAs help advertisers grow their fan and following bases (Liu, Lee, Liu, & Chen, 2018). Marketers and advertisers must maintain the online interaction between businesses and customers or between/among consumers (Jiang et al., 2010). Hence, SMAs can provide existing and tentative customers with a vast volume of high-quality material (Liu et al., 2018). Mohammed, Fisher, Jaworski, and Paddison (2003) suggest using live online chat and chat rooms to increase customer interaction (Alalwan, 2018).
This study also found that SMA is informative. Marketers and advertisers must improve information quality and quantity. Indented SMAs should offer inclusive, relevant, timely and updated product information on features, pricing, discounts, delivery and availability (Alalwan, 2018; Mohammed et al., 2003). SMAs should emphasize product value. Advertising should cognitively and emotionally engage people (Shareef et al., 2019; Logan, Bright, & Gangadharbatla, 2012). Cognitive elements include cheaper cost, greater quality, guarantee or warranty and product availability. In contrast, emotional features include customer sentiments linked to the targeted brands (such as friendliness, innovativeness, originality and humor) (Mohammed et al., 2003). SMAs can provide important information using various media communication techniques, including video, audio, graphics, photos and text.
Perceived relevance also predicted to have a positive relationship with purchase intention. Marketers may tailor SMAs to customer interests. Marketers may track fans and followers' activities and profiles via cookies. It will assist marketers/advertisers in forecasting consumer tastes, preferences and interests. Advertisers can also personalize SMAs based on consumers' past experiences with ads or the experiences of friends/users with comparable interests and attributes (Zhu & Chang, 2016). Marketers must construct SMAs creatively and innovatively to increase perceived inherent utility (Alalwan, 2018). A multimedia combination of visuals, music, movies and audio may help emotionally engage customers and boost brand awareness and motivation. Increased interest in relevance, informativeness and credibility will increase brand consciousness and fashion product buying intention through social media marketing.
7. Limitations and further scope
Although this study established the essential SMA elements that might influence consumers, it has shortcomings that could be termed “research gaps” for future research. This research did not include an image, technology preparedness, advertising inventiveness, community, or privacy issue. Hence, future research that considers such aspects can include these issues. This study also did not evaluate the moderating effect of demographic characteristics such as age, gender, income and education. Future investigations can address demographic variables.
This study relied solely on structured survey questionnaire data. Future studies can qualitatively examine SM-based contents and consumer behaviors. Future researchers need SMA-based data collecting and content analysis methods. Future research can use such approaches and strategies to examine customers' perceptions, engagement and behavior toward SMAs. This study analyzed SMAs on Facebook, Twitter and Instagram without considering how these platforms affect the study model (Shareef, Dwivedi, & Kumar, 2016). Alalwan (2018) and Alalwan et al. (2017) suggest that future academics explore how these parameters vary by platform.
8. Conclusion
Academics and marketing policymakers are increasingly focusing on SMA concerns. This study expanded our knowledge of SMAs and their predictive effect on customers' buying intentions. Informativeness, relevance, trust and brand consciousness are significant determinants of purchase intention. This study acquired primary data from 1837 South Asian respondents using a structured questionnaire survey. The study model predicted a 53% variance in CPI, which is a notable performance. Three independent and one mediator factors in the four-factor model affected customers' purchasing intentions.
This study's statistical results showed that SMA components are positively correlated with CPI. CBC had a substantial positive connection with the dependent variable, according to the research (CPI). CBC also had complete mediating effects on the first two direct associations and modest mediation on the third. The results were analyzed in light of rational reasoning and past SMA investigations. The final paragraph examined this study's primary shortcomings and future research prospects. SMA, a rising advertising tool, require additional research on the issues like customer preference, brand consciousness and purchase intention.
Conflict of interests: There is no conflict of interests between the authors.
Source of funding: The authors did not receive any funding for this study.