

This study aims to examine whether institutional quality moderates the relationship between national intellectual capital and green economic growth.
Using annual data for seven ASEAN economies over 2000–2023, the authors use country-specific autoregressive distributed lag models with an error-correction representation to identify long-run cointegrating relationships and short-run adjustments among green economic growth, national intellectual capital, institutional quality and their interaction.
The authors compute long-run marginal effects of national intellectual capital at observed levels of institutional quality and identify institutional thresholds at which the effect changes sign. The results indicate systematic, but country-specific, moderation. Brunei, Thailand and Vietnam exhibit stronger contributions of national intellectual capital as institutional quality improves. In Brunei and Vietnam, the marginal effect shifts from negative at low levels of institutional quality to positive at higher levels. Indonesia shows a positive marginal effect across the full range of institutional quality, with only modest attenuation as institutional quality rises.
The authors’ findings imply that progress toward SDG 8 in ASEAN requires aligning institutional reforms with investments in human capital, research and development, intellectual property services and digital infrastructure, so that knowledge-based capabilities translate into more sustainable productivity and employment.
This study contributes to the green growth literature by focusing on national intellectual capital as a broad intangible asset base and by providing country-level evidence that its effect on green economic growth depends on institutional quality
1. Introduction
Sustainable Development Goal 8 underscores the need to sustain inclusive growth and productive employment while preserving environmental quality within ecological limits. Recent research increasingly frames that objective through green economic growth, which is commonly measured by green total factor productivity or composite indicators that connect income expansion with energy use, emissions and environmental performance (Jaradat et al., 2026; Menguy, 2024; Rashed et al., 2026). Prior studies show that financial depth, technological capability and innovation systems can support greener growth when enabling conditions are present. At the same time, national intellectual capital, understood as a country's stock of human, structural and relational knowledge assets, has been linked to productivity, innovation and potentially environmental performance (Ma et al., 2023; Yasin et al., 2026). Evidence from Asia Pacific further suggests that the effect of national intellectual capital on green innovation becomes stronger as institutional quality improves, pointing to a governance channel through which intangible assets shape technological change in environmentally oriented directions (Le et al., 2025).
ASEAN economies face an acute version of this challenge at the intersection of SDGs 8, 9 and 13. Energy demand continues to rise, the region attracts a modest share of global clean energy investment and coal remains central to power generation, intensifying emissions pressures (Li et al., 2026). Recent assessments show that Southeast Asia is off track for multiple SDG targets, particularly those related to climate action and the energy transition (ESCAP, 2025; Garg et al., 2026). Policymakers therefore confront a dual mandate of sustaining income growth while accelerating a shift toward low-emissions development consistent with national commitments and regional cooperation priorities (ASEAN, 2024).
Previous studies examine national intellectual capital and economic performance in developing economies, national intellectual capital and green innovation under institutional moderation in Asia Pacific panels and institutional quality as a driver of green growth in other regions, but existing studies do not establish how national intellectual capital, institutional quality and green economic growth interact in ASEAN over the long run (Seleim and Bontis, 2013; Le et al., 2025; Rafiq et al., 2025). That omission matters because green growth requires a transition toward low-carbon, resource-efficient production rather than conventional output expansion alone, meaning that greener growth depends not only on knowledge-based capabilities but also on institutions that can coordinate policy support for emerging green sectors (Wang and Wang, 2025). Governance systems marked by rigidity, policy inertia or continued support for polluting sectors may therefore weaken the environmental returns from intangible assets by delaying the reallocation of intellectual capital toward greener production and innovation (Sun et al., 2025). The present study addresses this gap by using country-specific autoregressive distributed lag (ARDL) models to examine how the long-run effect of national intellectual capital varies with institutional quality in ASEAN and by deriving marginal effects and institutional thresholds that make the moderator mechanism directly interpretable in both theoretical and policy terms, consistent with the logic of conditional inference in interaction models (Brambor et al., 2006).
Our contribution to literature and practice follows three interconnected lines that align with SDG 8. First, the study advances green growth research by showing that the effect of national intellectual capital on green economic growth depends on institutional quality rather than remaining uniform across economies. The resource-based view and the knowledge-based view explain why human capabilities, organizational structures and relational networks operate as productive intangible assets that support innovation and long-run performance (Barney, 1991; Grant, 1996). At the national level, intellectual capital captures accumulated capabilities and thereby supports productivity upgrading and green transformation (Lin and Edvinsson, 2011; Danta and Rath, 2024). Because green growth requires a shift toward low-carbon and resource-efficient production, the contribution of national intellectual capital also depends on institutions that reduce uncertainty, coordinate policy and channel knowledge toward sustainable sectors (Wang and Wang, 2025; Sun et al., 2025). Second, our study derives long-run marginal effects and institutional thresholds from country-specific ARDL models, thereby making the interaction substantively interpretable in a time-series setting (Brambor et al., 2006). Third, this paper reveals clear heterogeneity across ASEAN, with complementarity in Thailand and Vietnam, an unlocking effect in Brunei, weak negative moderation in Indonesia and neutral moderation in Malaysia, Singapore and Cambodia (Le et al., 2025; Ma et al., 2023; Jiakui et al., 2023).
The remainder of the paper proceeds as follows. Section 2 reviews the pertinent literature. Section 3 details the econometric framework and data. Section 4 reports and interprets empirical findings. Section 5 concludes with the main results and their policy implications.
2. Literature review
2.1 Theoretical foundation
Endogenous growth theory holds that sustained growth depends on knowledge creation, learning and technological progress rather than on factor accumulation alone, which places productive capabilities at the center of long-run development (Acheampong and Taden, 2024). At the national level, intellectual capital captures these capabilities through accumulated human, structural, social and relational assets, extending growth analysis beyond conventional physical inputs and linking intangible resources to broader development performance (Seleim and Bontis, 2013). The resource-based view and the knowledge-based view reinforce this argument because both perspectives treat valuable, difficult-to-imitate knowledge assets as the foundations of innovation, competitiveness and long-run advantage (Barney, 1991; Grant, 1996). Such logic is especially relevant to green economic growth, as greener growth requires not only higher output but also a shift toward low-carbon, resource-efficient production and consumption (Wang and Wang, 2025).
However, national intellectual capital alone may not generate greener growth outcomes. Institutional theory and new institutional economics suggest that formal rules, regulatory quality, governance capacity and enforcement shape resource allocation and the credibility of policy incentives (Davis and North, 1970; Acemoglu et al., 2001). Strong institutions can therefore support greener investment and innovation, while weak governance may divert intellectual capital toward conventional growth paths rather than environmentally sustainable development (Sun et al., 2025; Bui and Doan, 2025).
2.2 Role of national intellectual capital in driving economic growth
National intellectual capital has become increasingly salient in the knowledge economy and is often viewed as an important foundation for post-crisis adaptation and long-run development (Vo and Tran, 2025). Existing empirical studies have shown that intangible capabilities, including human capital, social capital, technological capacity, digital development and trade-related learning, can support greener growth trajectories (Degbedji et al., 2024; Tufail et al., 2024; Wang and Wang, 2025; Zheng et al., 2025). Nevertheless, much of that literature remains fragmented because most studies examine isolated channels rather than a broader national stock of intangible resources.
The concept of national intellectual capital offers a more integrated perspective, encompassing human, structural, social and relational capabilities that jointly influence learning, innovation and coordination. Early cross-country evidence established both the feasibility of measuring national intellectual capital and the importance of national intangible assets for macroeconomic performance (Seleim and Bontis, 2013). More recent sustainability-oriented research suggests that knowledge-based capabilities support green outcomes through innovation, resource efficiency and technology diffusion, particularly when combined with financial and technological development (Jiakui et al., 2023). Time-series evidence also indicates that cleaner energy use and innovation are associated with stronger green economic growth, reinforcing the view that knowledge-related capabilities contribute to economy-wide environmental performance rather than to innovation outputs alone (Sohag et al., 2019).
2.3 Institutional quality and its impact on green economic growth
Institutional quality occupies a central position in explanations of long-run development because institutions shape incentives, reduce or intensify transaction costs and influence the credibility of state intervention in markets. From the perspective of institutional economics, formal rules and informal norms affect the capacity of firms and governments to coordinate investment, manage uncertainty and support innovation. In the context of green economic growth, the importance of institutional quality is even more pronounced, as a low-carbon transition requires coordinated action across regulation, finance, infrastructure and technological upgrading. A green transformation, therefore, depends not only on the existence of cleaner technologies but also on whether governance systems can create a stable environment in which such technologies are adopted, financed and diffused efficiently.
Empirical literature supports this broad view, but the literature also reveals important nuances. A large body of work shows that stronger institutions promote renewable energy deployment, support the enforcement of environmental policies and improve the efficiency of public intervention in the green transition. Studies on feed-in tariffs, renewable portfolio standards, public support for research and development and tradable certificates indicate that environmental policy instruments are more effective when regulatory quality and implementation capacity are sufficiently strong (Yin and Powers, 2010; Jenner et al., 2013; Smith and Urpelainen, 2014; Kilinc-Ata, 2016). Other studies show that governance quality reduces policy uncertainty and increases the credibility of long-term decarbonization strategies, thereby encouraging both public and private actors to commit resources to green sectors (Danta and Rath, 2024; Rafiq et al., 2025). More recent evidence further indicates that stronger institutions are associated with higher green economic growth in developing and emerging regions, including the WAEMU area, and with stronger renewable energy uptake in OECD economies (Degbedji et al., 2024; Rafiq et al., 2025).
2.4 Institutional quality moderates the nexus between national intellectual capital and green economic growth
A moderator perspective provides a more theoretically complete explanation of green economic growth than separate main effects alone. National intellectual capital represents the stock of human, structural, social and relational capabilities that support knowledge creation, learning and innovation (Dinh and Tran, 2026; Tran et al., 2025). However, the economic and environmental returns to those capabilities are unlikely to be identical across institutional settings. Strong institutions can strengthen the contribution of national intellectual capital by reducing uncertainty, improving policy coordination, enforcing environmental rules and creating clear incentives for firms to direct innovation toward cleaner sectors. Under such conditions, human capabilities, research systems, organizational routines and relational networks are more likely to be transformed into green productivity gains. Weak institutions, by contrast, may weaken the same process by introducing policy ambiguity, corruption, weak enforcement and coordination failures, thereby lowering the capacity of knowledge assets to support a green transition (Sun et al., 2025; Bui and Doan, 2025).
The available evidence increasingly points in that direction. Research on environmental sustainability shows that robust governance frameworks improve resource allocation and support the diffusion of green technologies through credible policies and incentives, whereas institutional weakness hinders the adoption and scaling of environmentally sustainable innovation (Sun et al., 2025; Freitas et al., 2025). Studies at the intersection of innovation, sustainability and intellectual property further show that institutional arrangements shape the direction, appropriability and diffusion of green innovation, which implies that the returns to intangible assets are partly determined by the policy and regulatory environment in which those assets are embedded (Liu and Zhong, 2024). Related work also finds that institutional quality conditions the environmental effects of renewable energy, financial development and political risk, which suggests that institutions influence not only green outcomes directly, but also the extent to which complementary resources become environmentally productive (Khan et al., 2022; Wang et al., 2022; Wang et al., 2023). The most relevant evidence for the present study comes from Asia and the Pacific, where Le et al. (2025) show that national intellectual capital has a positive effect on green innovation and that stronger institutional quality reinforces that effect. That contribution is important because it shifts the literature from separate main effects toward a conditional relationship.
2.5 Theoretical gaps and hypotheses development
Existing research shows that knowledge-based capabilities, institutional quality and sustainability outcomes are closely connected, yet current scholarship has not fully explained how green economic growth emerges from their interaction (Seleim and Bontis, 2013; Degbedji et al., 2024; Le et al., 2025). Studies on green growth confirm that human capital, digital development, technological progress and financial conditions can support greener development. However, many of these studies rely on fragmented proxies of productive capability rather than on the broader concept of national intellectual capital, which combines human, structural, social and relational assets within a unified framework (Jiakui et al., 2023; Wang and Wang, 2025; Zheng et al., 2025). Such fragmentation matters because greener growth depends on the joint operation of multiple intangible resources rather than on isolated channels alone, which means that a broader capability-based concept is needed to explain how economies adapt production and innovation to environmental constraints (Grant, 1996; Seleim and Bontis, 2013).
Second limitation concerns the outcome variable. Much recent work focuses on green innovation, ESG performance or firm-level sustainability indicators. At the same time, much less attention is given to green economic growth as an economy-wide outcome that captures whether innovation, structural change and environmental adjustment are translated into macroeconomic performance (Le et al., 2025; Liu and Zhong, 2024; Wang and Wang, 2025). Green innovation is clearly important for the sustainability transition. However, green innovation alone does not show whether the benefits of cleaner production and technological change are broad enough to improve environmentally adjusted growth at the national level (Sohag et al., 2019; Ma et al., 2023). A third limitation concerns institutions. Institutional quality is often modeled as a direct determinant of environmental or economic performance. At the same time, far fewer studies explain the conditions under which institutional quality strengthens the productivity of national intellectual capital rather than simply accompanying stronger outcomes (Acemoglu et al., 2001; Danta and Rath, 2024; Degbedji et al., 2024).
Recent work on green finance, ESG frameworks and digital transformation reinforces the need for a more integrated perspective, as financial, technological and governance mechanisms do not operate independently in the sustainability transition (Ma et al., 2023; Jiakui et al., 2023; Sun et al., 2025). The ASEAN context makes this gap more important because ASEAN economies differ sharply in governance quality, resource dependence, industrial structure and transition capacity, meaning that similar stocks of national intellectual capital may yield very different green growth outcomes (ESCAP, 2025; ASEAN, 2024). The present study addresses that gap by treating national intellectual capital as a stock of intangible productive capabilities and institutional quality as the governance condition that determines whether those capabilities are directed toward greener production, cleaner technologies and more resource-efficient structural change (Barney, 1991; Grant, 1996; Acemoglu et al., 2001). Figure 1 shows the theoretical framework.
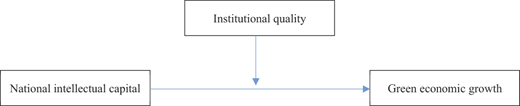
The theoretical synthesis above leads to a set of testable propositions. The first proposition follows from endogenous growth theory and the knowledge-based view. Economies with stronger national intellectual capital should possess more developed human capabilities, better organizational and innovation infrastructures and stronger relational channels for knowledge diffusion (Vo et al., 2025). Such conditions improve the capacity to adopt cleaner technologies, reorganize production and raise resource efficiency (Ma et al., 2023). A positive long-run relationship between national intellectual capital and green economic growth is therefore expected. Hence, we propose the following hypothesis:
National intellectual capital has a positive long-run effect on green economic growth.
The second proposition follows from institutional theory and the literature on governance and sustainability. Stronger institutional quality reduces uncertainty, improves coordination, supports environmental enforcement and raises the credibility of policy signals that favor low-carbon investment and green structural change. Such institutional conditions should directly improve economies' performance in achieving greener growth outcomes. Therefore, the second hypothesis is formulated as follows:
Institutional quality has a positive long-run effect on green economic growth.
The third proposition is the core theoretical claim of the present study. National intellectual capital does not operate in a vacuum. The productivity of human, structural and relational assets depends on whether governance systems can allocate resources efficiently, coordinate policy across sectors and sustain incentives for green innovation and implementation (Le et al., 2025). Stronger institutional quality should therefore increase the likelihood that national intellectual capital is translated into green economic growth. By contrast, poorer institutional quality should reduce or distort the environmental payoff of national intellectual capital (Sun et al., 2025; Bui and Doan, 2025). The expected relationship is accordingly conditional rather than constant. Therefore, the following hypothesis is proposed:
Institutional quality moderates the effect of national intellectual capital on green economic growth.
3. Model and data
3.1 Research model
The ARDL framework is used for seven ASEAN economies over the period from 2000 to 2023 because the ARDL approach allows simultaneous estimation of short run dynamics and the long run equilibrium relationship within a unified specification when the variables are integrated of order I(0) and I(1), provided that none of the variables is integrated of order I(2) (Pesaran et al., 2001). The ARDL framework is therefore appropriate for the present study because the empirical objective is to distinguish between transitional adjustments and steady-state relationships among green economic growth, institutional quality, national intellectual capital and their interaction in a country-specific time-series setting (Pesaran et al., 2001; Kripfganz and Schneider, 2023).
Following Pesaran et al. (2001), the model is estimated in its unrestricted error-correction form because the unrestricted error-correction representation contains both lagged level variables required to identify the long-run relationship and differenced variables required to capture short-run adjustments around equilibrium. The unrestricted error correction model is written as:
where: m and v denote lag orders for the regressors and the dependent variable, respectively. GEG denotes green economic growth, IQ is institutional quality and NIC is national intellectual capital. The interaction term IQ*NIC is included to test whether the contribution of national intellectual capital to green economic growth varies systematically with institutional quality, which is consistent with the logic of multiplicative interaction models discussed by Brambor et al. (2006). The differenced terms in equation (1) capture short-run movements. In contrast, the lagged level terms embed the information required to recover the long-run equilibrium relationship among the variables (Pesaran et al., 2001).
The long-run Equation is obtained by normalizing the coefficients of the lagged explanatory variables by the coefficient of the lagged dependent variable, because the unrestricted error correction model embeds the equilibrium relationship in reduced form rather than reporting the long-run coefficients directly (Pesaran et al., 2001). Kripfganz and Schneider (2023) explain that such normalization is the standard procedure for transforming the unrestricted error correction representation into an interpretable long-run equilibrium equation in applied ARDL analysis. The normalized long-run relationship implied by equation (1) can therefore be expressed as:
where the normalized long-run coefficients are recovered as:
with denoting the coefficient on . A valid long-run interpretation requires evidence of cointegration from the bounds test and a negative adjustment coefficient in the associated error correction representation, because a negative and statistically significant adjustment term indicates that deviations from the long-run equilibrium are corrected over time rather than diverging persistently (Pesaran et al., 2001; Kripfganz and Schneider, 2023).
Because the empirical specification includes an interaction between institutional quality and national intellectual capital, the economically relevant interpretation does not rest solely on the sign of . Interaction models require conditional interpretation because the effect of one explanatory variable depends on the level of the moderator rather than remaining constant across observations (Brambor et al., 2006). The long-term marginal effect of national intellectual capital on green economic growth is therefore written as:
where denotes a given level of institutional quality. Equation (4) allows the contribution of national intellectual capital to be evaluated at substantively meaningful levels of institutional quality, including the minimum, mean and maximum observed values, and also permits identification of the institutional threshold at which the sign of the national intellectual capital effect changes. Such a procedure links the ARDL interaction model directly to the theoretical proposition that the productivity of national intellectual capital is conditional on institutional quality rather than constant across institutional environments (Brambor et al., 2006).
We model green economic growth (GEG) as the outcome variable. Following Degbedji et al. (2024), GEG is constructed as a composite index:
where: GDP is real gross domestic product (constant 2015 US$); EEXP is public expenditure on education; FDEP is the monetary value of forest depletion; CEMI denotes the monetary value of CO2 emissions; and MDEP is the monetary value of mineral depletion (coal, crude oil and natural gas); For estimation, we take the natural logarithm of this composite measure.
We build an institutional quality index (IQ) using principal component analysis (PCA), as presented in equation (6) below:
where: ωi represents the component loadings or weights, and INSi denotes the original proxy of institutional quality, including control of corruption, government effectiveness, political stability and absence of violence/terrorism, regulatory quality, rule of law and voice and accountability.
In addition, we also construct a composite index of national intellectual capital (NIC), extending Vo and Tran (2025), by aggregating three pillars of national intellectual capital, as follows:
where: ωi represents the component loadings or weights, and ICi refers to the pillars of national intellectual capital, which include national human capital (HC), national structural capital (SC) and national relational capital (RC).
For the set of control variables (X), the analysis incorporates financial development (FD), trade openness (TR) and government expenditure on education (GVE). The inclusion of these factors follows prior empirical evidence (Degbedji et al., 2024; Vo and Tran, 2025) that underscores their relevance in shaping green economic growth.
3.2 Data sources
The study draws data from the World Development Indicators (WDI) and Worldwide Governance Indicators (WGI) databases, both compiled by the World Bank. A detailed summary of the variables and their corresponding measurements is presented in Table 1.
Variable definitions and their measurements
| No. | Abbreviation | Variable | Measurement | Source |
|---|---|---|---|---|
| Dependent variable | ||||
| 1 | GEG | Green economic growth | GEG = GDP + EEXP – MDEP – FDEP – CEMI | WDI |
| Independent variables | ||||
| 2 | IQ | Institutional quality | Institutional quality index | WGI |
| 3 | NIC | National intellectual capital | National intellectual capital index | Vo & Tran (2025) |
| Control variables | ||||
| 4 | FD | Financial development | Broad money supply (per cent of GDP) | WDI |
| 5 | TR | Trade openness | Trade (per cent of GDP) | WDI |
| 6 | GVE | Government expenditure on education | Government expenditure on education (per cent of GDP) | WDI |
4. Empirical results and discussions
4.1 Descriptive statistics
Table 2 reports summary statistics for the study variables. Within-country dispersion in GEG is modest (standard deviations mostly ≤0.5), indicating relatively smooth year-to-year movements. Institutional quality exhibits substantial cross-country heterogeneity. Singapore records the highest and most stable IQ, followed by Brunei and Malaysia. Average NIC is highest in Singapore (0.78) and Malaysia (0.54) and lowest in Cambodia (0.22).
Descriptive statistics of variables
| Country | GEG | IQ | NIC | IQ*NIC | FD | TR | GVE |
|---|---|---|---|---|---|---|---|
| Brunei | |||||||
| Min | 23.257 | 0.362 | 0.271 | 0.132 | 0.465 | 0.810 | 0.169 |
| Max | 23.376 | 1.247 | 0.636 | 0.793 | 0.935 | 1.471 | 0.295 |
| Mean | 23.314 | 0.712 | 0.478 | 0.364 | 0.703 | 0.995 | 0.227 |
| Std. Dev. | 0.028 | 0.282 | 0.119 | 0.212 | 0.137 | 0.192 | 0.033 |
| Cambodia | |||||||
| Min | 22.744 | −1.131 | 0.065 | −0.425 | 0.128 | 1.022 | 0.048 |
| Max | 24.321 | −0.895 | 0.403 | −0.058 | 1.112 | 1.461 | 0.065 |
| Mean | 23.630 | −1.031 | 0.215 | −0.225 | 0.478 | 1.236 | 0.056 |
| Std. Dev. | 0.504 | 0.081 | 0.105 | 0.114 | 0.322 | 0.115 | 0.004 |
| Indonesia | |||||||
| Min | 26.711 | −1.035 | 0.187 | −0.219 | 0.360 | 0.329 | 0.065 |
| Max | 27.772 | −0.224 | 0.588 | −0.104 | 0.538 | 0.714 | 0.097 |
| Mean | 27.272 | −0.576 | 0.352 | −0.173 | 0.421 | 0.498 | 0.086 |
| Std. Dev. | 0.342 | 0.254 | 0.132 | 0.031 | 0.045 | 0.102 | 0.009 |
| Malaysia | |||||||
| Min | 25.739 | 0.068 | 0.375 | 0.034 | 1.190 | 1.167 | 0.101 |
| Max | 26.712 | 0.511 | 0.652 | 0.290 | 1.400 | 2.204 | 0.138 |
| Mean | 26.241 | 0.319 | 0.538 | 0.171 | 1.299 | 1.617 | 0.123 |
| Std. Dev. | 0.312 | 0.112 | 0.087 | 0.065 | 0.064 | 0.330 | 0.008 |
| Singapore | |||||||
| Min | 25.687 | 2.005 | 0.603 | 1.236 | 1.031 | 3.032 | 0.088 |
| Max | 26.698 | 2.157 | 0.981 | 2.050 | 1.484 | 4.373 | 0.122 |
| Mean | 26.258 | 2.061 | 0.778 | 1.605 | 1.235 | 3.595 | 0.102 |
| Std. Dev. | 0.340 | 0.041 | 0.124 | 0.255 | 0.141 | 0.368 | 0.008 |
| Thailand | |||||||
| Min | 26.161 | −0.420 | 0.310 | −0.258 | 1.003 | 0.978 | 0.129 |
| Max | 26.861 | −0.079 | 0.706 | −0.024 | 1.486 | 1.404 | 0.182 |
| Mean | 26.594 | −0.280 | 0.525 | −0.157 | 1.205 | 1.251 | 0.155 |
| Std. Dev. | 0.223 | 0.103 | 0.130 | 0.079 | 0.141 | 0.102 | 0.016 |
| Vietnam | |||||||
| Min | 25.331 | −0.670 | 0.174 | −0.337 | 0.446 | 1.114 | 0.054 |
| Max | 26.638 | −0.234 | 0.644 | −0.084 | 1.461 | 1.866 | 0.109 |
| Mean | 26.002 | −0.465 | 0.393 | −0.172 | 0.979 | 1.424 | 0.082 |
| Std. Dev. | 0.405 | 0.116 | 0.150 | 0.060 | 0.303 | 0.220 | 0.020 |
Note(s):GEG denotes green economic growth; IQ represents institutional quality; NIC refers to national intellectual capital; IQ*NIC is the interaction term between institutional quality and national intellectual capital; FD denotes financial development; TR indicates trade openness, and GVE refers to government expenditure on education
4.2 Stationarity tests
We conduct preliminary unit root testing before the empirical analysis to ascertain whether the variables are integrated at the level or in first differences. Specifically, we apply the Augmented Dickey–Fuller test, the Phillips–Perron test and structural break procedures as described by Breitung and Franses (1998). The results reported in Table 3 indicate that all variables are stationary at the first difference.
Results of stationarity tests
| Country | Stationarity | GEG | IQ | NIC | FD | TR | GVE |
|---|---|---|---|---|---|---|---|
| Brunei | |||||||
| Augmented-Dickey-Fuller | In level | −4.277*** | −0.589 | −1.565 | −2.997** | −1.061 | −2.634* |
| In the first difference | −3.330** | −2.964** | −2.866** | −3.919*** | −2.675* | −3.652*** | |
| Phillip-Perron | In levels | −2.894** | −0.627 | −1.612 | −2.095 | −0.792 | −2.340 |
| In the first difference | −3.728** | −4.523*** | −5.100*** | −3.381*** | −3.719*** | −5.707*** | |
| Structural breaks | In levels | −4.882** | −3.077 | −4.137* | −4.411 | −3.193 | −3.487 |
| In the first difference | −4.899** | −5.467*** | −5.726*** | −4.705* | −4.824** | −6.610*** | |
| Cambodia | |||||||
| Augmented-Dickey-Fuller | In level | −1.994 | −2.716* | 1.234 | −0.940 | −2.722* | −2.381 |
| In the first difference | −2.668* | −3.330** | −4.314*** | −2.697* | −2.915** | −3.407** | |
| Phillip-Perron | In levels | −2.358 | −2.350 | 1.292 | 2.324 | −2.341 | −2.295 |
| In the first difference | −2.687* | −4.325*** | −8.737*** | −8.844*** | −4.067*** | −4.505*** | |
| Structural breaks | In levels | −2.336 | −3.052 | −5.673*** | −2.684 | −5.285** | −2.889 |
| In the first difference | −4.814** | −5.043** | −8.464*** | −6.487*** | −4.841* | −5.382*** | |
| Indonesia | |||||||
| Augmented-Dickey-Fuller | In level | −1.402 | −0.743 | 1.569 | −2.348 | −2.322 | −2.311 |
| In the first difference | −3.281** | −4.629*** | −3.127** | −3.773*** | −6.612*** | −3.371** | |
| Phillip-Perron | In levels | −1.285 | −0.636 | 2.129 | −1.553 | −2.219 | −2.302 |
| In the first difference | −3.274** | −4.436*** | −4.612*** | −3.391** | −4.836*** | −4.324*** | |
| Structural breaks | In levels | −2.618 | −4.177 | −3.583 | −3.346 | −6.244*** | −1.396 |
| In the first difference | −4.652* | −4.937** | −6.968*** | −5.689*** | −7.145*** | −5.544*** | |
| Malaysia | |||||||
| Augmented-Dickey-Fuller | In level | −0.940 | −3.013** | −2.046 | −1.984 | −1.064 | −2.531 |
| In the first difference | −4.972*** | −3.933*** | −3.678*** | −3.353** | −3.460*** | −3.825*** | |
| Phillip-Perron | In levels | −0.662 | −2.656* | −1.988 | −1.974 | −1.634 | −3.384** |
| In the first difference | −5.025*** | −4.489*** | −3.840*** | −4.718*** | −3.960*** | −4.819*** | |
| Structural breaks | In levels | −3.571 | −4.156 | −4.388* | −2.991 | −2.802 | −5.143** |
| In the first difference | −5.585*** | −4.747* | −4.405* | −6.269*** | −4.764* | −4.751* | |
| Singapore | |||||||
| Augmented-Dickey-Fuller | In level | −2.113 | −2.013 | −0.296 | −0.595 | −0.896 | −2.748* |
| In the first difference | −4.536*** | −3.674*** | −3.817*** | −5.424*** | −3.263** | −4.844*** | |
| Phillip-Perron | In levels | −1.482 | −3.316** | −0.310 | −1.130 | −1.282 | −2.468 |
| In the first difference | −4.554*** | −7.639*** | −5.353*** | −5.269*** | −5.963*** | −5.472*** | |
| Structural breaks | In levels | −2.365 | −4.962** | −3.131 | −4.077 | −3.656 | −4.191 |
| In the first difference | −4.842** | −8.480*** | −5.338*** | −7.982*** | −7.243*** | −4.597* | |
| Thailand | |||||||
| Augmented-Dickey-Fuller | In level | −2.873* | −2.309 | −0.989 | −0.847 | −2.626* | −1.425 |
| In the first difference | −3.486*** | −2.954** | −3.529*** | −2.618* | −4.677*** | −2.936** | |
| Phillip-Perron | In levels | −3.086** | −2.102 | −1.159 | −0.777 | −2.412 | −1.156 |
| In the first difference | −3.491*** | −7.304*** | −5.299*** | −4.766*** | −4.636*** | −3.292** | |
| Structural breaks | In levels | −2.447 | −4.987** | −3.009 | −2.925 | −3.603 | −4.684* |
| In the first difference | −5.085** | −4.904** | −5.678*** | −5.263** | −5.080** | −4.848** | |
| Vietnam | |||||||
| Augmented-Dickey-Fuller | In level | −2.681* | −1.767 | −0.871 | −3.410** | −3.266** | −1.681 |
| In the first difference | −5.710*** | −3.875*** | −3.985** | −5.300*** | −5.820*** | −3.160** | |
| Phillip-Perron | In levels | −2.284 | −2.143 | −0.862 | −2.701* | −2.613* | −1.666 |
| In the first difference | −2.722* | −5.301*** | −2.974** | −2.906** | −3.248** | −4.041*** | |
| Structural breaks | In levels | −2.680* | −5.506*** | −3.205 | −5.078** | −5.260** | −4.317 |
| In the first difference | −5.708*** | −6.027*** | −4.554** | −5.893*** | −7.439*** | −6.236*** |
*, ** and *** significance at 10, 5 and 1% level, respectively.
GEG denotes green economic growth; IQ represents institutional quality; NIC refers to national intellectual capital; IQ*NIC is the interaction term between institutional quality and national intellectual capital; FD denotes financial development; TR indicates trade openness, and GVE refers to government expenditure on education
4.3 Empirical results on the moderating effect of institutional quality in the relationship between national intellectual capital and green economic growth
Table 4 indicates a clear but heterogeneous institutional moderation of the NIC–green economic growth relationship across ASEAN. In the long run, national intellectual capital is positively associated with green economic growth. It is statistically significant in Indonesia, Thailand and Vietnam, which is consistent with the view that knowledge stocks and intangible capabilities support greener growth trajectories (Ma et al., 2023; Wang et al., 2022). The interaction term between institutional quality and national intellectual capital is positive and significant in Brunei, Thailand and Vietnam, suggesting that stronger governance amplifies the green-growth payoff from national intellectual capital in these economies. Indonesia, however, exhibits a small but significantly negative interaction, suggesting a modest attenuation of the marginal return to national intellectual capital at prevailing institutional conditions. In Malaysia, Singapore and Cambodia, the interaction term is not statistically different from zero in the baseline specification. These results are consistent with evidence that institutional quality conditions the conversion of knowledge assets into green outcomes and that governance moderates the national-intellectual-capital channel in Asia–Pacific settings (Degbedji et al., 2024; Le et al., 2025).
Empirical results on the moderating effect of institutional quality in the relationship between national intellectual capital and green economic growth in the short and long term
| Variables | Brunei | Cambodia | Indonesia | Malaysia | Singapore | Thailand | Vietnam |
|---|---|---|---|---|---|---|---|
| Long-run coefficients | |||||||
| IQ | −0.275 | −0.476 | −0.001 | −0.171 | −34.814 | −3.705 | −1.391** |
| NIC | −0.477 | 5.452 | 2.470** | 1.112 | −92.093 | 5.630* | 1.239** |
| IQ*NIC | 0.457* | −5.238 | −0.040* | 2.621 | 45.317 | 7.482* | 2.215** |
| FD | 0.210 | −2.489 | −3.669 | −1.019 | 2.005 | 1.509 | 0.530** |
| TR | −0.018 | 1.057 | 0.724 | −0.342 | 0.735 | 0.518 | 0.599** |
| GVE | −1.276* | −23.199* | −2.695 | 1.914 | −15.118 | −15.579 | 9.576*** |
| ECM (-1) | −0.769** | −0.120 | −0.140* | −0.268 | −0.074 | −0.089* | −1.185*** |
| Short-run coefficients | |||||||
| D(IQ) | −0.671** | 0.057 | −0.001 | −0.315 | −2.577** | 0.332 | −0.805 |
| D(NIC) | −1.154* | −0.025 | 0.346 | 0.298 | −6.817** | −0.504 | −1.232 |
| D(IQ*NIC) | 1.232** | −0.629 | −0.005 | 0.702 | 3.549** | −0.671 | 2.518** |
| D(FD) | 0.161 | −0.299*** | −0.514*** | −0.273 | −0.237** | −0.312*** | 0.628*** |
| D(TR) | −0.014 | 0.127 | 0.101 | 0.017 | 0.054** | 0.008 | 0.150 |
| D(GVE) | −0.714 | −2.788 | −0.377 | 0.513 | −1.119 | −1.005 | 8.301*** |
| C | 18.272** | 2.830 | 3.936 | 7.330 | 6.958** | −2.087 | 27.378*** |
| R-Squared | 0.6478 | 0.735 | 0.745 | 0.404 | 0.843 | 0.900 | 0.909 |
| Adj R-squared | 0.2956 | 0.583 | 0.626 | 0.063 | 0.735 | 0.818 | 0.891 |
| Durbin Watson | 2.376 | 2.909 | 2.664 | 1.967 | 1.813 | 2.561 | 2.457 |
*, ** and *** significance at 10, 5 and 1% level, respectively.
GEG denotes green economic growth; IQ represents institutional quality; NIC refers to national intellectual capital; IQ*NIC is the interaction term between institutional quality and national intellectual capital; FD denotes financial development; TR indicates trade openness, and GVE refers to government expenditure on education
The long-run coefficients on institutional quality also vary across countries. Vietnam shows a significantly negative main effect of institutional quality, alongside positive coefficients for national intellectual capital and the interaction term, suggesting that governance improvements may entail transitional costs but strengthen the effectiveness of national intellectual capital when both improve together. Coefficients on government education spending and other controls also differ across countries, indicating that policy mixes are context-specific. Financial development and trade openness are positive and significant in Vietnam, consistent with arguments that financial deepening and openness facilitate green investment and technology diffusion (Jiakui et al., 2023; Ma et al., 2023), whereas their long-run roles are weaker elsewhere in the baseline. Finally, significant negative error-correction terms in Brunei, Indonesia, Thailand and Vietnam support convergence to a stable long-run equilibrium, with particularly rapid adjustment in Vietnam.
4.4 Diagnostic tests
We implement a standard set of post-estimation diagnostics to evaluate residual behavior and model stability. Consistent with established practice (Hyun et al., 2010), we apply the Breusch–Pagan–Godfrey test for heteroskedasticity and the Breusch–Godfrey LM test for serial correlation. Overall, the diagnostic results in Table 5 indicate that the specifications are well behaved for most economies, supporting the reliability of the estimated long- and short-run relationships. Cambodia fails the Ramsey RESET test, and Singapore fails the Breusch–Pagan/Cook–Weisberg test, and both countries are therefore excluded from the subsequent analysis.
Model diagnostics
| Country | White’s test | Ramsey Reset test | Breusch-Pagan/Cook-Weisberg test | Breusch-Godfrey LM test | LM test (ARCH) |
|---|---|---|---|---|---|
| Brunei | 0.401 | 0.306 | 0.294 | 0.145 | 0.506 |
| Cambodia | 0.401 | 0.015 | 0.139 | 0.146 | 0.801 |
| Indonesia | 0.401 | 0.110 | 0.337 | 0.109 | 0.338 |
| Malaysia | 0.401 | 0.716 | 0.208 | 0.294 | 0.868 |
| Singapore | 0.401 | 0.497 | 0.080 | 0.334 | 0.462 |
| Thailand | 0.401 | 0.923 | 0.368 | 0.138 | 0.574 |
| Vietnam | 0.401 | 0.158 | 0.624 | 0.137 | 0.736 |
4.5 Marginal effects of institutional quality on the relationship between national intellectual capital and green economic growth
Next, we quantify how the long-run effect of national intellectual capital varies across institutional settings. Based on the results in Tables 4 and 5, we focus on the marginal effects of institutional quality on the relationship between national intellectual capital and green economic growth across four countries, including Brunei, Indonesia, Thailand and Vietnam. The results are shown in Table 6 and Figure 2. In Brunei, the effect is negative at low and mean IQ but turns positive at high IQ, with an implied threshold within the support at about 1.04. In Indonesia, the effect remains positive throughout but declines slightly as IQ increases, consistent with the small negative interaction. In Thailand, the effect is strongly positive and rises monotonically with IQ, indicating that institutional upgrading consistently amplifies NIC’s contribution. In Vietnam, the effect switches from negative to positive as IQ improves, with a threshold around −0.58, implying that moderate governance improvements are sufficient to make NIC growth-enhancing.
Marginal effects of institutional quality on the relationship between national intellectual capital and green economic growth
| Country | Institutional quality | Marginal effect |
|---|---|---|
| Brunei | ||
| Min | 0.362 | −0.311 |
| Mean | 0.712 | −0.151 |
| Max | 1.247 | 0.093 |
| Indonesia | ||
| Min | −1.035 | 2.512 |
| Mean | −0.576 | 2.493 |
| Max | −0.224 | 2.479 |
| Thailand | ||
| Min | −0.420 | 2.482 |
| Mean | −0.280 | 3.535 |
| Max | −0.079 | 5.038 |
| Vietnam | ||
| Min | −0.670 | −0.184 |
| Mean | −0.465 | 0.249 |
| Max | −0.234 | 0.742 |
 The chart has four panels for Brunei, Indonesia, Thailand, and Vietnam. Each panel plots I Q on the x-axis and Marginal Effect of N I C, long-run, on the y-axis. Each panel has a solid marginal-effect line, point estimates at minimum, mean, and maximum I Q, vertical 95 per cent confidence intervals, and a horizontal reference line at 0. In the Brunei panel, the x-axis ranges from about 0.4 to 1.2, and the y-axis ranges from about minus 1.0 to 1.0. The marginal effect rises from about minus 0.3 at the minimum I Q point, to about minus 0.15 at the mean I Q point, and to about 0.1 at the maximum I Q point. The confidence interval at the minimum extends from about minus 0.7 to 0.1. At the mean, it extends from about minus 0.5 to 0.2. At the maximum, it extends from about minus 0.5 to 0.7. In the Indonesia panel, the x-axis ranges from about minus 1.0 to minus 0.2, and the y-axis ranges from 0 to 5. The marginal effect stays close to 2.5 at the minimum, mean, and maximum I Q points. The confidence interval at the minimum extends from about 0.2 to 4.8. At the mean, it extends from about 1.2 to 3.8. At the maximum, it extends from about 1.0 to 4.0. In the Thailand panel, the x-axis ranges from about minus 0.4 to minus 0.1, and the y-axis ranges from about minus 5 to 15. The marginal effect rises from about 2.5 at the minimum I Q point, to about 3.5 at the mean I Q point, and to about 5.0 at the maximum I Q point. The confidence interval at the minimum extends from about minus 0.7 to 5.7. At the mean, it extends from about minus 0.4 to 7.6. At the maximum, it extends from about minus 1.5 to 11.5. In the Vietnam panel, the x-axis ranges from about minus 0.7 to minus 0.2, and the y-axis ranges from about minus 0.5 to 1.5. The marginal effect rises from about minus 0.2 at the minimum I Q point, to about 0.25 at the mean I Q point, and to about 0.75 at the maximum I Q point. The confidence interval at the minimum extends from about minus 0.5 to 0.15. At the mean, it extends from about 0.0 to 0.5. At the maximum, it extends from about 0.15 to 1.35.
Marginal effects of institutional quality on the relationship between national intellectual capital and green economic growth
Source: Authors’ own work
The chart has four panels for Brunei, Indonesia, Thailand, and Vietnam. Each panel plots I Q on the x-axis and Marginal Effect of N I C, long-run, on the y-axis. Each panel has a solid marginal-effect line, point estimates at minimum, mean, and maximum I Q, vertical 95 per cent confidence intervals, and a horizontal reference line at 0. In the Brunei panel, the x-axis ranges from about 0.4 to 1.2, and the y-axis ranges from about minus 1.0 to 1.0. The marginal effect rises from about minus 0.3 at the minimum I Q point, to about minus 0.15 at the mean I Q point, and to about 0.1 at the maximum I Q point. The confidence interval at the minimum extends from about minus 0.7 to 0.1. At the mean, it extends from about minus 0.5 to 0.2. At the maximum, it extends from about minus 0.5 to 0.7. In the Indonesia panel, the x-axis ranges from about minus 1.0 to minus 0.2, and the y-axis ranges from 0 to 5. The marginal effect stays close to 2.5 at the minimum, mean, and maximum I Q points. The confidence interval at the minimum extends from about 0.2 to 4.8. At the mean, it extends from about 1.2 to 3.8. At the maximum, it extends from about 1.0 to 4.0. In the Thailand panel, the x-axis ranges from about minus 0.4 to minus 0.1, and the y-axis ranges from about minus 5 to 15. The marginal effect rises from about 2.5 at the minimum I Q point, to about 3.5 at the mean I Q point, and to about 5.0 at the maximum I Q point. The confidence interval at the minimum extends from about minus 0.7 to 5.7. At the mean, it extends from about minus 0.4 to 7.6. At the maximum, it extends from about minus 1.5 to 11.5. In the Vietnam panel, the x-axis ranges from about minus 0.7 to minus 0.2, and the y-axis ranges from about minus 0.5 to 1.5. The marginal effect rises from about minus 0.2 at the minimum I Q point, to about 0.25 at the mean I Q point, and to about 0.75 at the maximum I Q point. The confidence interval at the minimum extends from about minus 0.5 to 0.15. At the mean, it extends from about 0.0 to 0.5. At the maximum, it extends from about 0.15 to 1.35.Marginal effects of institutional quality on the relationship between national intellectual capital and green economic growth
Source: Authors’ own work
4.6 Discussions
This study examines the marginal impact of institutional quality on the effect of national intellectual capital on green economic growth in ASEAN economies. The results reveal that the marginal effect of institutional quality on the relationship between national intellectual capital and green economic growth varies across countries. These results clarify the interaction between intangible resources and governance structures and illustrate how this interaction shapes the trajectory of sustainable development.
For Thailand and Vietnam, the long-run interaction term (IQ×NIC) is positive and significant, and the marginal-effects table shows a monotonic increase in NIC payoff as IQ rises. In Thailand, NIC already delivers sizable green-growth gains at low IQ, and these gains expand at higher IQ, suggesting strong complementarity between innovation-related capabilities and the institutional environment. Vietnam displays a similar pattern, with the added nuance that at very low IQ levels, the NIC effect can be weak or negative, but becomes decisively positive once IQ crosses a threshold within the observed range. This result is economically important because it implies that intangible assets alone are insufficient unless governance quality reaches a level that supports coordination, implementation and diffusion. A comparable complementarity between governance quality and green capability formation is also reported in recent evidence on green innovation and green productivity, where stronger institutions improve the ability of economies to direct knowledge and finance toward environmentally productive activities (Le et al., 2025; Ma et al., 2023; Jiakui et al., 2023).
Brunei displays a more moderate but still meaningful complementarity. The marginal effect of national intellectual capital is negative at low institutional quality, remains slightly negative around the mean and turns positive only at the upper end of the institutional range. The economic significance of that result lies in the location of the threshold within the observed support. A modest institutional improvement is therefore sufficient to change the role of national intellectual capital from weakly constraining to positively supporting green growth. Such a pattern suggests that Brunei does not lack knowledge-based capabilities as much as it lacks a sufficiently supportive governance environment for converting those capabilities into greener production. Similar evidence from developing economies shows that institutional upgrading raises the returns to strategic resources by reducing uncertainty and improving implementation capacity (Seleim and Bontis, 2013; Degbedji et al., 2024).
Indonesia presents a different mechanism. The marginal effect of national intellectual capital remains large and positive across the full institutional range, but the effect declines slightly as institutional quality improves. National intellectual capital, therefore, remains a robust contributor to green growth at all observed institutional levels. The negative interaction should not be read as evidence that institutions weaken green growth. A more plausible interpretation is that stronger formal institutions reduce the extent to which national intellectual capital must compensate for governance deficiencies (Liao and Wu, 2025). Under that reading, Indonesia continues to benefit strongly from the accumulation of knowledge-based capabilities, while institutional upgrading improves the broader environment for scaling projects and mobilizing finance. Such a mixed pattern of complementarity and substitutability is consistent with evidence that governance and innovation capacity can jointly contribute to greener development, although the relative weight of each factor varies across national structures and development stages (Wang et al., 2022; Bui and Doan, 2025; Ma et al., 2023).
Across countries, controls behave in ways that corroborate known channels. Where significant, most clearly in Vietnam, financial development and openness support green growth, in line with evidence that deeper finance and trade integration facilitate the diffusion and scaling of green technologies (Ma et al., 2023; Jiakui et al., 2023). The negative or insignificant long-run roles elsewhere may reflect transitional costs, composition effects or limited depth/volatility in annual series, which ARDL can accommodate but not fully resolve when the underlying structural channel is weak (Sohag et al., 2019).
5. Concluding remarks and policy recommendations
Sustaining growth under environmental constraints has become a central challenge for ASEAN economies. Our empirical results show that the contribution of national intellectual capital to green economic growth is not fixed, but depends on institutional quality and varies across countries. Thailand and Vietnam display strong complementarity between institutional quality and national intellectual capital, Brunei shows an institutional threshold at which the contribution of national intellectual capital turns positive, Indonesia maintains positive returns across the full institutional range despite slight attenuation, and Malaysia, Singapore and Cambodia exhibit no statistically clear long-run moderation in the baseline specification. Such evidence refines earlier studies that treat knowledge assets or governance as separate drivers. Instead, it suggests that greener growth emerges from the interaction between intangible capabilities and institutional conditions rather than from either factor alone.
We make three contributions to theory and evidence on how institutional quality and national intellectual capital shape green economic growth in ASEAN. First, we extend green growth theory by modeling national intellectual capital and institutional quality in a long-run interaction framework and showing, using an ARDL cointegration test, that the effect of national intellectual capital on green growth is conditional on the institutional environment. Unlike studies that treat knowledge stocks or governance as independent drivers (Lin and Edvinsson, 2011; Danta and Rath, 2024), our findings indicate that the productivity of national intellectual capital varies with institutional quality, which helps explain why countries with similar intangible endowments can experience markedly different green growth payoffs. Second, we provide a practical template for measuring and interpreting interaction effects in time-series settings. Using country-specific ARDL estimates, we compute long-run marginal effects of national intellectual capital at substantively meaningful institutional levels, including the minimum, mean and maximum, and identify institutional thresholds where the marginal effect changes sign. This approach bridges estimated interaction coefficients and policy-relevant quantities, aligns with best practice for multiplicative models and complements emerging Asia–Pacific evidence on governance-conditioned effects of national intellectual capital by adding a long-run structural interpretation through cointegration (Le et al., 2025). Third, we document substantial within-ASEAN heterogeneity. We find strong positive moderation in Thailand and Vietnam, an institutional “unlocking” effect in Brunei where the marginal impact turns positive at higher institutional quality, slight negative moderation with still-positive returns in Indonesia and statistically neutral moderation in Malaysia, Singapore and Cambodia. These results sharpen regional inferences from multi-country studies (Ma et al., 2023; Jiakui et al., 2023) and suggest that the national-intellectual-capital–green-growth link is complementary to institutions in some contexts but weakly substitutable in others, offering a unified moderator-based explanation for previously mixed findings.
This study yields several important policy implications for ASEAN countries seeking to achieve green economic transformation. Thailand and Vietnam provide the clearest evidence of complementarity between institutional quality and national intellectual capital. In both cases, the interaction term is positive and statistically significant, and the marginal contribution of national intellectual capital becomes stronger as institutional quality rises. A practical implication for both countries is that improvements in regulatory quality, rule of law, contract enforcement and implementation capacity should proceed together with investment in tertiary and technical education, research and development support, intellectual property services and digital public infrastructure. Vietnam deserves particular attention because the estimated institutional threshold falls within the observed range, indicating that once institutional quality exceeds that benchmark, the contribution of national intellectual capital becomes distinctly positive. Brunei displays a weaker but still meaningful form of complementarity. The long-run marginal effect of national intellectual capital is slightly negative when institutional quality is low or moderate. However, it turns positive once institutional quality reaches the upper end of the observed range. Such a pattern indicates that incremental improvements in governance can unlock the growth-enhancing role of national intellectual capital. A reasonable near-term priority for Brunei is therefore to treat the estimated threshold as a practical governance target. Indonesia presents a different pattern. The marginal effect of national intellectual capital remains positive and statistically significant across the full distribution of institutional quality, though its size declines slightly as institutions improve. The economic implication is that continued investment in human capital, research networks, digital infrastructure and intellectual property services remains justified, because the green growth returns to national intellectual capital stay robust across realistic institutional conditions.
Practical implications extend beyond public policy. For firms and industry practitioners, the results imply that the commercial value of knowledge-based capabilities in green sectors depends on the surrounding governance environment. Regulatory predictability, implementation capacity and contract credibility affect whether investments in innovation, intellectual property, digital systems and organizational learning can be scaled into a commercially viable green activity. For universities, vocational institutions and training providers, the results underscore that human capital formation is not only a social objective but also a productive input into greener structural change. Curricula, research partnerships and industry-oriented technical training, therefore, become part of the real-world mechanism through which national intellectual capital supports green growth.
This study has several limitations that should be acknowledged when interpreting the results. First, the data environment constrains inference. We use an annual series for seven ASEAN economies from 2000 to 2023, yielding relatively short time spans per country for time-series econometrics. In the ARDL setting, small-T samples reduce the power of unit-root/cointegration diagnostics and can make long-run coefficient estimates and their covariances less precise, especially for interaction terms and when structural breaks may be present. Second, our empirical design estimates separate ARDL models by country, highlighting heterogeneity but not cross-country dependence or spatial interactions across ASEAN. Ignoring these channels can bias standard errors and obscure common dynamics.
