This study maps and explains the stages of information and communication technology (ICT) implementation in Indonesian nanostores to guide their digital transformation.
A sequential explanatory mixed-methods design was employed. A survey of 300 nanostores was analyzed using a three-dimensional Retail Process Classification and cluster analysis. Six purposive case studies with semi-structured interviews were used to further examine governance behind the digital transformation.
Five ICT implementation stages were identified: Digital Laggards, Supplier-Driven Digital Adopters, Balanced Digital Transitioners, Advancing Digital Integrators and Digital Innovators. Three strategic transition pathways have emerged: supplier-driven, balanced and adaptive exploration. Key components of a governance system include transformation orientation, owner-centred decision-making, informal networks and institutional support and iterative decision-making cycles.
The paper makes two linked contributions. It empirically segments nanostores by digital maturity, mapping process-level ICT indicators to clear stages and transition pathways. It also proposes a layered governance model as a context for nanostores decision-making in digital transformation.
1. Introduction
Nanostores face an increasingly urgent need for transformation amid ongoing industrial digitalization and shifting consumer behavior. In recent years, digitalization has transformed how consumers engage with products and services (Rangaswamy, Nawaz, & Changzhuang, 2022). Consumers have gradually shifted their purchasing habits to digital channels, jeopardizing the long-term performance of nanostores. It is widely recognized that ICT improves organizational performance through four strategic roles: automation, information enhancement, information reduction and transformation (Vial, 2019). Consequently, nanostores must adapt their operations by implementing ICT solutions to remain relevant and competitive in the marketplace.
Nanostores play a vital role in developing economies as both dominant retail channels and drivers of social inclusion. They account for about 50% of the consumer-packaged goods (CPG) market in Latin America, and over 85% in sub-Saharan Africa and South Asia, representing major growth potential for CPG manufacturers (Escamilla, Fransoo, & Tang, 2021). Specifically, in Indonesia, nanostores cover 77.25% of food retail sales with over 3.9 million stores (USDA, 2023). Beyond their economic contribution, nanostores support low-income communities by offering daily necessities, flexible purchase quantities and informal credit (Coen, Ross, & Turner, 2008). These services help vulnerable consumers manage their limited resources and ensure access to essential goods across all socioeconomic groups.
Despite their economic significance, nanostores exhibit distinct characteristics in ICT adoption compared to larger enterprises. Their operations, often grounded in personal relationships and trust, can pose challenges to integrating standardized digital solutions (Candelo, Casalegno, & Civera, 2022). Distrust and doubt toward external technology providers may further impede ICT uptake (Chawla, Verma, & Mittal, 2025; Guo, Lu, Villena, Vogel, & Heim, 2022). Additionally, the environmental context and owners’ individual experience play crucial roles in shaping the ICT implementation journey (Peltier, Zhao, & Schibrowsky, 2012). Some nanostores perceive no immediate need for digital tools in the absence of explicit consumer demand (Aithal, Choudhary, Maurya, Pradhan, & Sarkar, 2023).
Nanostore technology readiness varies according to the capabilities of the owners and the nature of their business activities. Technology readiness in nanostores is important because it influences their ability to adopt and benefit from digital technologies (Isharyani, Sopha, Wibisono, & Tjahjono, 2024). The incremental approach enables nanostores to progressively acclimate to new technologies in alignment with their needs and resources. In the early stages of implementation, some nanostores prioritize operational efficiency, whereas advanced stages may encompass enhanced customer service offerings (Bollweg, Lackes, Siepermann, & Weber, 2020). Such a strategy not only minimizes implementation risks but also ensures that digital transformation advances in tandem with the growth trajectory of nanostores.
In this context, strategic planning has emerged as an essential prerequisite for successful digital transformation. Pursuing digital innovation without a well-defined strategy can lead to wasted resources and ineffective implementation. As a small-scale business, digital transformation in nanostores should begin with a simple but structured planning framework (Mazzarol, Reboud, & Soutar, 2009). A robust strategic plan incorporates a timing mechanism and an innovation roadmap to enable nanostores to adapt to market dynamics and technological advancements (Pantano, 2014). Through meticulous planning, nanostores can harness the potential of digitalization to bolster competitiveness and achieve sustainable growth.
Mapping strategic planning for nanostores represents an initiative to support nanostores’ digital transformation. An existing study underscored the need for further research on digital transformation guidelines and best practices, particularly regarding their implementation across various industries (Van Veldhoven & Vanthienen, 2023). Bollweg et al. (2020) observed that nanostores’ digitalization typically begins with administrative activities, followed by marketing, sales and service functions, yet a comprehensive navigation model for ICT implementation remains underexplored. Therefore, a structured mapping process, starting with typology identification as a phase entry point and culminating in navigation pathway design, is required.
Accordingly, this study analyzes the landscape of digitalization in Indonesia, a developing country where the retail industry is largely dominated by nanostores, locally known as warung. These are traditional retail businesses characterized by low entry barriers, family or individually owned operations, and limited product assortments (Fransoo, Blanco, & Argueta, 2017). Like tienda in Latin America, sari-sari in the Philippines, and kirana in India, warung in Indonesia maintain and rely on strong reciprocal relationships with their social and community environments (Escamilla et al., 2021). Therefore, this study aims to delineate the stages of ICT implementation, explore the navigation pathways and identify the implementation governance in Indonesian nanostores, while providing a transferable model applicable to retail contexts in other emerging economies.
2. Literature review
2.1 ICT implementation navigation
ICT implementation navigation refers to the process of aligning ICT planning with contextual and operational goals to enable effective organizational transformation. Fleming and Sorenson (2003) described it as navigating the ICT landscape through strategic mapping, in which a strategy involves planning implementation in response to technological changes or organizational demands. The Strategic Alignment Model (SAM) by Henderson and Venkatraman (1994) outlined four key domains in ICT planning: business strategy, technology strategy, business operations and technology operations. Alignment across these domains occurs through functional integration, which may take place at both the strategic (business and technology strategy) and operational (business and technology operations) levels.
Recent studies have explored how technology is exploited, leveraged and implemented in the retail industry. Technology exploitation has enabled new business models that reshape interactions and transactions while fostering product and service innovation (Reinartz, Wiegand, & Imschloss, 2019). Omnichannel strategy makes retailers leverage big data and generative artificial intelligence for sustainable performance (Vhatkar et al., 2024). Strategy and technology implementation in these stores is shaped by external pressure and business needs, driving adoption to boost efficiency and performance through innovation and partnerships (Bollweg et al., 2020; Isharyani et al., 2024).
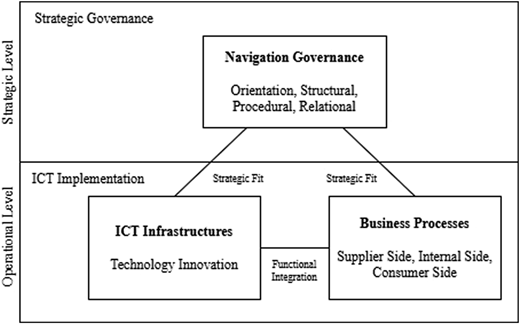
In small enterprises, such as nanostores, strategic-level functional integration is still uncommon. Rather than developing new technology-driven business models, they remain in the implementation phase, using available technologies to meet operational needs or support minor innovations (Isharyani et al., 2024). At the operational level, ICT's alignment with business processes is key to improving performance (Tallon, 2007). Although this requires the identification of core processes, it remains feasible in small business settings. Thus, this study emphasizes process–technology integration as a form of ICT implementation driven by a simple strategic orientation (see Figure 1). The next section outlines its dimensions.
2.2 ICT implementation in nanostores
ICT implementation in nanostores involves the functional integration of business operations and ICT systems at the operational level (Henderson & Venkatraman, 1994). This integration comprises three key dimensions: processes, infrastructure and skills. In practice, the skills dimension often overlaps, as single proprietors typically manage operations without formal technical expertise and depend on external partners (Fransoo et al., 2017; Isharyani et al., 2024). Their tacit skills are applied informally in their daily routines. Consequently, ICT use is selective and task oriented, aligned with specific business needs (Isharyani et al., 2024). Thus, a clearer understanding of ICT implementation can be obtained by focusing on process and infrastructure integration.
The ICT infrastructure and business processes jointly define the scope of ICT implementation in nanostores. ICT infrastructure refers to technological components, such as applications, data systems and network configurations (Henderson & Venkatraman, 1994). ICT infrastructure can be differentiated according to its level of innovation: traditional ICTs and modern ICTs (Holtgrewe, 2014). Modern ICTs, such as the Internet of Things (IoT) and cloud computing, emphasize connectivity and interactivity. Business processes refer to the workflow to carry out primary business activities (Henderson & Venkatraman, 1994). Business processes, within a digital business system, can be categorized into three supply chain dimensions: supplier, internal and consumer sides (Chaffey, Hemphill, & Edmundson-Bird, 2019). Existing studies have shown that nanostores adopt digital technologies differently across these dimensions (Aithal et al., 2023; Bollweg et al., 2020). Thus, the level of technological innovation in activities on the supplier, internal and consumer sides shapes the implementation of technology in nanostores.
ICT implementation is influenced by both business and ICT strategies (Henderson & Venkatraman, 1994). A business-driven approach addresses operational needs by prompting changes in the processes and infrastructure. In contrast, an ICT-driven approach prioritizes innovation with technology adoption followed by process adjustments. Henderson and Venkatraman (1994) conceptualized strategic alignment across three dimensions: scope, competence and governance. In the context of small enterprises, particularly within specific industries such as nanostores, governance emerges as the most salient dimension. This is because of the relatively uniform operational scope and the fact that business competence is largely embedded within governance capabilities (Woldesenbet, Ram, & Jones, 2011). The ICT adaptation is influenced by governance of nanostores based on business needs and readiness (Isharyani et al., 2024).
Governance refers to the mechanism used to develop and manage business and ICT capabilities (Henderson & Venkatraman, 1994). Orientation can be divided into business and ICT strategies. Orientation reflects the motivation behind ICT adoption, whether operational or innovation-driven. Governance capability conceptually considers structural, procedural and relational mechanisms (Peterson, 2004). In small and family run businesses, governance must address ownership structure, decision-making and informal social dynamics (Pindado & Requejo, 2015). The structural component concerns authority distribution in strategic decision-making. Procedural elements refer to the formal workflows that guide ICT strategies. The relational component highlights collaboration and stakeholder involvement in planning. These components are interdependent and collectively influence the direction and success of ICT transformation.
3. Research methodology
3.1 Research design
This study adopted a mixed-methods design to examine the navigation model of ICT implementation. Such designs have been used to develop frameworks for digital payment adoption in nanostores (Thanigan, Reddy, Maity, Sethuraman, & Rajesh, 2025). This study followed two sequential explanatory phases. The first phase employed quantitative methods, whereas the second used qualitative methods. The findings from both phases were integrated to build a comprehensive navigation model. This design was chosen for its ability to capture contextual factors and clarify quantitative results through qualitative insights (Creswell & Creswell, 2018). The quantitative phase employed a survey design approach to capture the empirical pattern of ICT implementation levels and pathways. The qualitative phase used a case study approach to examine governance in ICT implementation. Consequently, it enables a deeper understanding beyond empirical patterns.
3.2 Data collection and analysis
Quantitative data was collected through questionnaires and processed using cluster analysis. Business processes in questionnaires were classified using the Retail Process Classification Framework and grouped into supplier, internal and consumer dimensions. Details and supporting literature appear in the Supplementary Material. Following Dolnicar, Grün, and Leisch (2016), we aimed for 100 observations per feature (N = 300). The targets are nanostores, small traditional independent grocery retailers as described by Fransoo et al. (2017), commonly known as Warung. Between March and April 2024, we collected quota-sampled responses from nanostores across six provinces on Java via online community groups. A total of 309 valid responses were obtained, with at least 25 per province, but only 300 random responses were used. Each process received a score of 0 (no ICT), 1 (traditional ICT), or 2 (modern ICT). Scores were aggregated by dimension and all data were normalized. The analysis followed three steps: Ward's method for determining the cluster count, k-means for assignment and silhouette analysis for validation. Distinct ICT adoption levels and potential digital transformation pathways among nanostores were thus identified.
Qualitative insights were collected through interviews and interpreted using thematic analysis. The case criteria include nanostores that were part of the initial sample and are currently undergoing digital transformation. Insights into digital transformation were obtained by studying organizations actively in transition (Sebastian et al., 2020). A multiple-case design with typical case sampling was used, selecting two cases per typology to enable rich cross-case comparisons. All cases were from the same region to examine governance by typology while minimizing socio-economic bias. We conducted semi-structured interviews with each store owner in November 2024, using a flexible guide that allowed follow-up questions. The interview consisted of three parts: business profiles, current implementation governance and future implementation governance. A hybrid approach in thematic analysis was employed, using theory-driven deductive coding based on the Peterson's governance capabilities to develop the main categories. Subsequently, inductive coding was conducted based on the study's empirical data to uncover governance patterns within each main category (Fereday & Muir-Cochrane, 2006). These findings were then integrated with existing literature and quantitative results.
4. Result
4.1 Cluster analysis
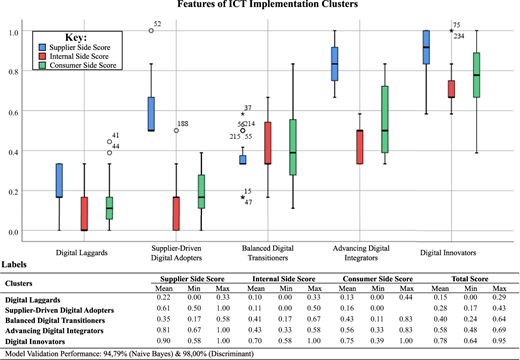
Cluster analysis identified five distinct ICT implementation profiles among the nanostores. The optimal number of clusters was determined by applying the elbow method to the hierarchical clustering. K-means clustering revealed five progressive stages of digital transformation: Digital Laggards, Supplier-Driven Digital Adopters, Balanced Digital Transitioners, Advancing Digital Integrators and Digital Innovators. Each cluster showed varying average ICT adoption levels across supplier, internal and consumer dimensions (see Figure 2). Model validity and robustness were tested using naïve Bayes and discriminant analysis, yielding accuracy scores of 94.79% and 98%, respectively. The scores indicate strong internal consistency and clear separation between feature-based clusters.
Silhouette analysis was used to validate the cluster structure. This method yields the Silhouette Index (SI) and identifies the Neighbor Cluster (Rousseeuw, 1987). The Silhouette Index (SI) assesses how well each point fits its assigned cluster relative to the nearest alternative. The Neighbor Cluster shows the closest alternative group and thus indicates possible migration. The SI for each original-neighbor pair represents the average relative proximity of data points to their neighboring cluster (see Table 1). A positive average SI indicates appropriate clustering, suggesting that nanostores are correctly grouped. In this study, SI values help assess migration potential, which is interpreted as a transition path in digital transformation. Higher SI values imply lower migration potential owing to the greater dissimilarity between clusters. Conversely, the absence of an SI value for a cluster pair suggests no observable migration, making a direct transition unlikely.
The clusters capture relative levels of technology uptake consistent with broader industry development. Notably, the highest cluster, Digital Innovators, should not be interpreted as the final stage of digital transformation, since technologies and practices continue to evolve. As technological innovation continues to advance, nanostores with prior digital exposure may shift their state by adopting new tools and systems in response to emerging opportunities (Bollweg et al., 2020; Candelo et al., 2022). Moreover, none of the nanostores in the sample reached the maximum implementation score, suggesting untapped potential for further innovation. The transition paths identified in this study highlight both the stability and fluidity of digital adoption among nanostores.
The early stages of ICT adoption among nanostores follow a common trajectory, progressing from Digital Laggards to Supplier-Driven Digital Adopters and then to Balanced Digital Transitioners. Digital Laggards show minimal use of digital tools across supplier, internal and consumer functions, a pattern common among many Indonesian nanostores. Supplier-Driven Digital Adopters show improved ICT use, primarily in supplier-related activities. In contrast, Balanced Digital Transitioners adopt technology more evenly across all operational areas, with a proportional focus on administrative and internal functions. While their supplier-side scores are lower than those of Supplier-Driven adopters, their broader investment signals a strategic shift toward comprehensive digitalization. These three clusters represent the initial phases of digital transformation for micro-retailers.
The next clusters represent nanostores with foundational ICT experience. Owners with exploratory, innovation-focused mindsets often drive high implementation levels on the supplier, internal and consumer sides (Wahyudin, Sadhewa, Yuliando, Chen, & Tsai, 2023). Advancing Digital Integrators show significant progress, with broader and more varied adoption across all supply chain components. ICT tools are increasingly being used to connect supplier, internal and consumer operations, reflecting a shift toward systems thinking. Digital Innovators represent the most advanced stage of ICT adoption in this study. These nanostores employ integrated digital solutions across all business functions, indicating a mature digital orientation. They also demonstrate strong ICT investment and consistent application across nearly all operational activities.
4.2 Case study
We studied six nanostores that represent actively three typologies: Supplier-Driven Digital Adopters, Balanced Digital Transitioners and Advancing Digital Integrators. Nanostore 1 (R1) and Nanostore 2 (R2), classified as Supplier-Driven Digital Adopters, have operated since 2000 and 2010, respectively. R1 earns around IDR 6 million monthly, whereas R2 reports revenues around IDR 10 million. Nanostore 3 (R3) and Nanostore 4 (R4) represent Balanced Digital Transitioners. R3, active since 2010, earns approximately IDR 5 million per month. R4 took over operations in 2023, generating approximately IDR 10 million. Nanostore 5 (R5) and Nanostore 6 (R6) fall under Advancing Digital Integrators. R5 has operated since 2019 with monthly earnings of approximately IDR 5 million. R6, established in 2004, earns about IDR 10 million. These six cases reveal governance patterns in the adoption of digital tools (see Table 2). Interview quotes and supporting literature as part of the theme development process can be found in the Supplementary Material.
The analysis identified two main motivations for adopting digital solutions: (1) addressing business needs and (2) keeping up with technological trends. Many nanostores have adopted technologies such as QRIS to meet customer expectations, enabling faster and more convenient transactions. ICT is also seen as a tool for business growth, sales improvement and enhanced security. These findings align with earlier studies highlighting functional motivations such as facilitating online transactions and improving customer service (Delgado-de Miguel, Buil-Lopez Menchero, Esteban-Navarro, & García-Madurga, 2019; Eiriz, Barbosa, & Ferreira, 2019). Simultaneously, some nanostores embraced technology to remain aligned with industry trends, driven by curiosity and openness to digital innovation. This reflects the proactive, innovation-oriented mindset noted in existing studies (Wahyudin et al., 2023).
Within the store's organizational structure, the owner is the primary decision-maker for technology adoption, typically guided by external recommendations. These decisions are often reactive, driven by external pressures such as customer demand or peer influence. Owners with higher digital literacy tend to be more proactive in exploring and adopting new technologies (Peltier et al., 2012; Wahyudin et al., 2023). Informal social networks, such as friends, family and colleagues, also play a key role by serving as trusted sources of information and introducing new digital tools. This result reflects the findings of existing studies on the influence of social ties on technology adoption among micro-enterprises (Aithal et al., 2023; Candelo et al., 2022).
ICT planning in nanostores typically follows a phased process: initiation, evaluation, implementation and post-implementation review. Initiation is usually reactive, influenced by customer or peer suggestions and supported by information from informal networks or service provider promotions (Bhattacharjee, Kumar, Verma, & Maiti, 2024; Candelo et al., 2022). During evaluation, nanostores prioritize ease of use, efficiency and familiarity, while also weighing potential security risks (Isharyani et al., 2024; Thanigan et al., 2025). Technologies perceived as too complex or unnecessary are often delayed or rejected. Implementation is often facilitated by external support that provides technical assistance (Delgado-de Miguel et al., 2019; Seethamraju & Diatha, 2019). Post-implementation, nanostores assess sustainability based on practical benefits such as cost reduction and process simplification (Aithal et al., 2023; Mujianto, Hartoyo, Nurmalina, & Yusuf, 2023). Technologies with unclear value are typically abandoned. This pragmatic approach underscores the importance of relevance and usability in nanostores' digital adoption.
ICT governance in nanostores is heavily influenced by informal social networks and institutional actors. Customer demand is a key driver of digital payment adoption, shaping store owners’ digitalization efforts (Bhattacharjee et al., 2024; Bollweg et al., 2020). Family members, particularly younger generations, often provide technical support, bridging knowledge gaps and assisting in implementation (Aithal et al., 2023). Peer networks among nanostores also enable knowledge sharing and promote engagement in digital initiatives (Candelo et al., 2022). At the institutional level, banks and suppliers act as key enablers. Financial institutions provide digital payment infrastructure (Adhikary, Diatha, Borah, & Sharma, 2021), while suppliers offer user-friendly platforms such as the SRC ordering app (Mujianto et al., 2023). E-commerce platforms also encourage nanostores’ participation in their ecosystems. These dynamics suggest that ICT adoption is governed by a combination of interpersonal relationships and institutional support.
5. Discussion
5.1 Navigation map
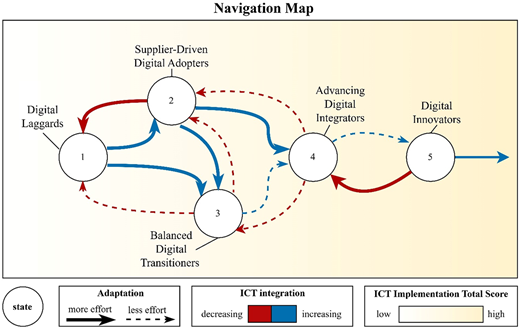
This study introduces an ICT implementation map model that outlines the digital transformation pathways of nanostores (see Figure 3). This map illustrates transitions from a “Current State” to a “Next State” across five strategic positions, each reflecting a different level of digital maturity. Digital Laggards (1) exhibit minimal ICT use and resist change. Supplier-Driven Digital Adopters (2) adopt digital tools mainly through supplier influence. Balanced Digital Transitioners (3) apply ICT across business functions, though integration is still limited. Advancing Digital Integrators (4) embed ICT into operations to enhance efficiency and value creation. At the highest level, Digital Innovators (5) actively drive technological adoption, aligning ICT with strategic goals across the value chain. This model offers a practical framework for understanding how nanostores evolve in their digital journeys.
The directional arrows of the model illustrate the transition dynamics between maturity levels. Solid arrows mark transitions with an above-average SI, indicating greater difficulty. Such transitions typically demand resource investments, cultural shifts and capability development. Dashed arrows represent transitions with below-average SIs, requiring less effort. For instance, moving from Balanced Digital Transitioners to Supplier-Driven Digital Adopters is less demanding than the reverse. Transitioning from supplier-driven to balanced models often requires substantial adjustments. These adjustments may include process redesign, capability-building and governance changes. By contrast, reverting to supplier-focused ICT may indicate misalignment or inadequate internal ICT capabilities remedied through supplier collaboration.
This model shows that nanostores may progress or regress along the digital maturity spectrum. As noted by Priyono, Moin, and Putri (2020), digital transformation does not follow a single linear path but varies based on each organization’s context and needs. Dashed red arrows indicate states in which regression requires less effort. According to Rogers’ diffusion of innovation theory, many nanostores fall into the “Late Majority” or “Laggards” categories. This group is characterized by late adoption and strong resistance to change. Regression may occur because of technological obsolescence or adoption failure.
Technological obsolescence occurs when nanostores fail to implement ICT sustainably, leading to outdated or non-functional systems. According to Rogers’ adoption curve, nanostores often adopt technology only under market pressure and with limited commitment (Bollweg et al., 2020). Their skepticism toward innovation reduces strategic awareness and limits experimentation (Wahyudin et al., 2023). This lack of innovation is largely due to limited resources and capabilities. As a result, nanostores face an “innovation deficit,” where their level of adoption lags significantly behind technological advancements.
Technology adoption failures often result from a mismatch between the technology and the business's operational needs, leading to abandonment. Rogers identifies relative advantage as the strongest predictor of adoption. If nanostores fail to progress beyond the trialability stage, they become susceptible to discontinuity and may revert to traditional practices. This susceptibility increases when the technology's complexity outweighs its perceived benefits. Disenchantment discontinuance can occur in the absence of effective ICT integration within the business model. This phenomenon involves withdrawal from use due to unmet expectations and dissatisfaction, leading to a decline in ICT usage. This is common among nanostores that adopt technology without strategic understanding, merely following trends.
5.2 Strategic pathways
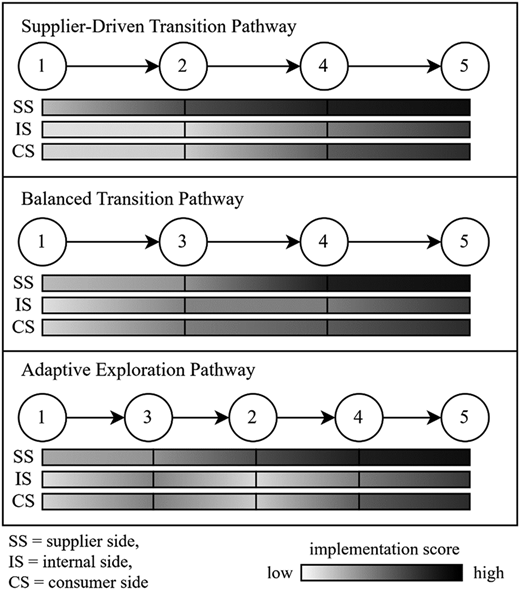
This study proposes three strategic pathways for nanostores in transitioning ICT implementation. These pathways are the Supplier-Driven Transition Pathway, the Balanced Transition Pathway and the Adaptive Exploration Pathway (see Figure 4). These pathways are derived based on the lowest cumulative SI in the progression from Digital Laggard to Digital Innovator. Each pathway represents the dynamics of change across the three key domains of the digital business system: supplier, internal and consumer. Each pathway outlines a sequence of implementation stages, representing gradual development of ICT adoption across all dimensions. The model highlights the diversity of strategies and focus areas that nanostores use to navigate digital transformation.
The Supplier-Driven Transition Pathway denotes digital transformation driven by upstream actors, primarily suppliers and distributors. Nanostores begin as Supplier-Driven Digital Adopters, leveraging tools introduced through supplier outreach or partnership programs (Escamilla et al., 2021). The rise of online marketplaces and distributor-led innovations has accelerated this trend in developing countries (Guo et al., 2022; Mujianto et al., 2023). Adoption typically progresses from supplier-facing tools to internal processes and eventually to customer engagement. While this efficiency-oriented path enables rapid implementation with minimal disruption, it heightens dependency on external systems. Advancement toward Advancing Digital Integrators requires improved contract management and tighter coordination to regain control over digital operations.
The Balanced Transition Pathway reflects an integrated approach where nanostores adopt ICT across supplier, internal and consumer dimensions. Unlike the supplier-driven path, it prioritizes internal capability building and consumer engagement. Adoption is typically self-initiated, aligned with operational goals and supported by prior digital experience. This proactive stance aligns with studies emphasizing internal process improvement in early digital transformation (Bollweg et al., 2020; Isharyani et al., 2024). Although requiring greater initial investment, it enhances capacity, minimizes misalignment and supports sustained value creation. Consequently, nanostores following this path are better positioned for a smoother transition to the Advancing Digital Integrator stage.
The Adaptive Exploration Pathway reflects a flexible, iterative transition in which nanostores typically begin as Balanced Transitioners before gravitating toward supplier-driven approaches. This shift, however, is neither linear nor fully dictated by suppliers. Instead, nanostores experiment across supplier, internal and consumer dimensions, adjusting based on experience. Some technologies are discontinued due to usability or cost issues (Guo et al., 2022; Seethamraju & Diatha, 2019), reflecting continuous reassessment. Strategies are recalibrated according to readiness, budget and perceived value, often prioritizing supplier-supported solutions that offer immediate benefits. Although this path demands greater effort and trial-and-error, it enables tailored ICT adoption and enhances digital readiness toward the Digital Innovator stage.
5.3 Nanostores governance
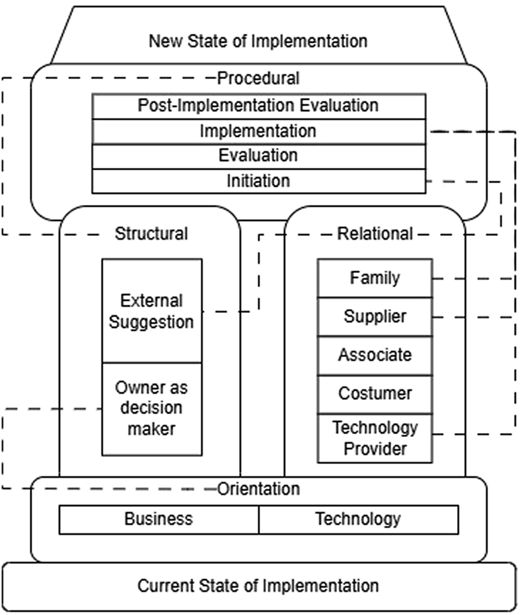
This study proposes a governance model that explores the decision-making mechanisms underpinning the digital transformation of nanostores (see Figure 5). Governance acts as a steering system ensuring that innovation remains aligned with the organization's strategic orientation (Peterson, 2004). The implementation of new ICT does not occur randomly but progresses through four interrelated components: orientation, structural, relational and procedural. These components together constitute the mechanisms through which decision rights are allocated and exercised to align ICT initiatives with organizational strategy. The orientation component represents the strategies and goals of nanostores. The structural and relational components represent the allocation of decision rights. The procedural component represents the decision-making processes. The governance model illustrates how these four components interact to sustain and extend organizational strategy through ICT implementation. The dashed lines indicate possible alignments between components or between specific subcomponents. Component-level alignment involves all subcomponents, while subcomponent alignment indicates partial influence.
The foundation for digital transformation begins with two key layers: current ICT implementation (first level) and strategic orientation (second level). These layers help assess the readiness and digitalization needs of nanostores. The current implementation status indicates existing capabilities and informs the direction of future initiatives (Isharyani et al., 2024). This, in turn, shapes strategic orientation, which includes business and ICT strategies. Orientation influences the structural component of governance through owners' decision-making roles. Entrepreneurial orientation guides business development by encouraging innovation and opportunity seeking (Cheng, Wu, & Xiao, 2025), whereas technological orientation shapes attitudes toward new technology adoption (Chawla et al., 2025). Together, these orientations are central to determining the direction and effectiveness of digital transformation in nanostores contexts.
The third level of the model comprises the structural and relational components, which together form the organizational and social foundations for allocation of decision-making roles of digital tools adoptions. The structural dimension focuses on the store owner's decision-making role, supported by suggestions from their relationship. Owners are key drivers of technological innovation in nanostores (Mkansi & Nsakanda, 2025; Wahyudin et al., 2023). While owners ensure strategic alignment, external inputs offer new perspectives and enhance decision quality. The relational component includes stakeholders such as family, suppliers, technology providers, customers and co-owners. These actors influence decisions through both direct involvement and advisory roles. For nanostores' owners, who often are preoccupied with daily operations, such support is essential for informed and strategic decision-making (Isharyani et al., 2024; Seethamraju & Diatha, 2019). These two components, structural and relational, form the action of the decision-making process.
The procedural component outlines the chronological stages of digital transformation decision-making, including the initiation, initial evaluation, implementation and post-implementation review. The initiation phase involves recognizing the need for ICT, which is often triggered by relational factors. For instance, in response to customer demand, many nanostores have opened bank accounts and adopted digital payment systems. In the initial evaluation, potential benefits, risks and internal capacities are assessed. The implementation stage puts plans into action, often with support from external actors, such as suppliers. Finally, the post-implementation review assesses the long-term impact and sustainability of the technology. ICT solutions that provide clear value and efficiency tend to encourage nanostores to progress further on their digital transformation journey.
5.4 Governance as context
In this study, the governance model primarily functions as a passive context that shapes the conditions under which ICT implementation decisions are made, rather than as an active decision tool that directly determines specific transition pathways. The governance components, orientation, structural, relational and procedural, depict the decision-making environment and the available capabilities. However, they have not yet been explicitly operationalized as strategic instruments to guide nanostores from one level of digital maturity to the next. This passive role is reflected in findings that governance explains how decisions are made, through informal networks, supplier influence, or owner evaluation, rather than which paths should be taken. In other words, the model maps existing governance practices as a shaping context, not as a prescriptive navigation system that provides pathway recommendations based on specific governance profiles.
The decision-making process in digital transformation relies on the broader digital ecosystem. This ecosystem includes nanostore owners and other key actors. It provides infrastructure, platforms, collaboration networks and value-creation processes that go beyond internal technological investments (Bejjani, Göcke, & Menter, 2023). External institutions can accelerate transformation by directly integrating nanostores into these ecosystems. For example, some small retailers adopted digital tools due to distributor and supplier mandates (Seethamraju & Diatha, 2019). We found that Supplier-Driven Digital Adopters used apps extensively for payments, restocking and returns. In addition, government policies, such as 5G communication and innovations in banking services, have fostered a digital transaction culture among consumers (Chawla et al., 2025; Mkansi & Nsakanda, 2025). As a result, nanostores adopt digital payments to stay relevant in a dynamic global ecosystem, supporting the findings of Thanigan et al. (2025).
Meso-level institutions play a crucial role in initiating platform governance that drives the digital transformation of nanostores. A platform functions not merely as a technology but as an architecture of rules, standards and relationships that structure interactions among actors (Gawer & Cusumano, 2014). This study finds that distrust and skepticism constitute major barriers to ICT adoption. Conversely, respondents willing to collaborate demand clear procedures and tangible benefits. Building trust and providing training are essential prerequisites for technology adoption (Chawla et al., 2025). Platform governance such as access rules, certification, inspection, reputation and incentives influence market viability for small actors. Nanostores depend on meso-level initiatives, particularly government interventions and legitimacy, to gain access to digital channels (Guo et al., 2022). In the early stages of ICT infrastructure development, nanostores require trust in certified partners and evidence of system value to adopt new technologies. Cross-institutional collaboration through non-profit platform co-governance strengthens trust and empowerment as key enablers of digital transformation of nanostores (Candelo et al., 2022).
Although governance currently serves as a passive context, we argue that nanostores governance evolves alongside digital maturity. As nanostores move from Digital Laggards to Digital Innovators, their governance practices transform. Advancing Digital Integrators tend to show a more proactive orientation and broader relational networks. According to Luftman (2004), governance develops progressively from a reactive and tactical cost center at lower maturity levels to an integrated and strategic business enabler at higher maturity levels. This evolution suggests that governance holds the potential to function as an active decision-making tool. Future research may examine how specific governance configurations shape strategic choices, such as whether nanostores with strong technological orientation and wide networks are better suited to the Adaptive Exploration Pathway. Developing governance as an active, prescriptive instrument is thus an important agenda to improve strategic agility of nanostores across digital maturity stages.
5.5 Transformational planning
Finally, this study explores the perspective of transformation planning from the vantage point of nanostores. Digital transformation strategy is regarded as a blueprint for organizing the transformation process itself (Vial, 2019), underscoring the role of planning as a governance framework for change, including post-transformation operations. The three models, navigation map, strategic pathway and governance, capture digital transformation practices in nanostores. We reconstructed the transformation planning perspective based on these models (See Table 3). The reconstructed perspective was then employed to analyze two principal planning identified by Henderson and Venkatraman (1994): strategy implementation and technology implementation. This reconfiguration aims to synthesize motivating factors, relational actors, decision-making criteria and alternative strategic pathways. Accordingly, the resulting framework functions to explicate practices, inform the selection of actions and guide interventions in nanostores.
The strategy implementation perspective for nanostores is anchored in core business objectives, primarily revenue enhancement and process efficiency. Strategic innovations typically originate from perceived revenue opportunities or from best practices that store owners consider viable. Owners who recognize such potential seek information about relevant technologies from peers regarded as experienced. Option appraisal is driven by financial considerations and operational feasibility, prompting pragmatic and swift decision-making. Suppliers frequently support implementation by offering collaborative operating models. This perspective has been observed among nanostores classified as Supplier-Driven Digital Adopters, Balanced Digital Transitioners and Advancing Digital Integrators. These findings indicate that this perspective may manifest across all three strategic pathways. Consequently, the strategy implementation perspective represents the most common driver of digital transformation in nanostores.
The technology implementation perspective for nanostores centers on a clear digital strategy to maintain market relevance. Technological decisions are driven by store owners, customers, household members and technology providers. Innovations arise from growing digital awareness prompted by customer demand and vendor offerings. Evaluation emphasizes technical complexity and practical feasibility within the store's local context. Implementation commonly involves hands-on support from family members or providers who provide installation and training. This perspective appears primarily among stores classified as Balanced Digital Transitioners and Advancing Digital Integrators. This aligns with the Balanced Transition and Adaptive Exploration pathways. Both pathways allow incremental changes calibrated to technical capacity and market needs. Overall, the technology implementation perspective materializes when nanostores deem a given innovation to be salient and applicable to their operations.
The manifestation of governance contexts across the three strategic pathways reveals variations in how transformation planning is executed. The Supplier-Driven Transition Pathway focuses on strategy implementation characterized by owner-centric decision-making, limited visible family involvement and strong influence from suppliers and associated actors. The Balanced Transition Pathway demonstrates a more integrated form of governance, aligning strategy and technology implementation. Evaluation processes are more systematic and involve a diverse relational network, including family members, customers and technology providers. The Adaptive Exploration Pathway exhibits the capacity to adjust strategic and technological approaches through experiential learning and experimentation outcomes. The decision to conduct continuous reassessment is driven by strong owner leadership, although potential family involvement, unobserved in this study, cannot be ruled out. Nevertheless, these patterns represent snapshots of governance contexts within each pathway. Therefore, longitudinal studies are required to capture the dynamics of their evolution across digital maturity spectrum.
5.6 Practical implication
The navigation model for ICT implementation underscores the need for targeted and adaptive policies that reflect the digital maturity of nanostores. Policies must classify stores into categories from Digital Laggards to Digital Innovators. Participatory education programs are essential to stimulate adoption interest among Laggards. Nanostore owners identified as skeptics, hesitators and avoiders exhibit low enthusiasm and perceive few benefits from technology (Wahyudin et al., 2023). In contrast, training programs suit nanostores in transition stages; they build confidence and enhance technological knowledge (Guo et al., 2022). For Innovators, direct support and engagement in pilot initiatives drive sustainable digitalization. Finally, conducting field-based needs analyses and fostering collaboration are key to avoiding one-size-fits-all interventions.
External and meso-level institutions can engage by fostering the digital ecosystem innovations that support the digitalization of nanostores. Digital-ecosystem innovations should be grounded in the creation of relative advantages for small retailers (Peltier et al., 2012). For example, banking innovations have generated flexible payment options for nanostores, enabling their participation in e-commerce and access to hard-to-reach markets (Mkansi & Nsakanda, 2025). Additionally, the development of data-driven alliance platforms can strengthen the position of nanostores within online marketplaces. Empowering the digital ecosystem through platform co-governance, involving store owners, retail communities and technology facilitators, can enhance the nanostores’ trust and engagement in ICT implementation (Candelo et al., 2022). Finally, Business to Business to Consumer (B2B2C) partnership schemes are recommended to sustain digital services over the long term.
The findings provide practical guidance for ICT implementation among nanostores in emerging economies. The proposed model can be applied to broader socio-economic contexts under two conditions. First, nanostores should exhibit characteristics similar to those identified by Fransoo et al. (2017). Second, although the most influential external actors may vary across regions, the supportive external ecosystem must be established beforehand. The availability and popularity of free fintech platforms have enabled nanostores digitalization in India (Bhattacharjee et al., 2024). In China, the combination of infrastructure development, subsidies, training, government legitimacy and supplier support has created a digital ecosystem that drives the adoption of digital procurement by nanostores (Guo et al., 2022). If these two conditions are met, nanostores can utilize this model to navigate their digital transformation. Nanostores are encouraged to assess their current level of ICT implementation and regional digital ecosystem readiness. The results of this assessment can then identify opportunities for further implementation. This approach helps nanostores avoid innovation deficit and disenchantment discontinuance.
6. Conclusion and future research agenda
This study maps the stages and transition pathways of ICT implementation in nanostores, identifying five digital maturity clusters, three strategic transition models and a navigational governance framework. The proposed model supports policy and program design tailored to nanostores’ digital readiness. Segmenting nanostores by digital maturity enables targeted interventions. A one-size-fits-all approach is ineffective. This model can help policymakers, associations, technology providers and store owners to assess digital maturity and design appropriate interventions. The model applies to nanostores with similar characteristics, but requires calibration based on digital ecosystem readiness. Nanostores governance reveals the important role of external actors in shaping the digital ecosystem that supports transformation. With proper regional calibration, the navigation model can be a strategic tool to accelerate the digital transformation of nanostores.
This study advances the understanding of digital transformation in nanostores by integrating the Strategic Alignment Model and diffusion of innovation theory to highlight the role of business processes and governance. Through a mixed-methods approach, combining cluster analysis and qualitative case studies, it offers a navigation model that reveals diverse digital adoption pathways and the importance of governance in ICT outcomes. The research contributes to digitalization literature by providing empirical insights into micro-scale retail transformation. More broadly, this study enriches the literature on platform-dependent SME innovation by demonstrating how micro-retailers' digital transformation is shaped by ecosystem actors and institutional arrangements. This platform-mediated transformation pattern mirrors dynamics observed in other SME digitalization contexts, such as online platform integration by rural nanostores in China through Suning and multi-sector small retailers in Italy via Evideditorino.it (Candelo et al., 2022; Guo et al., 2022). This suggests that our governance framework has theoretical transferability across sectors and regions where small enterprises navigate digital transformation through platform ecosystems.
Future research should address several areas to enhance the proposed navigation model. First, longitudinal studies are needed to capture the dynamic progression of nanostores across digital maturity clusters and identify influencing external factors. Second, the inclusion of moderating variables, such as local market characteristics, consumer digital readiness, or government subsidy policies, can enrich the explanatory power of the model. Third, expanding the sample across diverse geographic and cultural contexts would strengthen the model's generalizability. Fourth, developing a predictive model can help to identify how navigation governance influences the direction of digital transformation within each cluster. Finally, designing segmented intervention programs and testing these interventions would help to evaluate the effectiveness of adaptive governance in nanostores. These directions will support the development of more robust and context-sensitive strategies to accelerate the digital transformation of nanostores globally.
Supplementary material
The Supplementary Material supporting this study is available at the following repository: Link to the website