


This study aims to examine success factors for food truck businesses in the United Arab Emirates (UAE), focusing on customer convenience, government support, cultural infrastructure and location decisions. Given the unique cultural and economic context of the UAE, this research aims to fill a notable gap in the existing literature.
Using SmartPLS and partial least squares structural equation modeling, data from 250 food truck owners are analyzed to identify significant relationships between success factors and business performance.
The findings reveal significant relationships (p < 0.05) between success factors and the performance of food truck businesses. Customer convenience indirectly affects success through location suitability. Additionally, cultural infrastructure, government support and strategic location decisions have a direct impact on business performance. However, some indirect effects, such as customer convenience through location selection, were found to be statistically insignificant (p = 0.061).
The study offers practical guidance for policymakers and entrepreneurs, highlighting the importance of strategic location selection, cultural infrastructure and customer convenience for business success. Establishing designated food truck zones based on suitability will ensure optimal operational environments, particularly in high-traffic tourist areas.
This study contributes new insights into the food truck industry in the UAE, using advanced statistical techniques to identify specific success factors relevant to the region’s unique dynamics.
1. Introduction
The food truck industry has gained popularity worldwide (Weber, 2012), contributing to the diversification of the global food scene. In recent years, the food truck sector has emerged as a top performer in the food service industry, experiencing annual sales growth averaging 9.3% (Yoon and Chung, 2017). During economic downturns, such as the 2007–2009 recession, food trucks have proven resilient because of their ability to offer affordable alternatives to traditional restaurants. The market is expected to continue expanding as consumers seek novel experiences and cuisines at reasonable prices, and the relatively low initial investment required to start a food truck business makes it an attractive option (McLaughlin, 2009).
In the United Arab Emirates (UAE), food trucks have become increasingly popular, adding vibrancy and diversity to the local culinary scene. Despite being relatively new to the UAE, food trucks have captured the interest of locals and visitors alike, offering a wide range of international flavors and innovative dishes. These mobile kitchens embody entrepreneurship and innovation, reflecting the evolving food culture in the UAE. The study of the food truck industry in the UAE holds significant economic, cultural and societal implications. As small- and medium-sized enterprises (SMEs), food trucks contribute to the growth of the UAE’s economy and the creation of new jobs (Lichy et al., 2022). Additionally, food trucks facilitate cross-cultural encounters, allowing locals and visitors to sample various international cuisines and promoting inclusivity and community engagement through events and gatherings (de la Salle, 2019).
Thus, this study aims to explore how food trucks enrich the diverse culture of the UAE while addressing the challenges and opportunities faced by food truck business owners. Factors such as governmental regulations, site selection, competition with existing eateries and cultural infrastructure are crucial in the UAE context, and understanding these can benefit young entrepreneurs and legislators (Khaleej Times, 2023; Virtuzone, 2021). The research questions focus on identifying the factors driving food truck performance, the influence of customer convenience, the impact of cultural infrastructure and the role of location selection and suitability factors for food truck businesses in the UAE. The primary objectives are to provide insights for entrepreneurs, decision-makers and stakeholders by conducting a comprehensive analysis of food truck business performance in the UAE.
2. Literature review
2.1 Food truck industry–world level
Food trucks have evolved into a significant aspect of global cuisine, blending entrepreneurship with culinary creativity. Originating in the early 19th century in the USA, they have transformed into contemporary gourmet experiences to meet the demands of an increasingly discerning audience (Jones, 2016). The food truck market was valued at around US$4.3bn in 2023 and is expected to grow at a compound annual growth rate (CAGR) exceeding 5% from 2024 to 2032 (Global Market Insights, 2024). This expansion is largely attributed to government initiatives that offer financial assistance, regulatory support and infrastructure enhancements, facilitating entry for new entrepreneurs. In Asia, the food truck industry is projected to increase from US$4.15bn to US$6.87bn over five years, with a CAGR of 6.5% (Mordor Intelligence Market Research, 2023b). Europe has emerged as a dominant player in the food truck market, with market share expected to expand further (Mordor Intelligence Market Research, 2023b). The Europe Foodservice Market is projected to reach US$783.89bn by 2023 and grow to US$1358.52bn by 2029, with a CAGR of 9.60% (Mordor Intelligence Market Research, 2023a). In the USA, the food truck market was valued at US$996.2m in 2020, showing significant growth from US$856.7m in 2015.
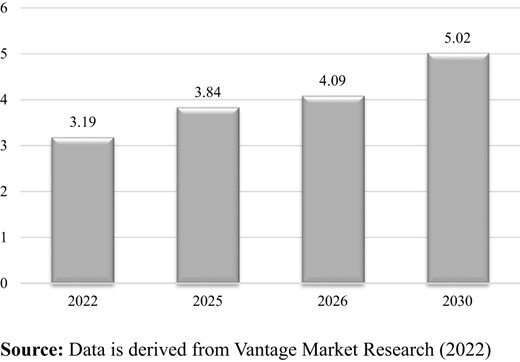
In 2014, Brazilian food trucks generated about US$35bn in annual income (Isoni Auad et al., 2019), highlighting their significant economic impact. Food trucks are trending in the restaurant industry, offering customers unique dining experiences (Holmes et al., 2018). Globally, the food truck market is expected to grow from around US$3.19bn in 2022 to US$5.25bn in 2030 (Figure 1), with a CAGR of 6.40% (Vantage Market Research, 2022; Grand View Research, 2020). The food truck market is expected to grow, driven by global culinary trends and a preference among consumers aged 18–35 for unique dining experiences (Lovie Team, 2024). Over 40% of food truck customers are under 45 (IBISWorld, 2024). Additionally, the rising demand for gourmet foods and innovative culinary concepts is expected to further drive market expansion in the coming years.
2.2 Segmentation of the food truck
The Food Truck Market is segmented based on the following primary factors: type, size, food type and region (Figure 2). Types include expandable boxes, buses and vans, customized trucks and others. Sizes are categorized as small, medium and large. According to Custom Market Insights (2024), small food trucks are compact vans and carts that offer high mobility for diverse settings, making them cost-effective for entrepreneurs but limited in menu options because of restricted kitchen space. Medium-sized food trucks strike a balance between mobility and capacity, providing more kitchen space and versatility, though they require higher investments and face regulatory complexities. Large food trucks feature extensive kitchen facilities, allowing for a wide variety of menu items and high customer volumes at large events.
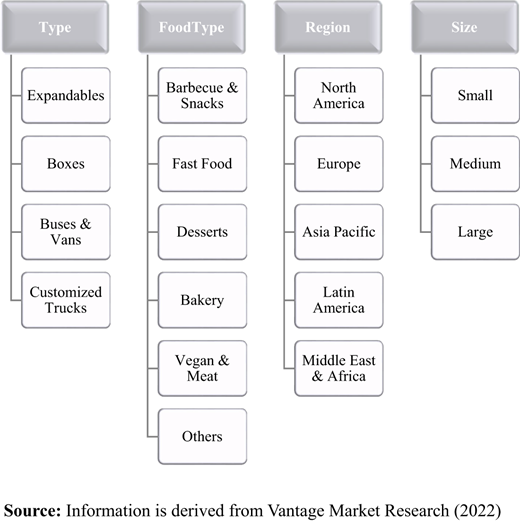
Food types include barbecue and snacks, fast food, desserts and confectionery, bakery, vegan and meat plant and others (Vantage Market Research, 2022). The market is also divided by region, including North America, Europe, Asia Pacific, Latin America and the Middle East and Africa. Notably, regional markets such as North America, Europe and Asia Pacific exhibit differing demands for these segments.
2.2.1 Segmentation based on type.
The segment consisting of buses and vans is now the dominant force in the Food Truck Market and is projected to maintain its dominance during the forecast period. Furthermore, there is a growing trend among Food Truck operators to use buses and vans because of their convenient mobility and cost-effectiveness compared to customized or expanded trucks. This shift towards buses and vans is positively impacting the expansion of the bus and van segment within the Food Truck Market.
2.2.2 Segmentation based on size.
Vantage Market Research (2022) provides a comprehensive analysis of the food truck industry through detailed segmentation, offering valuable insights into its dynamics and trends (Figure 2). Notably, the medium-sized food truck segment is expected to dominate the market because of its growing demand, driven by its convenience and flexibility for relocating to events such as promotional festivals, parades and carnivals.
2.2.3 Segmentation based on geographical region.
The global food truck market spans North America, Europe, Asia-Pacific, the Middle East and Africa and Latin America. Europe leads the market with a projected CAGR of 6.8%, driven by an increase in food festivals and events; a Le Cordon Bleu survey found that such events doubled in 2019, boosting demand for food trucks (Straits Research, 2023). Major events such as Taste of London and Oktoberfest featured numerous food trucks, contributing to this growth. In 2021, Europe accounted for over 90% of global van sales, with the rising popularity of electric and hybrid vans in the food truck sector (Straits Research, 2023).
North America is expected to grow at a CAGR of 7.0%, thanks to low startup costs (around US$50,000–60,000) and favorable locations for food trucks (Straits Research, 2023). With over 35,500 food trucks operating, states such as California, TX and Florida lead the market. A survey found that over 60% of millennials prefer food trucks offering unique menus, driving the industry’s growth alongside increased tourism (Straits Research, 2023).
Asia-Pacific is projected to have the fastest CAGR of 7.5%, fueled by a strong preference for street food in countries such as China, Japan and South Korea, along with established manufacturers such as Hanyi Machine and Ante Trailers (Straits Research, 2023). In the Middle East and Africa, the food truck market is growing at 6.4%, driven by urbanization and a rising interest in global cuisines, particularly in bustling cities such as Dubai, Riyadh and Cairo, which feature high foot traffic and diverse consumer bases (Straits Research, 2023).
2.3 Food truck Industry – United Arab Emirates
Entrepreneurship is widely acknowledged for its pivotal role in driving economic development and job creation (OECD, 2017; Alkaabi and Ramadani, 2023; Alkaabi et al., 2023; Ramadani et al., 2023). In the UAE, small and medium enterprises (SMEs) contribute significantly to the gross domestic product, representing 95% of all establishments and 42% of the workforce (Alkaabi, 2020). Despite their importance, SMEs face challenges such as logistical efficiency and meeting customer demands (Alkaabi, 2023).
The food truck business is considered an SME, and examining the development of this industry globally and historically is crucial for understanding its context in the UAE. The Dubai municipality issued 203 licenses in 2016, averaging approximately 17 licenses per month. In the first two months of 2017 alone, it issued 134 permits (67 per month) – a substantial increase. The food service sector in the UAE is developing rapidly, with an expected expansion of 4% from 2019 to 2024 (Statista, 2023; Brenda, 2017).
Financially, launching a food truck in Dubai requires a significant initial investment, typically ranging from approximately AED 130,000 to AED 140,000 (United Arab Emirates Dirhams, equivalent to about US$35,400–38,100 or €31,700–34,100). This investment encompasses the purchase of a quality food truck, starting at around AED 35,000 (US$9,500 or €8,500), along with monthly rental costs that range from AED 15,000 to 25,000 (US$4,000 to US$6,800 or €3,700 to €6,100), depending on the location. Additionally, expenses for obtaining the necessary permits and licenses for operating a mobile food establishment in Dubai must also be considered (Worldwide Formation, 2023).
The overall food service market in the UAE is projected to be valued at approximately US$16.92bn in 2023, with expectations to grow significantly, reaching about US$43.98bn by 2029. This growth is anticipated to occur at a CAGR of 17.26% during the forecast period from 2023 to 2029 (Mordor Intelligence Market Research, 2023c). Notably, the cloud kitchen segment is emerging as the fastest-growing area within the UAE’s food service industry, with the food truck sector also contributing significantly to this expansion.
The mobile food truck segment is experiencing significant growth, establishing a distinctive presence within Abu Dhabi’s culinary landscape (Kanojia and Khan, 2024). The UAE’s multicultural demographic fosters a dynamic environment where food trucks serve as a platform for diverse culinary expressions, catering to a wide array of tastes and preferences (Magzoid. (2024). These mobile food vendors not only contribute to the gastronomic diversity of the region but also embody entrepreneurial spirit and innovation, as they adapt to consumer demands for convenience and unique dining experiences (Lara Ríos et al., 2024). Research indicates that food trucks play a pivotal role in enhancing urban food culture, facilitating community engagement and promoting local economies (Wallace, 2021).
2.4 Research gap identification
The food truck industry is a complex and significant sector, yet research specific to the UAE context is lacking. This study aims to fill this gap by investigating the unique factors shaping the industry within the UAE’s cultural, economic and regulatory landscape. By focusing on local dynamics, the study seeks to inform policy and practices, contributing to the sector’s broader economic and cultural impact.
To support the thriving food truck industry, policymakers should simplify permit processes and offer financial incentives such as low-interest loans or grants to encourage entrepreneurship (Wallace, 2021). Establishing designated food truck zones based on location suitability helps ensure food trucks operate in optimal environments (Magzoid, 2024). This includes considerations such as high foot traffic, proximity to utilities and compliance with local regulations. In places such as Dubai and Abu Dhabi, these zones are key to fostering a growing food truck industry, allowing businesses to thrive in areas with high tourist activity and diverse populations (CorpCreators, 2024).
The UAE’s food truck industry is expected to grow, bolstered by increased tourism and cultural interest in street food (UnivDatos Market Insights Pvt Ltd, 2024; Posist, 2025). Moreover, street events, as demonstrated in studies and industry practices, show the important role of food trucks in enhancing cultural experiences (Sandybayev, 2018). Food trucks provide not only convenient dining options but also add to the vibrancy of public leisure activities (Sandybayev, 2018; Worldwide Formation, 2023).
2.5 Hypothesis development
2.5.1 Customer convenience and food truck performance.
Customer convenience is crucial for the success of food truck businesses. Service quality, accessibility and convenience impact consumer behavior and loyalty (Kaswengi and Lambey-Checchin, 2020). Research shows that dimensions such as tangibles – referring to the physical aspects of the service such as cleanliness and presentation (Bitner, 1992) – assurance, which involves the knowledge and courtesy of staff that build trust (Zeithaml et al., 1996) and dependability, signifying the reliability in delivering promised services consistently (Parasuraman et al., 1988), all contribute to customer satisfaction and loyalty in food truck businesses. Efficient equipment design, such as well-designed food service trucks, enhances productivity and customer convenience. Accessibility and convenience are key factors for repeat business, emphasizing the importance of strategic location selection (Haddad et al., 2022). Customers prioritize accessibility and quick service when choosing food trucks, highlighting the critical role of convenience in their decision-making. Therefore, it is proposed that:
The level of customer convenience has an indirect impact on the success of food truck businesses, mediated by location selection.
The influence of existing organizations on food truck performance is significant, as they rely on suitable public areas to attract desired customers (Schifeling and Demetry, 2021). This often involves partnerships with entities sharing a commitment to authenticity, such as artisan businesses such as wineries, microbreweries and art festivals (Irvin, 2017). Wardana et al. (2023) highlight the strategic importance of location selection in retail environments, emphasizing its direct impact on customer traffic and business success, rather than just a logistical concern. This notion is pertinent to the food truck sector, which heavily relies on foot traffic and visibility to attract consumers. Overall, consumer convenience profoundly influences food truck performance and profitability by shaping customer intentions, satisfaction and loyalty through the suitability of their location. Thus, it leads to the following hypothesis:
The level of customer convenience has an indirect impact on the success of food truck businesses, mediated by location suitability.
2.5.2 Government support and food truck.
Government support plays a crucial role in shaping the food truck industry. Simplifying licensing procedures can alleviate regulatory burdens and facilitate industry expansion (Wallace, 2021). However, regulatory variations across jurisdictions present challenges for food truck owners (Agyeman et al., 2017). Understanding the direct impact of government support on food truck performance is vital (MOEC, 2023). Therefore, such a requirement of support leads to the following hypothesis for the study in this regard:
Government support directly influences the success of food truck businesses.
2.5.3 Cultural infrastructure and food truck performance.
Cultural infrastructure, which includes local culinary traditions, festivals and community events, plays a vital role in influencing the success of food truck businesses. This influence is primarily seen through two key pathways: location selection and location suitability.
Cultural infrastructure shapes location selection by guiding food truck operators to choose areas that resonate with the community’s cultural attributes. For example, regions known for vibrant food festivals or cultural events are likely to attract food trucks that align with these themes, ultimately enhancing customer engagement and business performance (Sadler, 2016). Research suggests that communities with rich culinary heritage provide food truck operators with insights into optimal locations that can draw larger crowds (Truong, 2019).
Moreover, cultural infrastructure also affects location suitability by impacting how well a specific site meets the needs and preferences of the local population. Areas with strong cultural characteristics often correlate with higher demand for particular cuisines, customer demographics and accessibility. A food truck operating in such a culturally rich environment is better positioned to meet local tastes and preferences, leading to improved operational effectiveness and overall success (Bublitz et al., 2019; Yoon and Chung, 2017). Therefore, it is proposed as follows:
The cultural infrastructure indirectly influences the success of food truck businesses through the mediation of location selection.
The cultural infrastructure indirectly influences the success of food truck businesses through the mediation of location suitability.
2.5.4 Role of location (selection and suitability) on food truck performance.
A food truck’s success often depends on its location, with entrepreneurs considering factors such as foot traffic, proximity to residential areas and accessibility to public transportation (Ahmad et al., 2018). Figure 3 (DMT, 2019) highlights the importance of parking facilities availability, influencing both consumer convenience and the truck’s operational efficiency, ultimately impacting its performance.
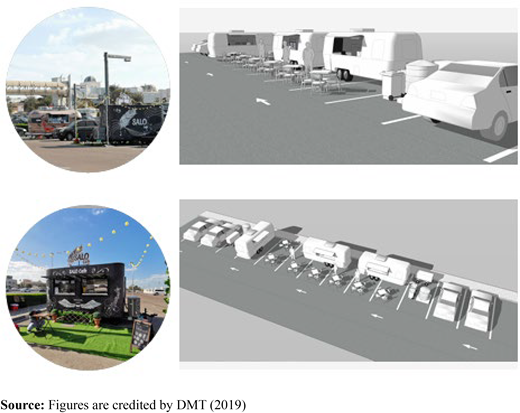
Mobile food cart stopping mechanism based on location, utilizing vertical parking lots in collective temporary spaces
Mobile food cart stopping mechanism based on location, utilizing vertical parking lots in collective temporary spaces
The success of food truck operations is heavily influenced by the geographical suitability of the area (Gillis and Castrogiovanni, 2012). Choosing the right site requires understanding the local demographics and preferences (Kim et al., 2009). Research in economic geography suggests that businesses often cluster together to gain social connections and knowledge before launching new ventures (Schifeling and Demetry, 2021). Accessibility, including ease of entry and exit, pedestrian flow and proximity to parking and public transportation, also plays a crucial role in a food truck’s visibility and reach, impacting its ability to attract and serve customers effectively (Ehrenfeucht, 2017; Holmes et al., 2018). Therefore, the following hypothesis is proposed:
Location selection has a significant effect on food truck business performance.
Location suitability has a significant effect on food truck business performance.
This study addresses a research gap in examining the performance of the food truck industry in the UAE, focusing on five key factors: customer convenience, government support, cultural infrastructure, location selection and location suitability. While previous research has explored these factors individually in different contexts (McNeil and Young, 2019; Jeong et al., 2021; Abdou et al., 2023), their combined impact on food truck performance, especially within the UAE’s unique socio-economic environment, remains underexplored. Additionally, the role of cultural infrastructure in shaping customer preferences and its influence on location decisions has not been thoroughly investigated in the region. This study contributes by providing insights into how these factors collectively impact food truck success, offering a more comprehensive understanding of the UAE’s emerging food truck market.
2.6 Locational analysis
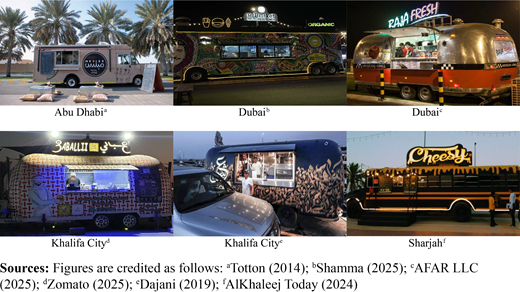
A thorough analysis of the UAE’s food truck industry emphasizes the strategic importance of selecting high-traffic and culturally vibrant locations such as Dubai and Abu Dhabi. These areas, including tourist attractions and iconic landmarks, offer prime opportunities for food trucks. Despite challenges such as regulatory variations and extreme weather, the sector thrives because of the UAE’s diverse culinary scene and growing demand for international and fusion cuisines. Over the past decade, food trucks have reshaped the country’s dining landscape (Plate 1), bringing gourmet cuisine to the streets alongside its renowned high-concept dining scene (Totton, 2014; Shamma, 2025; AFAR LLC, 2025; Zomato, 2025; Dajani, 2019; Al Khaleej Today, 2024).
3. Methodology
3.1 Theoretical framework
This study examines the influence of five key factors on the performance of the food truck industry in the UAE: customer convenience, government support, cultural infrastructure, location selection and location suitability (Figure 4). Customer convenience, which includes elements such as accessibility, service quality and customer satisfaction, has been identified in prior research as a significant determinant of consumer behavior, particularly in mobile food services (McNeil and Young, 2019). Government support is another independent variable, addressing regulatory policies and permits that are essential for food truck operations. Prior studies have emphasized the role of governmental backing in enhancing small business performance (Jeong et al., 2021; Abdou et al., 2023). Additionally, cultural infrastructure is crucial for food truck businesses, as it fosters community engagement and shapes customer preferences (Combs, 2022; Tiches, 2023). Two mediating variables, location selection and location suitability, mediate the relationships between customer convenience and food truck performance and between cultural infrastructure and food truck performance, respectively, consistent with the assertion that optimal location choice is crucial for mobile business success (Lu, 2022).
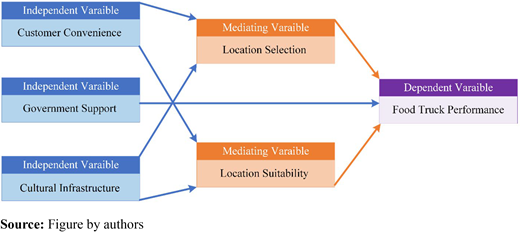
Food truck performance serves as the dependent variable, representing key outcomes such as profitability, customer retention and market growth. While these factors may seem logical and are informed by existing literature, this study contributes to the field by applying these variables within the unique socio-economic and regulatory context of the UAE, which has not been extensively explored in the current literature. By applying these theoretical constructs within the UAE, this research fills existing gaps in the literature on food truck performance and offers valuable insights into the factors influencing the success of mobile food vendors in this rapidly developing market.
Table 1 outlines five constructs and their associated items that are used for the analysis in this study, focusing on the success of food truck performance in the UAE. Key constructs include customer convenience, which refers to the ease and accessibility that customers experience when interacting with a food truck’s location and services (Gopi and Samat, 2020; Shin et al., 2019; Yoon and Chung, 2017). Key factors include proximity to public transportation, availability of parking spaces and walkability in the surrounding area. The presence of nearby convenience stores or supermarkets can also attract customers. Additionally, offering mobile ordering and delivery services enhances flexibility and accessibility (Koay et al., 2023).
Constructs and associated items for food truck business analysis
| Construct/ related studies | Item | Construct/related studies | Item |
|---|---|---|---|
| Customer convenience (CC)(Gopi and Samat, 2020; Shin et al., 2019; Yoon and Chung, 2017; Koay et al., 2023) | CC1: Proximity to public transportation stops or hubs for accessibility | Location selection (LSel)(Shaikh et al., 2021; Truong, 2019) | LSel1: Foot Traffic and Customer Flow |
| CC2: Evaluating the availability of parking spaces for customers’ vehicles | LSel2: Proximity to Residential Areas | ||
| CC3: Assessing the walkability of the surrounding area for pedestrian traffic | LSel3: Proximity to Commercial Districts | ||
| CC4: Considering the presence of nearby convenience stores or supermarkets | LSel4: Parking and Accessibility: Adequate parking spaces for customers and easy access to the food truck | ||
| CC5: Availability of mobile ordering or delivery services for customer convenience | LSel5: Nearness to Tourist Attractions or Landmarks | ||
| Food truck performance (FT)(Bhatt, 2023; Saleh, 2023) | FT1: Growing in popularity and diversity of cuisine | LSel6: Visibility and Signage: Choose a location that offers good visibility to attract passersby | |
| FT2: Increased competition and innovation | LSel7: Safety and Security: Ensure the chosen location is safe for both customers and employees | ||
| FT3: Boosting tourism and attracting international audiences | LSel8: Infrastructure and Utilities: Access to utilities like water and electricity is crucial | ||
| FT4: Technology Integration: increase in the use of mobile apps for ordering, payment and tracking food truck locations | LSel9: Local Regulations and Permits: Be aware of local zoning laws, permits and restrictions | ||
| FT5: Adopting sustainable practices, such as using eco-friendly packaging and sourcing local ingredients | LSel10: Competition: Analyze the level of competition in the area | ||
| FT6: Rate your overall business success: Based on your opinion, how would you rate the success of your food-truck business? | LSel11: Costs: Analyze the costs associated with the location, such as rent, utilities and any additional fees | ||
| Cultural infrastructure (inf)(Bublitz et al., 2019; Malasan, 2017; Newman and Burnett, 2013; Wan and Chan, 2013; Combs, 2022; Tiches, 2023) | Inf1: Age and income levels of the local population | LSel12: Nearby Businesses and Events: Consider nearby businesses, events, or attractions that can attract potential customers | |
| Inf2: Cultural and culinary preferences of the residents | Government support (GS)(Petersen, 2014; Wallace, 2021; Jeong et al., 2021; Abdou et al., 2023; Alfiero et al., 2017; Sobaihi, 2020) | GS1: Low crime rates and a safe neighborhood | |
| Inf3: Residential density and proximity to workplaces | GS2: Well-lit areas and surveillance systems | ||
| Inf4: Tourist and expatriate presence in the area | GS3: The presence of security personnel or nearby police stations | ||
| Inf5: Local demand for specific types of cuisine | GS4: Measures to prevent theft or vandalism of the food truck | ||
| Location suitability (lsui)(Bopche and Neware, 2020; Sadler, 2016; Lu, 2022) | LSui1: The demographic profile and preferences of the local population | GS5: Compliance with health and safety regulations | |
| LSui2: The proximity to nearby residential areas or housing complexes | |||
| LSui3: Assessing the purchasing power and spending habits of the target audience | |||
| LSui4: Considering the potential for attracting tourists or visitors to the location |
Food truck performance reflects a food truck’s effectiveness in delivering quality services and products (Bhatt, 2023; Saleh, 2023). It is influenced by the popularity and diversity of cuisine, which attracts a wider customer base, and by competition that drives continuous improvement (Bhatt, 2023; Saleh, 2023). Additionally, boosting tourism enhances reach, while technology integration, such as mobile ordering apps, streamlines operations. Sustainable practices improve brand image and appeal to eco-conscious consumers. Also, performance is assessed through self-evaluation, where owners rate their business success.
Cultural infrastructure in the context of food truck businesses encompasses the elements that influence community engagement and culinary diversity (Bublitz et al., 2019; Malasan, 2017; Newman and Burnett, 2013; Wan and Chan, 2013). Key factors include the age and income levels of the local population, which shape consumer preferences, and the cultural and culinary tastes of residents, affecting menu offerings. Additionally, residential density and proximity to workplaces impact customer accessibility and foot traffic, while the presence of tourists and expatriates can expand the customer base and enhance business opportunities.
Location suitability refers to how well a particular site meets the specific needs and characteristics of the business, ensuring that it aligns with the business model and target audience (Bopche and Neware, 2020). Location suitability for food truck businesses is determined by several key factors (Sadler, 2016). Local demand for specific cuisines informs menu choices while understanding the demographic profile and preferences helps tailor services. Proximity to residential areas increases accessibility and foot traffic, and assessing the purchasing power of the target audience aids in pricing strategies (Sadler, 2016). Additionally, considering the potential to attract tourists can enhance business opportunities.
Location selection involves the specific criteria and decision-making process used to choose a site for a business (Shaikh et al., 2021). Location selection for food truck businesses involves several key factors (Truong, 2019). High foot traffic and proximity to residential and commercial areas ensure accessibility and customer flow (Truong, 2019). Adequate parking and visibility, along with safety measures, are crucial for attracting customers. Access to utilities, such as water and electricity, is vital for operations. Furthermore, analyzing the competition can help identify market gaps, and considering nearby businesses and events can further enhance customer attraction and business opportunities.
Also, government support for food truck businesses is vital for fostering a safe environment (Petersen, 2014). Key factors include low crime rates, well-lit areas with surveillance systems and the presence of security personnel or nearby police stations. Together, these measures create a secure atmosphere that encourages growth and attracts customers.
3.2 Quantitative analysis of United Arab Emirates food truck businesses
The study used a quantitative research approach to examine variables impacting food truck businesses in the UAE, aligning with a positivist research paradigm for its empirical and objective nature (Bell et al., 2022). Using the deductive method, data was collected from 250 food truck owners and operators through a survey questionnaire, with 237 responses received between September 15, 2023 and October 9, 2023. The questionnaire, available in Arabic, covered demographics, customer convenience, food truck performance, cultural infrastructure, location suitability, location selection and government support, drawing from Baird and Su (2018) and featuring multiple-choice and Likert scale questions. Pre-testing ensured the questionnaire’s legitimacy and effectiveness, with purposive sampling used for regional diversity and further refined through random sampling within each region.
Smart PLS, a software application designed for partial least squares structural equation modeling (PLS-SEM), was used to assess the research hypotheses. PLS-SEM is a statistical technique used to analyze complex relationships among variables, particularly when the research focuses on exploratory analysis or when the theoretical foundations are still developing. Unlike traditional covariance-based SEM, PLS-SEM is more flexible and can handle smaller sample sizes while still providing robust estimates (Hair and Alamer, 2022). It enables researchers to model both measurements (how well the observed variables represent latent constructs) and structural relationships (the relationships between the latent constructs) simultaneously (Gudergan et al., 2008).
In this study, Smart PLS was used for its ability to manage complex models involving multiple constructs and indicators. The method is particularly suited for research aiming to predict outcomes and assess the relative importance of various predictors. This makes PLS-SEM especially useful in management research and related fields, where understanding the underlying relationships can inform strategic decision-making.
To ensure the reliability and validity of the research instrument, several critical tests were conducted. Cronbach’s alpha was used to assess internal consistency, ensuring that the items measuring each construct were reliably capturing the same underlying concept. Additionally, Fornell–Larcker criteria were applied to evaluate discriminant validity, confirming that constructs were distinct from one another (Vaske et al., 2017; Voorhees et al., 2015).
The analysis involved examining total indirect effects, specific indirect effects and path coefficients to determine the strength and direction of relationships between the variables in the model. This analysis was guided by established theories and hypotheses. The study used deductive reasoning to test preconceived hypotheses, which allowed for broader conclusions applicable to the food truck industry in the UAE (Rafiq et al., 2020).
This quantitative research aligns with a positivist paradigm, focusing on measurable phenomena to ensure a systematic and structured methodology, as outlined by the research onion framework proposed by Saunders et al. (2012) (Figure 5). The analyzed variables are summarized inTable 2, providing an overview of the constructs examined in the study.

3.3 Demographic analysis and interpretation
The study collected demographic data on the food truck business landscape in the UAE, providing valuable insights into the sector. Analysis of the demographics revealed that most participants held bachelor’s degrees (122), followed by high school diplomas (92), with smaller numbers holding master’s degrees (10) and one PhD Four participants did not disclose their education level. The sample predominantly comprised males, with 197 male and 37 female respondents. Regarding income distribution, the majority earned less than AED 3,000 (96), followed by 73 participants earning between AED 3,000 and 5,000. Respondents’ positions varied, with 45 owners and the remainder being waitresses (124) or cooks (65) and 1 unemployed individual. Most respondents fell into the younger age category (19–24 age bracket), totaling 229. Table 3 provides an overview of demographics, including nationality, education, gender, income, position and age.
Demographic overview (nationality, education, gender, income, position and age)
| Category | Subcategory | Count | % | Category | Subcategory | Count |
|---|---|---|---|---|---|---|
| Nationality | Philippines | 45 | 18.9 | Education | Middle school | 6 |
| Indian | 35 | 14.7 | High school | 92 | ||
| Nepal | 20 | 8.4 | Bachelor degree | 122 | ||
| United Arab Emirates | 20 | 8.4 | Master degree | 10 | ||
| Ugandan | 19 | 8.0 | PhD degree | 1 | ||
| Pakistani | 18 | 7.6 | N/A (not applicable) | 4 | ||
| Egypt | 15 | 6.3 | Position | Owner | 45 | |
| Nigeria | 12 | 5.0 | Order takers | 124 | ||
| Syrian | 11 | 4.6 | Cook | 65 | ||
| Cameron | 9 | 3.8 | Unemployed | 1 | ||
| Others | 32 | 13.5 | Gender | Female | 37 | |
| Income | Less than AED 3,000 | 96 | 41.7 | Male | 197 | |
| AED 3,000–5,000 | 73 | 31.7 | Age | 19–24 | 229 | |
| AED 5,001–7,000 | 31 | 13.5 | 25–29 | 3 | ||
| AED 7,001–9,000 | 4 | 1.7 | 30–40 | 5 | ||
| More than AED 9,000 | 26 | 11.3 |
3.4 Cross-tabulation analysis
The cross-tabulation analysis examined demographic factors and their connections to sample respondents in the food truck businesses. Table 4 displays the cross-tabulation of education, age and gender with positions. The prevalence of individuals aged 19–24 in lower-level roles, alongside a notable level of unemployment, suggests that the food truck sector attracts younger individuals seeking entry-level employment because of its accessibility and minimal entry requirements. Higher levels of education, particularly bachelor’s and master’s degrees, show a positive correlation with ownership, indicating that individuals with advanced education may have better prospects for entrepreneurship or managerial roles. The distribution of individuals with high school education across various positions, including a portion in the unemployed category, highlights the diversity of opportunities and challenges within the industry. The limited presence of individuals with PhD degrees in lower-tier roles suggests a unique aspect of the food truck business, where traditional higher education may not necessarily lead to higher-level positions, although this may be an outlier within the data set. Additionally, the data reveal that most males and females in the food truck industry hold bachelor’s degrees, with one male possessing a PhD. This educational distribution indicates that the food truck sector serves as an accessible entry point for young individuals across various backgrounds. This demographic is often adaptable and open to exploring new opportunities, particularly in emerging industries such as food trucks. The sector’s entrepreneurial nature and potential for creativity further appeal to young graduates, allowing them to leverage their education in innovative ways. Moreover, it creates pathways for higher education graduates to transition into ownership or managerial positions, highlighting the industry’s capacity to support diverse career development and professional growth.
Crosstab (education, age with position and gender)
| Category | Sub-category | Owner | Order takers | Cook | Unemployed | Male | Female |
|---|---|---|---|---|---|---|---|
| Education | Middle school | 2 | 4 | 0 | 0 | 6 | 0 |
| High school | 8 | 54 | 0 | 29 | 80 | 12 | |
| Bachelor’s degree | 28 | 58 | 2 | 34 | 100 | 20 | |
| Master’s degree | 6 | 4 | 0 | 0 | 7 | 3 | |
| PhD degree | 0 | 1 | 0 | 0 | 1 | 0 | |
| Uneducated | 1 | 1 | 0 | 2 | 2 | 2 | |
| Age | 19–24 | 45 | 118 | 2 | 63 | 189 | 37 |
| 25–29 | 0 | 3 | 0 | 0 | 3 | 0 | |
| 30–40 | 0 | 3 | 0 | 2 | 5 | 0 |
Table 5 displays a frequency distribution of food categories offered by food truck enterprises, showing the occurrences and percentages for each category. “Beverages and drinks” emerges as the most prominent category, comprising 39.5% of the data set, with 94 occurrences. “Burgers and sandwiches” rank second, representing 23.9% of the total. Conversely, “Healthy and Organic” and “Sushi and seafood” have lower frequencies, with only 1 and 3 occurrences, respectively, indicating a smaller market share. These trends suggest potential advantages for food truck businesses by focusing on popular categories to better meet customer preferences. The data also offers insights for menu development and marketing strategies to enhance business success.
4. Results and interpretations
4.1 Reliability and validity analysis
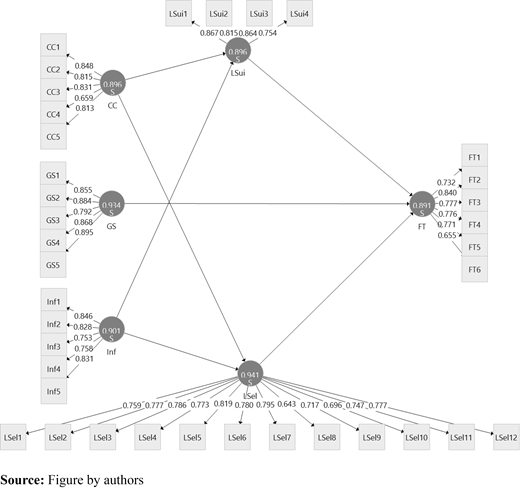
Table 6 displays the reliability and validity results for each item in the entire sample, with all loading values surpassing the threshold of 0.60. Various methods, including Cronbach’s alpha, composite reliability and average variance extracted (AVE) reliability, were used to ensure validity. The reliability values for Cronbach’s alpha range from 0.844 to 0.932, considered acceptable according to Tavakol and Dennick (2011), who suggest values between 0.70 and 0.95. Similarly, the minimum AVE value is 0.573, exceeding the minimum acceptable threshold of 0.50, and the minimum composite reliability (CR) value is 0.891, surpassing the acceptable threshold of 0.70, as indicated by Alarcón et al. (2015). Thus, both the less biased estimate of reliability (CR) and the level of variance represented by the construct (AVE) are considered acceptable. Figure 6 provides a graphical representation of the model and factor loadings.
Construct reliability and validity for CC, FT, inf, GS, LSel and LSui
| Variables | Questionlabels | Factorloadings | Cronbach’salpha | Compositereliability | Average varianceextracted (AVE) |
|---|---|---|---|---|---|
| CC | CC1 | 0.848 | 0.853 | 0.896 | 0.634 |
| CC2 | 0.815 | ||||
| CC3 | 0.831 | ||||
| CC4 | 0.659 | ||||
| CC5 | 0.813 | ||||
| FT | FT1 | 0.732 | 0.852 | 0.891 | 0.578 |
| FT2 | 0.840 | ||||
| FT3 | 0.777 | ||||
| FT4 | 0.776 | ||||
| FT5 | 0.771 | ||||
| FT6 | 0.655 | ||||
| InF | Inf1 | 0.846 | 0.862 | 0.901 | 0.647 |
| Inf2 | 0.828 | ||||
| Inf3 | 0.753 | ||||
| Inf4 | 0.758 | ||||
| Inf5 | 0.831 | ||||
| LSui | LSui1 | 0.867 | 0.844 | 0.896 | 0.683 |
| LSui2 | 0.815 | ||||
| LSui3 | 0.864 | ||||
| LSui4 | 0.754 | ||||
| LSel | LSel1 | 0.759 | 0.932 | 0.941 | 0.573 |
| LSel2 | 0.777 | ||||
| LSel3 | 0.786 | ||||
| LSel4 | 0.773 | ||||
| LSel5 | 0.819 | ||||
| LSel6 | 0.780 | ||||
| LSel7 | 0.795 | ||||
| LSel8 | 0.643 | ||||
| LSel9 | 0.717 | ||||
| LSel10 | 0.696 | ||||
| LSel11 | 0.747 | ||||
| LSel12 | 0.777 | ||||
| GS | GS1 | 0.855 | 0.911 | 0.934 | 0.739 |
| GS2 | 0.884 | ||||
| GS3 | 0.792 | ||||
| GS4 | 0.868 | ||||
| GS5 | 0.895 |
4.2 Discriminant validity
Discriminant validity was assessed using the criterion suggested by Fornell and Larcker, presented in Table 7. As per the criteria, each latent variable’s square root of AVE should exceed correlations with other latent variables. All values were significantly different from 1 according to the HTMT results in Table 8. The HTMT ratio of correlation indicates that all values are below the 0.95 threshold (Henseler et al., 2015), confirming the discriminant validity of reflective constructs.
Fornell–Larcker Criterion
| Food category | Food truckperformance | Culturalinfrastructure | Locationselection | Locationsuitability | Customerconvenience | Governmentsupport |
|---|---|---|---|---|---|---|
| Food truck performance | 0.788 | |||||
| Cultural infrastructure | 0.768 | 0.804 | ||||
| Location selection | 0.734 | 0.740 | 0.757 | |||
| Location suitability | 0.782 | 0.780 | 0.747 | 0.827 | ||
| Customer convenience | 0.664 | 0.630 | 0.699 | 0.619 | 0.797 | |
| Government support | 0.745 | 0.700 | 0.740 | 0.658 | 0.637 | 0.860 |
Heterotrait–monotrait ratio (HTMT)
| Food category | Food truckperformance | CulturalInfrastructure | Locationselection | Locationsuitability | Customerconvenience |
|---|---|---|---|---|---|
| Cultural infrastructure | 0.929 | ||||
| Location selection | 0.877 | 0.934 | |||
| Location suitability | 0.919 | 0.922 | 0.934 | ||
| Customer convenience | 0.780 | 0.733 | 0.785 | 0.727 | |
| Government support | 0.841 | 0.783 | 0.831 | 0.746 | 0.719 |
4.3 Total indirect effects
Total indirect effects in the original sample, along with statistics such as sample mean (M), standard deviation, t-statistics and p-values for two paths in the model, revealed that Customer Convenience (CC) has a 0.136 total indirect influence on Food Truck (FT) performance as presented in Table 9. This overall indirect effect is statistically significant (p-value = 0.002), indicating a statistically significant relationship. The total indirect effect of cultural infrastructure (Inf) on food truck (FT) is 0.399. This overall indirect effect is highly statistically significant (p-value = 0.000), and the t-statistic of 5.530 indicates a strong and meaningful relationship.
4.4 Path coefficients
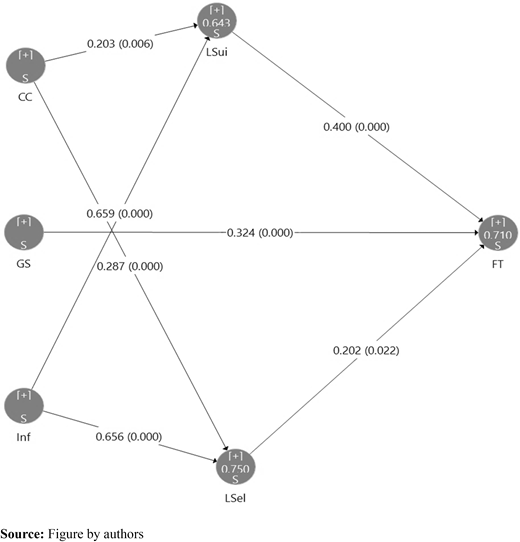
Path coefficients represent linear regression weights used to explore potential relationships between statistical variables. Table 8 presents the perceived values of these coefficients, determining the presence or absence of relationships based on p-values (typically p < 0.05), as outlined by Dahiru (2008). H1, indicating the relationship between customer convenience, location selection and suitability, is supported, with the p-value indicating significance. Similarly, H2 and H3, concerning cultural infrastructure and government support’s influence on food truck performance, are accepted based on acceptable f and t-values and p-values. Practitioners can use this Table 10, depicted in Figure 7, to guide their food truck business strategies based on hypothesis outcomes.
Path coefficients of all the variables involved in the study
| Variables | Original sample (O) | Sample mean (M) | SD | t-statistics | p-values |
|---|---|---|---|---|---|
| CC → LSel | 0.287 | 0.294 | 0.076 | 3.796 | 0.000 |
| CC → LSui | 0.203 | 0.209 | 0.073 | 2.776 | 0.006 |
| CC → LSel | 0.287 | 0.294 | 0.076 | 3.796 | 0.000 |
| CC → LSui | 0.203 | 0.209 | 0.073 | 2.776 | 0.006 |
| GS → FT | 0.324 | 0.327 | 0.081 | 4.027 | 0.000 |
| Inf → LSel | 0.656 | 0.647 | 0.079 | 8.355 | 0.000 |
| Inf → LSui | 0.659 | 0.649 | 0.079 | 8.337 | 0.000 |
| LSel → FT | 0.202 | 0.203 | 0.088 | 2.292 | 0.022 |
| LSui → FT | 0.400 | 0.393 | 0.073 | 5.507 | 0.000 |
Furthermore, in LSui → FT, a path coefficient of 0.400 (p = 0.000) indicates a positive relationship between location suitability and food truck success, as shown in Figure 7. This finding is significant as it highlights the direction and extent of location suitability’s influence on food truck performance. A coefficient of 0.400 signifies a moderately important positive correlation, suggesting that the overall success of food truck operations increases with the perceived desirability of the location. Therefore, location suitability plays a significant role in influencing food truck success in the studied context.
4.5 Specific indirect effects analysis
The indirect effect of cultural infrastructure (Inf) on food truck performance (FT) through location selection (LSel) was found to be 0.132 for the entire sample, with a statistically significant p-value of 0.027 and a t-statistic of 2.212 (Table 11). Similarly, customer convenience (CC) has an indirect impact of 0.081 on food truck (FT) through location suitability (LSui), with a significant p-value of 0.009 and a t-statistic of 2.618. Additionally, cultural infrastructure (Inf) through location suitability (LSui) has a substantial impact of 0.264 on food truck (FT), with a highly significant p-value of 0.000 and a t-statistic of 4.220. However, the indirect impact of customer convenience (CC) on food truck (FT) through location selection (LSel) is weaker or nonexistent, with a t-statistic of 1.847 and a non-significant p-value of 0.061.
4.6 Hypothesis analysis
Table 12 reveals significant relationships between variables, leading to the acceptance of hypotheses. The positive correlation between customer convenience (CC), location selection (LSel) and location suitability (LSui) is statistically significant, with p-values of 0.000 and 0.006, indicating that well-considered locations are linked to higher customer convenience. Government Support (GS) significantly influences food truck performance (FT) with a p-value of 0.000, confirming H2. cultural infrastructure (Inf) also has a significant impact on location suitability (LSui) and selection (LSel) with p-values of 0.000, supporting H3a and H3b. Furthermore, the correlations between Location Selection (LSel) and Food Truck Success (FT) and Location Suitability (LSui) and Food Truck (FT), with p-values of 0.000, confirm H4 and H5. These findings highlight the critical role of strategic location choices in food truck businesses’ performance and success in the UAE.
Comprehensive overview of hypotheses and their statistical analysis results
| Sr# | Hypothesis | Relationship | t-value | p-value | Status |
|---|---|---|---|---|---|
| 1 | H1a | CC → LSel | 3.796 | 0.000 | Accepted |
| H1b | CC → LSui | 2.776 | 0.006 | Accepted | |
| 2 | H2 | GS → FT | 4.027 | 0.000 | Accepted |
| 3 | H3a | Inf → LSel | 8.355 | 0.000 | Accepted |
| H3b | Inf → LSui | 8.337 | 0.000 | Accepted | |
| 4 | H4 | LSel → FT | 2.292 | 0.022 | Accepted |
| 5 | H5 | LSui → FT | 5.507 | 0.000 | Accepted |
4.7 Goodness of fit measures
The model fit assessment results indicate an acceptable alignment between the estimated model and the data, as shown in Table 13. Both the estimated model (0.071) and the saturated model (0.06) exhibit SRMR values within the recommended threshold (< 0.08), reflecting a strong fit (Henseler et al., 2015; Henseler and Sarstedt, 2013). Although the NFI values are slightly below the conventional cutoff of 0.9 (0.752 for the saturated model and 0.744 for the estimated model), they still indicate a reasonable model match. Additionally, while the d_ULS (3.594) and d_G (1.533) values for the saturated model are marginally lower than those of the estimated model (2.546 and 1.436, respectively), these differences are negligible and do not affect the overall model fit.
5. Discussion
The findings of this study offer several contributions to the literature on food trucks and the broader food service industry. The study investigated the impact of customer convenience (CC), cultural infrastructure (Inf) and government support (GS) on food truck (FT) performance in the UAE, examining their direct and mediated effects through location suitability (LSui) and location selection (LSel). While it is well-established that customer convenience positively influences service performance (Abd Majid et al., 2022; Shin et al., 2019), this research identifies unique dimensions of customer convenience specifically within the food truck context. Unlike traditional food service establishments, where convenience may be linked primarily to menu offerings or dining experiences, the research reveals that for food trucks, customer convenience is more closely tied to location suitability. The study finds that food truck success significantly relies on attributes such as accessibility and visibility, which directly impact customer satisfaction and loyalty (Shin et al., 2019; Pappas, 2016). This suggests that food trucks need to prioritize the optimization of their locations to better serve their customers, a focus that may differ from more fixed-service businesses.
Additionally, the study investigated the role of customer convenience (CC) in enhancing food truck (FT) performance, particularly through its indirect effect via location selection (LSel). While the analysis confirmed a significant indirect influence of CC on FT performance through location suitability (LSui) (p-value = 0.009), the hypothesis regarding the indirect effect through location selection was not supported (p-value = 0.061). This indicates that customer convenience impacts performance more through the suitability of a location rather than the selection process itself. Consequently, food truck operators should focus on optimizing location attributes like accessibility and visibility to meet customer needs rather than solely targeting high-traffic areas. These findings align with stakeholder theory, highlighting the importance of prioritizing customer convenience (Arikan et al., 2016).
Furthermore, the study highlights the essential role of cultural infrastructure quality in food truck performance and success. Well-designed and equipped food trucks positively impact customer perception and satisfaction (Eldardiry, 2023), with cultural infrastructure indirectly affecting success through location suitability and selection mediation (p-value: 0.000). Analysis of total and specific indirect effects provides deeper insights into the intricate interplay of variables. The study supports previous research emphasizing factors such as foot traffic, customer flow and accessibility to public transportation in selecting optimal locations (Cervero et al., 2017; Rietveld and Bruinsma, 2012). Cultural infrastructure is essential for food truck success, shaped by local income levels, culinary preferences, residential density, tourist presence and demand for specific cuisines.
The study finds that location suitability and selection mediate the impacts of customer convenience and cultural infrastructure on food truck business success, with significant p-values of 0.000 and 0.022, respectively. Investing in efficient infrastructure enhances operational effectiveness and customer satisfaction, making it crucial for attracting more customers (Alfiero et al., 2017; Sobaihi, 2020). Location selection is a critical decision influenced by factors such as proximity to customers and convenience.
Government support (GS) significantly and directly influences food truck business success (p-value: 0.000), aligning with previous research emphasizing the positive impact of supportive policies and legislation on the industry’s expansion and long-term viability (Alfiero et al., 2017; Sobaihi, 2020). Regulatory frameworks supporting food truck entrepreneurs’ expansion and creativity are crucial for fostering growth and mitigating regulatory burdens. Expedited licensing and permit processes, facilitated by government assistance, contribute to ensuring safety, a priority for food truck owners.
The study highlights the vital roles of customer convenience (CC), cultural infrastructure (Inf) and GS in improving food truck performance and success. These insights provide practitioners with valuable guidance for strategic decision-making, enabling them to prioritize the elements that are essential for optimizing their business operations. The research suggests a promising future for the food truck market in the UAE, emphasizing the importance of marketing techniques like social media, celebrity chefs, fresh goods and a narrative of uniqueness and creativity to enhance appeal.
6. Conclusion
This study significantly contributes to the understanding of the UAE food truck industry by addressing a notable gap in the existing literature. By focusing on the unique cultural, economic and regulatory factors influencing this sector, the research provides insights that are particularly relevant to the UAE context. Key findings highlight customer convenience, cultural infrastructure, government support and location selection as critical drivers of food truck performance.
The findings also emphasize that efficient ordering processes and rapid service emerge as essential components for success, while strategic placement in high-traffic areas enhances accessibility and customer engagement. Additionally, factors such as cultural infrastructure, foot traffic and proximity to residential areas significantly influence sales and customer interaction, highlighting the necessity for strategic site selection. Moreover, government support is vital for food truck success, providing low crime rates, surveillance, security personnel, theft prevention and ensuring compliance with health and safety regulations. From a management standpoint, food truck operators should foster strong relationships with local authorities to ensure regulatory compliance and access to government support programs.
Overall, this research not only fills a critical gap but also offers practical implications for entrepreneurs and policymakers. By outlining specific success factors for food trucks in the UAE, the study serves as a valuable resource for stakeholders aiming to enhance the food truck industry’s contribution to the local economy and cultural landscape.
7. Future research
Future studies could build on these findings by examining the role of marketing strategies, such as social media and branding, in driving customer engagement and loyalty within the UAE’s food truck sector. Additionally, investigating consumer behavior and preferences could offer deeper insights into factors influencing repeat visits. Regional comparisons between urban and rural settings, or across different emirates, could reveal how location impacts food truck success. Further research could also explore the adoption of sustainability practices and their effects on customer perceptions and business performance.
Author contributions
Khaula Alkaabi, Project Supervision, Conceptualization, Funding acquisition, Project administration, Resources, Supervision, SPSS Software, FLIR, Data curation, Writing and Editing, Review and Verification. Kashif Mehmood, Methodology, Data curation, Formal analysis, Investigation, SPSS Software, Visualization, Writing – Original draft, Editing, Revising, Formatting.
The author appreciates UAE University and the dedicated research assistants for their active participation in the project.
Funding: This research was funded by the Research Office at the United Arab Emirates University, UPAR Grant # G00003738, 2022; and Strategic Research Program – Emirates Center for Mobility Research G00004542, 2024.
Institutional Review Board statement: The study was conducted in accordance with the Declaration of Helsinki and approved by the Institutional Review Board (or Ethics Committee) of United Arab Emirates University (protocol code ERSC_2023_3388, 2023).

