

This paper analyzes previously unmeasured effects of a response to a service incident called “benevolent” within the customer –firm relationship.
A questionnaire was administered to telecommunication customers in a Western European country, and the model was estimated using partial least squares (PLS).
This study shows that the customer–firm relationship is surprisingly affected by the response to expected incidents that the customer interprets as acts of benevolence or opportunism. This research also shows that the firm's incident response interpreted as benevolence or opportunism has an effect that merely positive or negative events do not. Acts of benevolence response towards an incident positively affect customer–firm relationship quality, and expectations of such acts may lead to an upward spiral in customer commitment.
While benevolence trust has been proposed and studied before, the response to incidents interpreted as benevolent or opportunistic and their consequences have been under-studied, hence exhibiting a research gap.
在公司與顧客之間的關係的範疇內, 公司對服務事故所作的被稱為仁慈的反應的影響不曾被測量; 本研究擬就該反應的影響進行分析和探討。
研究以問卷方式進行¸ 對象為一個西歐國家裏的電訊服務客戶。研究人員使用偏最小平方法作估算, 設計有關的模型。
研究結果顯示、若顧客對公司就預期的事故所作的反應看作是仁慈的話, 又或相反地視為是投機主義所驅使的, 則公司與顧客之間的關係會出人意表地受到影響。研究結果亦顯示、顧客的仁慈、抑或是投機主義的闡釋和理解所帶來的影響, 與單純積極正面事件或消極負面事件所帶來的影響是不一樣的。公司對事件仁厚的回應會給予顧客之間的關係的質量帶來正面的影響; 而且, 對這種回應的預期、或會給客戶承諾帶來螺旋上升。
對仁厚之信賴曾被提出並作探討。唯對被視為仁慈的或機會主義作祟的反應所作的研究則不足, 這方面實存研究缺口。
Introduction
In product exchange, the stakeholders start to interact in relationships. The energy and closeness of a relationship between two parts are referred to as relationship quality (Tajvidi et al., 2021). In a business context, relationship quality is related to the level of trust, satisfaction and commitment between a firm and a customer (Xie et al., 2017), leading to successful relational exchanges. Relationship marketing research has found that a positive relationship between the firm and a customer will reduce uncertainty, increasing exchanges between parts guided by relational norms (Gummesson, 2017; Steinhoff et al., 2019). High-quality relationships between parts have become deeply relevant for firms in achieving success.
Recently, relationship quality has been under the interest of researchers. For instance, Tajvidi et al. (2021) aimed to understand the factors that affect consumers' intention to engage in co-creation activities, with results revealing that interactivity between stakeholders positively affects social support. Chi et al. (2020) investigated the relationship between customers and the firm from a social perspective, concluding that customer perceptions contribute to evaluating service quality. Boonlertvanich (2019) studied the causal relationships between service quality, customer satisfaction, trust and loyalty, finding that service quality affects attitudinal behavioral loyalty.
Although there is a growing body of literature exploring the relationship quality between firms and customers, no study aimed to understand the impact of the customer perception of an incident and the firm's response towards such incident being interpreted as benevolent or opportunistic on the consequences to the relationship quality between these parts. Given the recent importance given to academia to this subject and the importance of understanding how an incident impacts the customer–firm relationship, this study aimed to uncover the impact of a service incident and the firm's benevolence response and surprise on the relationship quality between the parties. An incident can be defined as an unexpected event that provokes the degradation of the quality of service (Ho et al., 2020). The firm’s act of benevolence facing an incident is interpreted by a customer as an indication of caring and willingness to sacrifice its outcomes (Fazal-e-Hasan et al., 2020). The obverse of benevolence is opportunism, which is also addressed in this study. Data were collected from 224 individuals who lived at least a service incident during the previous year to achieve this purpose. Using partial least squares (PLS) for data analysis, we enriched the relationship quality between firms and customers.
Theoretical background
Relationship quality theory
Relationship quality aims to capture and keep customers through the close connection between service relationships to organizational outcomes (Macintosh, 2007), based on the premise that the customers' evaluation of the service performance has a significant impact on the customers' satisfaction and retention. The relationship quality theory consists of three constructs (Tajvidi et al., 2021): trust, satisfaction and commitment. These are the attributions made by customers regarding events that occur in a firm–customer relationship. An extensive literature has been attempting to explain customer satisfaction, trust and commitment. Customer satisfaction has been studied as a central variable in marketing outcomes (Makanyeza et al., 2016; Xu and Li, 2016) in recent years (El-Adly, 2019; Lucini et al., 2020; Rita et al., 2019) and is defined as the emotional evaluation of the firms' performance (El-Adly, 2019). Trust and commitment have been two central constructs of interest since marketing began to consider relationships central to profitability (Dawson et al., 2017; Goutam and Gopalakrishna, 2018). Trust refers to the compliance to rely on a business partner in a relationship based on confidence (Iglesias et al., 2020), while commitment is the wish to maintain a relationship (Keiningham et al., 2017). One can say that supplier performance (Sáenz et al., 2018), mutual dependence, attributions, expectancies, disconfirmations, perceptions of equity (Oliver and DeSarbo, 1988), perceived value (Agustin and Singh, 2005), and other constructs affect satisfaction, trust and commitment.
Expectation and disconfirmation
Superior performance can lead to high levels of customer satisfaction, influencing the relationship between the customer and the firm (Martinaityte et al., 2019). Performance is constituted of positive, negative and neutral events. Positive events contribute to incremental relationship development, whereas adverse events can dramatically impact a relationship. Moreover, how the firm deals with the client regarding those events will also determine the relationship quality. Such relationship events disconfirm relational expectations (positive or negative) (Harmeling et al., 2015).
Over time, a series of merely satisfactory transactions with a product can increase satisfaction and commitment (Harmeling et al., 2015). However, expectations and their disconfirmations play a prominent role in satisfaction judgments (Bravo et al., 2017). Expectations are positively related to satisfaction. Positive disconfirmations (pleasant surprises) raise satisfaction, whereas negative disconfirmations lower it. Unexpected incidents cause an “updating” in satisfaction, while incidents within expectations cause little change (Mattila, 2003). The key to satisfaction change is the “disconfirmation of expectations” experience.
However, expectations are in constant flux, adjusted by events like experiences with the product or supplier, marketing communications and changing awareness of alternatives (Payne et al., 2017). Positive and negative disconfirmations affect satisfaction and make adjustments in expectations, which in turn affect repurchase intentions or commitment in a service context (Yi and La, 2004). A pleasant surprise makes a customer more satisfied and raises expectations about the supplier, leading to repurchase intentions. An unpleasant surprise has the opposite effect. Cai and Chi (2021) discussed the implications of these effects, which may be that raising expectations only sets up the firm for later negative disconfirmation experiences by its customer base.
Finally, as Howard and Barry (1990) evidenced, an unexpected and favorable event (winning a prize, in their experiment) tends to shift evaluations of a product from being based on the attributes of that product to the effect generated as a result of the pleasant surprise. This suggests that a firm might positively evaluate consumers with astutely chosen positive surprises. Managing customers' expectations of future benefits is the basis of positive customer emotion and is crucial to their satisfaction and commitment (Hsieh and Yuan, 2021).
Benevolence and opportunism
Benevolence in response to an incident is an action that firms can use to help strengthen customer relationship quality. The act of benevolence implies genuine caring and kindness towards a customer, resulting in feelings of respect, indebtedness, respect and liking (Hiller et al., 2019). Ganesan and Hess (1997) distinguished credibility trust and benevolence trust, where the former is an assessment of how a firm will deliver on its promises in the future, and the latter is an assessment of the degree it cares about the customer and is willing to make sacrifices for the customer. Opportunism is the obverse of benevolence and is the assessment by the customer that the firm does not care about the customer and will take advantage of the relationship (thus making the customer sacrifice for the benefit of the firm) if the opportunity presents itself. Opportunism is defined as “self-interest seeking with guile” (Paswan et al., 2017). The customer observes the act of a firms' opportunism as deceitful behavior.
Generally, benevolence is the firms' initiative to advocate for customers' well-being to avoid disadvantageous circumstances (Nguyen, 2016). It informs customers that the firm has pro-customer actions facing an incident. Although benevolence towards an incident may lead to a financial loss, it leads to customer trust and increases relationship quality (Aljarah, 2020). Moreover, benevolence has an impact on increasing customer trust and commitment. Trust is considered crucial for decision-making in risky situations since customers' reluctance is determined by a lack of trust in the firm (Chaouali et al., 2016; Svare et al., 2020). Customer commitment generates satisfaction, increases relationship quality and results in the customers' preference for the brand, vetoing competitors (Béal and Sabadie, 2018). Customer commitment can be most effectively built through acts that the customer perceives as coming from a benevolent firm.
Positive, negative, benevolent and opportunistic response to an incident
Positive and negative incidents have been studied in the context of service failures; the most significant effect of adverse incidents over positive ones is well-known (e.g. Allen et al., 2019; Tontini et al., 2019). Incidents have an irregular impact on the relationship strength, whether positive or negative (Allen et al., 2020). From the customers' point of view, a positive incident benefits the customer. However, a negative incident reveals as a cost to the customer. Although it would be expected that a negative incident would lower the relationship strength, literature has speculated that customers understand and forgive when a first negative experience occurs (Christodoulides et al., 2021; Tsarenko and Rooslani Tojib, 2011).
In addition, very little has been done to understand the impact of a firms' response considered benevolent or opportunistic to an incident caused to the relationship quality between the parties. Nevertheless, the act of benevolence usually results in forgiveness (Sajtos and Chong, 2018) and an opportunistic act turns into revenge and avoidance (Grégoire et al., 2009).
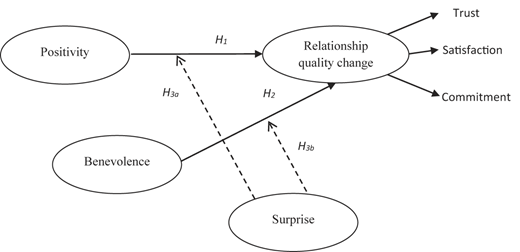
Conceptual model and hypotheses
Our model is based on specific service incidents. We consider the effect of an incident on the change in the relationship quality (trust, satisfaction and commitment) between the customer and the firm (Tajvidi et al., 2021). We hypothesize that the positivity or negativity of an incident and the benevolence or opportunism of the firm's response to that incident affect relationship quality. However, the extent of the surprise, or expectancy-disconfirmation of the incident, may produce a curious effect (Harmeling et al., 2015). In other words, under conditions of great surprise, the positivity/negativity of the incident may have an enhanced effect on relationship quality. However, the effect on relationship quality of the benevolence/opportunism attributed to the firm's response to the incident may not be significantly enhanced. The situation is exactly reversed when the surprise is low: the positivity/negativity of the incident has a more negligible effect on relationship quality, but benevolence/opportunism response might have a more enhanced effect on relationship quality.
Constructs and definitions
Relationship quality
Grounded on relationship quality theory, we refer to customer-perceived changes in the three central relationship quality variables (satisfaction, trust and commitment) as a second-order construct called “relationship quality.” While these constructs have different roles in understanding a relationship (El-Adly, 2019; Iglesias et al., 2020; Keiningham et al., 2017), we consider them as common indicators of a higher-level construct that indicates the relationship quality between the customer and the firm. This is a broad-brush approach to relationship quality that later research may articulate into different effects.
Positivity
This is defined as the customer's perception of the extent of the positivity or negativity of an incident.
Benevolence
Based on the incident, this is the extent to which the customer attributes the firm's response as benevolent or opportunistic.
Surprise
This is the extent to which the customer's expectations were confirmed or disconfirmed.
Research hypotheses
From the customers' point of view, the quality of the relationship between customer and firm is very much a forward-looking construct mainly based on the past behavior of the firm and the attributions made to it. When consumers consider whether they will continue to do business with the firm, they project its behavior into the future. Has the firm behaved satisfactorily in the past? Can the customer infer that it is trustworthy? Would it take advantage of the customer? Shall the customer continue to do business with it or survey the market for another supplier? Furthermore, answers to these questions are dynamic, changing over time as incidents accumulate.
Positive and negative incidents have an irregular impact on relationship quality. Positive incidents reveal a benefit for the customer, leading to a positive affective reaction (Ramseook-Munhurrun, 2016; Zhu et al., 2019). In turn, a firms' benevolence response towards an incident indicates that the firm is concerned with the well-being of its customers (Nguyen, 2016). This approach also leads to a positive affective reaction from the customer. Therefore, we hypothesize that:
The positivity of an incident positively influences the relationship quality.
The benevolence response towards an incident influences the relationship quality.
Nonetheless, there is a moderating effect of surprise or expectancy-disconfirmation of the incident. Usually, a positive incident is good for the relationship, while a negative incident is not. However, if it does not surprise the customer, it is just standard good or bad service.
A positive incident that surprises the customer indicates that more excellent performance may be expected in the future (Lenz et al., 2017), thus enhancing the relationship quality. A surprising failure is an indication that poorer service may be expected (Endrikat, 2016), thus lowering the relationship quality.
Notwithstanding, when the customer faces a surprising positive incident, a twofold enhancement of the relationship quality occurs (Sajtos and Chong, 2018) since the positive incident alone would have an enhanced effect on the relationship quality, increased by the surprising effect.
In turn, facing a surprising negative incident, the customer would feel doubly frustrated, negatively influencing the relationship quality.
Thus, we hypothesize:
Higher levels of surprise facing an incident will positively influence the relationship quality.
The act of benevolence regarding a firms' incident will increase the relationship quality (Nguyen, 2016). However, when the firm promotes the element of surprise, it would be expected that the relationship quality would have a double effect, increasing the relationship quality. In turn, if the firms' act facing the incident is viewed as opportunistic and surprising, the opposite double effect will occur (Paswan et al., 2017). However, if the opportunistic act is not a surprise, we can expect resignation toward the relationship and hatred toward the firm. In addition, one can expect the consumer to minimize contact with the firm, but each additional incident will confirm the customer's powerlessness afresh (Bunker and Ball, 2009), leading to further declines in relationship quality. So, we hypothesize:
Higher levels of surprise facing a benevolent response towards an incident will influence the relationship quality.
Figure 1 presents the conceptual model and the associated research hypotheses that will be tested.
Research methodology
Data collection
The quantitative research phase of this study was conducted by administering a questionnaire, through computer-assisted telephone interviewing, to telecommunication customers (mobile phone and cable TV customers) in a Western European country. Respondents were randomly selected through random digit dialing using the ranges of all available mobile and landline telephone numbers. After being identified as a customer of one of the telecommunication companies, the interviewees were asked about at least one service incident during the previous year. Only customers with specific and identifiable service incidents were selected to be interviewed.
After identifying service incidents, the questionnaire queried the respondents' perception regarding the characteristics of the incident, including positivity, level of benevolence-opportunism in the response towards such incident, level of surprise (expect-non-expected) and attributions made by the respondent. The questionnaire also queried clients' perceptions of the incident's relationship quality.
The sample was stratified by industry (mobile and cable TV) and by type of service incident and response (positive, negative, benevolent and opportunistic) to guarantee an adequate sample size for each group. Along with the type of incident, a detailed description was collected. After data collection, the detailed description of all incidents was facially validated by independent marketing academics and telecom professionals. All records whose incidents were not found adequately described or did not correspond to the type of incident selected by the customer were discarded. This resulted in discarding 30 records. The sample size was 224 individuals (119 mobile telecommunication customers and 105 cable TV customers). All groups corresponding to the types of incidents and responses were also well represented (57 observations with positive non-benevolent incidents, 54 with negative non-opportunistic incidents, 70 with benevolent incidents and 43 with opportunistic incidents).
The socio-demographic characteristics of the respondents are presented in Table 1. The socio-demographic profile is consistent with the known structure of the population and was validated by industry managers as consistent with industry data.
Sample characteristics
| (%) | |
|---|---|
| Gender | |
| Male | 51.8 |
| Female | 48.2 |
| Age of respondent | |
| <30 years | 23.7 |
| 30–39 years | 21.4 |
| 40–49 years | 18.8 |
| ≥50 years | 34.4 |
| Missing | 1.8 |
| 100.0 | |
| Education level of respondent | |
| Basic education or less | 13.4 |
| High school education | 46.4 |
| University education | 37.5 |
| Missing | 2.7 |
| 100.0 | |
| Occupation of respondent | |
| Employer | 2.7 |
| Self-employed | 8.9 |
| Worker on behalf of others | 55.8 |
| Unemployed | 4.0 |
| Housewife | 3.6 |
| Retired | 10.3 |
| Student | 12.1 |
| Missing | 2.6 |
| 100.0 | |
Measures
The questionnaire construction design followed the methodological approach of Malhotra (2019). First, exploratory research, through a focus group, was applied to university students who were customers of the selected industry and experienced at least one incident. Through a semi-structured approach, we aimed to understand how people experienced service incidents, how they distinguished them, the most relevant characteristics of each incident, their interpretation of the firm's response towards the incident, and if such incidents and responses affected their relationship with the supplier. According to the results obtained in the first stage, the incidents were classified into four groups on a second stage. This stage led to a preliminary version of the scales. A qualitative pre-test was conducted through a pilot survey directed to 28 customers of both industries on a third stage. Minor refinements were introduced in the phrasing and order of the questions and the filtering of the questionnaire. In the fourth stage, the final version of the questionnaire was presented to academia and industry independent experts (expert judgment), who validated it. Other forms of validity (convergent, discriminant and nomological) were also accessed.
All constructs in the proposed model (positivity of the incident, level of benevolence-opportunism in the response, surprise and customer–firm relationship change) were based on reflective multi-item scales. All indicators were measured with a ten-point rating scale, with one representing the lowest and ten the highest. Table A1 of Appendix presents a detailed list of indicators used in the measurement model.
Indicators of the measurement model
| Construct | Measure | |
|---|---|---|
| Positivity | x11 | Using a scale from 1 to 10, where 1 means “very negative” and 10 means “very positive”, how do you classify the event that you mentioned? |
| x12 | Using a scale from 1 to 10, where 1 means “very unpleasant” and 10 means “very pleasant”, how do you evaluate the event that you mentioned? | |
| Benevolence | x21 | In what way do you think that this event shows that the service provider cares or does not care about you as a customer? Using a scale from 1 to 10, where 1 means “service provider does not care about you as a customer” and 10 means “service provider has a genuine concern with you” |
| x22 | In what way do you think that this event shows that the service provider cares or does not care about keeping you as a customer? Using a scale from 1 to 10, where 1 means that the “service provider just cares the profits and does not care about keeping me as a customer” and 10 means “service provider cares in keeping me as a customer and does not just care about the profits” | |
| Surprise | x31 | Using a scale from 1 to 10, where 1 means “nothing surprised” and 10 means “very surprised”, how did this event surprise you? |
| x32 | Using a scale from 1 to 10, where 1 means “very expected” and 10 means “very unexpected”, how expected (unexpected) do you consider the behavior that caused this event? | |
| Relationship quality change | y11 | Using a scale from 1 to 10, where 1 means “a very negative way” and 10 means “a very positive way”, how do you classify the way this incident affected your trust in the service provider? |
| y12 | Using a scale from 1 to 10, where 1 means “a very negative way” and 10 means “a very positive way”, how do you classify the way this incident affected your satisfaction with the service provider? | |
| y13 | Using a scale from 1 to 10, where 1 means “a very negative way” and 10 means “a very positive way”, how do you classify the way this incident affected your loyalty to service provider as a customer? | |
Estimation
The structural model consists of three latent variables (Figure 1). The model was estimated using the complete dataset (n = 224) of telecommunication customers and four subgroups. The first two subgroups represented a split of the data set by industry: mobile telecommunications and cable TV. The other two subgroups were obtained by dividing the original data set into customers with a high (above average) level of surprise (unexpected incidents) and a low (below average) level of surprise (expected incidents). These two segmentations were used for subgroup analysis (Arnold, 1982; Kohli, 1989; Sharma et al., 1981) to assess the moderating effects of industry and level of surprise on the model structure. The contrast between high and low surprise groups is evident in Table 2, which shows each group's mean and standard deviation of surprise indicators.
Means and standard deviations in high and low surprise groups
| Construct | Indicators | High group | Low group | ||
|---|---|---|---|---|---|
| Mean | Std. dev | Mean | Std. dev | ||
| Surprise | y31 | 8.27 | 1.54 | 5.09 | 2.25 |
| y32 | 8.26 | 1.43 | 4.65 | 2.17 | |
The model was estimated using PLS. This option is mainly motivated by the nature of the data (Hair et al., 2017). We measure categorical variables with an unknown non-normal frequency distribution, which is usually negatively skewed. In this context, PLS can be a preferable alternative to the use of maximum likelihood methods, comparisons between maximum likelihood methods, and PLS can be found in the studies by Fornell and Bookstein (1982), Dijkstra (1983), Chin (1998) and Vilares et al. (2010). All data analyses were done using SmartPLS and SAS system.
Table 2 presents both means and standard deviations in high and low surprise groups.
Analysis
Descriptive analysis
Means and standard deviations of original variables can be found in Table 3. The dataset means varied between 5.83 for x11 (how positive–negative the customer considers the event) and 6.79 for x31 (how much the event surprised the respondent). The highest means were found in surprise indicators and the lowest in positivity construct. Standard deviations varied between 2.47 for x31 (how much the event surprised the respondent) and 3.24 for x12 (how pleasant-unpleasant the customer considers the event). Surprise indicators were the ones that globally showed the lowest variability. Although the means for most of the measures were located just slightly to the right of the center of the scale, suggesting a slightly negatively skewed distribution, the standard deviations suggest a large variability in all indicators associated with a non-normal distribution.
Means, standard deviations and standardized loadings of manifest variables
| Construct | Indicators | Telecom | ||
|---|---|---|---|---|
| Mean | Std. deviation | Loading | ||
| Positivity | x11 | 5.83 | 2.81 | 0.970*** |
| x12 | 5.86 | 3.24 | 0.970*** | |
| Benevolence | x21 | 5.85 | 2.81 | 0.970*** |
| x22 | 6.21 | 2.72 | 0.972*** | |
| Surprise | x31 | 6.79 | 2.47 | – |
| x32 | 6.58 | 2.56 | – | |
| Change in relationship | y11 | 5.97 | 2.89 | 0.968*** |
| y12 | 6.00 | 2.96 | 0.979*** | |
| y13 | 6.20 | 2.83 | 0.956*** | |
Note(s): ***Significant at < 0.001 level
Reliability and validity
We started by examining the model constructs' reliability and convergent validity measures (Table 4). All Cronbach's alphas (Cronbach, 1951) exceeded the 0.7 thresholds (Nunnally, 1978) and were consistently higher than 0.93. Without exception, latent variable composite reliabilities (Werts et al., 1974) were higher than 0.96, showing a high internal consistency of indicators measuring each construct and thus confirming construct reliability. The average variance extracted (AVE) (Fornell and Larcker, 1981) was equal to 0.94 for the three constructs, indicating that the variance captured by each latent variable was significantly larger than variance due to measurement error, thus demonstrating a high convergent validity of the constructs. Computing standardized loadings also confirmed the reliability and convergent validity of the measurement model for indicators (Table 3) and Bootstrap t-statistics for their significance (Anderson and Gerbing, 1988). All standardized loadings significantly exceeded the 0.7 thresholds, and they were found, without exception, significant at a 0.1% significance level, thus confirming a high convergent validity of the measurement model.
Reliability and validity measures
| Constructs | Telecom | ||
|---|---|---|---|
| Cronbach's alpha | Composite reliability | Average variance extracted | |
| Benevolence | 0.94 | 0.97 | 0.94 |
| Positivity | 0.94 | 0.97 | 0.94 |
| Satisfaction | 0.97 | 0.98 | 0.94 |
Discriminant validity was assessed, determining whether each latent variable shared more variance with its measurement variables than other constructs (Chin, 1998; Fornell and Bookstein, 1982; Fornell and Larcker, 1981). By comparing the square root of the AVE for each construct with the correlations with all other constructs in the model (Table 5), we could observe that the square roots of AVE were consistently higher than the correlations between constructs. This fact allowed us to conclude that all the constructs showed evidence for acceptable validity. Discriminant validity was also assessed at the indicator level, comparing its construct with all possible cross-loadings (Gefen and Straub, 2005). All loadings were found more significant than the respective cross-loadings over all other constructs, thus confirming discriminant validity at the item level.
Correlations between latent variables and square roots of average variance extracted
| Telecom | |||
|---|---|---|---|
| Positivity | Benevolence | Satisfaction | |
| Positivity | 0.97 | 0.83 | 0.87 |
| Benevolence | 0.97 | 0.87 | |
| Satisfaction | 0.97 | ||
Note(s): Numbers shown in italic face denote the square root of the average variance extracted
We used an unrelated theoretical construct to assess possible standard method bias, measured using the same scale as the research indicators. Category involvement with restaurants was used as a marker variable. A high correlation between the study's focal construct (customer–firm relationship) and the marker construct would indicate common method bias as they should be theoretically non-correlated. The correlation between category involvement and customer–firm relationship was 0.15, showing no evidence of common method bias. Additionally, this marker construct was included as an antecedent of the customer–firm relationship in our structural model. The estimated effect (0.05) was not significant at the 5% significance level. In summary, these tests suggested that common method bias was not involved in the study's results.
Model estimation
Table 6 shows results of model estimation for the global telecommunications sample as well as for the two industry subgroups (mobile telecommunications and cable TV) and the two surprise subgroups (low surprise (expected) incidents and great surprise (unexpected) incidents). The proposed model showed a high explanatory power for relationship quality, with a determination coefficient (R2) of 0.83 for the global sample. The R2 was always higher than 0.78 (low surprise group) at the subgroup level, with a maximum of 0.87 (high surprise group). Globally, results showed an excellent explanatory power consistent among subgroups and therefore provided strong support for the nomological validity of the proposed model.
Unstandardized parameter estimates
| Sample type | Benevolence | Positivity | Global significance | |||
|---|---|---|---|---|---|---|
| Parameter estimate | t-statistics | Parameter estimate | t-statistics | Adj. R2 | F statistics | |
| Total telecom sample | 0.47 | 7.71 | 0.48 | 7.93 | 0.83 | 549.07 |
| High surprise | 0.35 | 4.59 | 0.61 | 8.29 | 0.87 | 407.33 |
| Low surprise | 0.59 | 6.54 | 0.35 | 3.72 | 0.78 | 183.59 |
| Mobile | 0.50 | 6.07 | 0.46 | 5.61 | 0.84 | 306.21 |
| Cable TV | 0.44 | 4.51 | 0.50 | 5.24 | 0.82 | 238.56 |
Table 6 presents parameter estimates of the proposed model and respective significances. For the global sample, we can observe that the path coefficient estimates for positivity (0.48) and benevolence (0.47) were highly significant at (p < 0.001) in explaining relationship quality. Therefore, hypotheses H1 and H2 were fully supported. Both positivity of the incidents and the level of perceived firm's benevolence towards the incident affected customer–firm relationships in the same magnitude. This result aligns with Ramseook-Munhurrun (2016) in their research on customers' waiting for experiences in service encounters, concluding that customers seem to be pleased and happy when there is a firm's benevolent reaction towards an incident. Moreover, the influence of the firms' benevolence on the relationship quality is confirmed by Nguyen (2016), who suggested that benevolence enhances customer loyalty.
A subgroup analysis by industry (mobile and cable TV) was also performed to validate the estimated model structure. Results showed that positivity and benevolence effects were significant in both segments. Both positivity and benevolence showed significant effects on relationship quality in both industries. The effects of positivity were 0.46 and 0.50 for mobile and cable TV, respectively, while benevolence effects were 0.50 and 0.44. To assess the stability of the model structure in both subgroups, we performed a Chow test (Chow, 1960) (Table 6). When comparing mobile and cable TV customers, the Chow test (F value 0.24, p = 0.78) provided no evidence that the forms and slopes of the two models were significantly different. So, evidence showed that the effects of positivity and benevolence remained significant and that the structure of the model was consistent in both industries.
Furthermore, the model explanatory power was similar in both industries, supporting H1 and H2. This result is aligned with the work of Sajtos and Chong (2018) that examined the benevolent outcome of service failures in six different experimental conditions. This suggests that the firm's benevolence towards an incident positively affects the relationship quality in multiple contexts. When the act of the firm is seen as opportunistic facing a firm's incident, the client may respond with acts of revenge or avoidance (Grégoire et al., 2009), resulting in a decrease of the relationship quality between the parts regardless of the context.
A subgroup analysis for customers experiencing a low and high level of surprise incidents was performed to assess the moderating effect of surprise on positivity and benevolence on relationship quality and test hypotheses H3a and H3b (Cf. Table 7).
Subgroup analysis
| Groups | Benevolence | Positivity | Global significance | ||
|---|---|---|---|---|---|
| Between groups difference | t-statistic | Between groups difference | t-statistic | Chow test (F) | |
| Industry (mobile – TV) | 0.06 | 0.47 | −0.04 | −0.32 | 0.24 |
| Level of surprise (high – low) | −0.24 | −2.03* | 0.26 | 2.19* | 3.48* |
Note(s): *Significant at < 0.05 level
The Chow test (F value 3.48, p < 0.05) provided evidence that the forms and slopes of the two models were significantly different in high and low surprise groups (see Table 6). To assess statistical differences in individual effects (for positivity and benevolence), we used unpaired t-tests. The t-test for positivity (difference 0.26, t value 2.19) and the firm's benevolence towards the incident (difference −0.24, t value 2.03) was both significant at p < 0.05, hence providing evidence that individual effects were different in both groups and supporting hypotheses H3a and H3b. These results are in line with previous findings. When a company is inherently associated with negative actions and engages with meaningful activities, it creates a positive surprise, affecting the relationship quality (Lenz et al., 2017; Schepers et al., 2012). In turn, the aggregated effect of benevolence and surprise will promote a double positive effect on the customer, increasing relationship quality (Nguyen, 2016).
The estimated effect of positivity on relationship quality was 0.61 in the high surprise group and 0.35 in the low surprise segment. Also, the difference of estimated benevolence response effect between high and low surprise groups was significant, with the effect of 0.35 for the high surprise group and 0.59 for the low surprise group. Therefore, we have strong evidence of a moderating effect of the level of surprise associated with service incidents over the positivity relationship quality and the benevolence-response quality effects. The effect of positivity was more significant for unexpected incidents, while a benevolence response towards an incident was more significant when expected. Meaning that positive unexpected incidents provoke satisfaction, confirming the results of previous studies (Cai and Chi, 2021; Yi and La, 2004). An unexpected positive incident may reflect itself in higher expectations about the firm that may lead to customer loyalty and repurchase intentions. The same happens when a firms' benevolent response to an incident is expected. The firm, by sacrificing its short-term outcomes in favor of the customer will lead to forgiveness (Sajtos and Chong, 2018) and help strengthen customer relationship quality (Hiller et al., 2019). Moreover, the benevolence act in response to a firms' incident will increase customer trust and commitment (Chaouali et al., 2016; Svare et al., 2020).
To further understand the role of incidents' surprise level in explaining the customer–firm relationship quality, we revised our structural model, including the surprise construct as an antecedent of relationship quality. The effect of surprise on the focal construct was −0.045 and was found non-significant (p > 0.05), supporting that the level of surprise associated with service incidents acted as a pure moderator of the relationships between positivity, benevolence and relationship quality.
Conclusion
This research was motivated by the existing ambiguity in current knowledge about the effects of several service incidents on customer–firm relationship quality and the lack of empirical validation. Additionally, we aimed to address a theoretical and open question of whether incidents must be unexpected to affect customer–firm relationship quality significantly.
Our study offers empirical support for the significant effects of incident positivity and benevolence towards an incident on the customer–firm relationship and a moderating effect of the level of surprise on these effects. Positive and negative incidents will significantly affect relationship if unexpected, whereas the benevolent or opportunistic response to incidents will have a more significant influence if expected by customers. Thus, these results provide substantial theoretical and managerial implications (Table 8).
Effect of service incidents on customer–firm relationship
| Positive incidents | Benevolent incidents |
| Have a positive effect on customer–firm relationship | Have a positive effect on customer–firm relationship |
| Improvement in customer–firm relationship is larger if the event is unexpected | The effect is larger for expected benevolent incidents |
| Positive surprises can be used to reverse a downward spiral in customer–firm relationship | Expected benevolence can be a valuable tool to create an upward spiral of relationship improvement |
| Negative incidents | Opportunistic incidents |
| Have a negative effect on customer–firm relationship | Have a negative effect on customer–firm relationship |
| Damage on customer–firm relationship is larger if the event is unexpected | The effect is larger for expected opportunistic incidents |
| If not avoided, negative surprises may stop an upward spiral in customer–firm relationship | Expected opportunism risks creating a downward spiral degrading customer–firm relationship |
Customer expectations are vital to increase or decrease satisfaction (Hult et al., 2019; Qazi et al., 2017), influencing relationship quality. Unexpected positive incidents drive up satisfaction. Unexpected negative incidents drive it down. Presumably, expected incidents did very little. This appears to be false.
Positive surprises are usually complex and expensive to generate. Negative surprises occur all the time, despite efforts to prevent them (Endrikat, 2016). Keeping customers satisfied by avoiding negative surprises is a constant but fundamental struggle. Also, positive surprises can be generated with a positive return on investment (Sajtos and Chong, 2018).
Just as important are the typical cases of service incidents that do not surprise customers. Although most service incidents do not surprise the customer, they may generate an impression of firms' benevolence or opportunism. Ordinary service incidents are thus an opportunity to improve the relationship or damage it, but the key is not the mere positivity of the incident but the apparent response of benevolence to an incident (Mancilla, 2013). If the company regularly conveys that it cares about a customer's business and sacrifices a little for it, then that becomes an expectation for the customer – “normal is caring about me” – and the relationship improves with each benevolent response to an incident. Nevertheless, if the “normal” in a relationship is opportunism – “this company regularly takes advantage of me” – then the customer expects it, and another opportunistic response to an incident confirms the expectation and drives the relationship down further.
Theoretical and managerial implications
Our study adds to academia by showing that attributions of the benevolence and opportunism responses in expected incidents drive changes in satisfaction, trust and commitment to the same extent as unexpected positive and negative incidents. This shows an unexpected effect of expected events in a relationship.
Moreover, this study contributes additionally to firms by highlighting the importance of understanding what is perceived as expected and unexpected because relationships may proceed in either upward or downward spirals even if nothing unexpected happens. To reverse a downward spiral, companies need to do something surprisingly positive and change customer expectations from opportunistic treatment to benevolent treatment when facing an incident.
Limitations and further research
This study's data reflect a single point in time. Further research that follows customers through several time points in which an assortment of events occur would help delineate the explanatory power of multiple events of positive, negative, benevolent and opportunistic types. Future studies should consider the relationship length and past experiences to understand the relationship quality better. Understanding the types of incidents that generate benevolent and opportunistic attributions in various industries may be essential for future research. Finally, it will be important in future work to look for differential effects on satisfaction, trust and commitment of different types of benevolent and opportunistic events on the customer–firm relationship.
