


This paper conceptualised the distinctive capabilities system and tested its relationship between small and medium enterprise (SME) non-financial and financial performance, encompassing leadership and learning orientation as mediators, moderators and moderators’ mediators.
The research design is exploratory, quantitative and cross-sectional. The study employed partial least squares path modelling for testing the direct, mediation and moderation effects, and, for testing moderated mediation, the author adopted PROCESS analysis. Before testing the hypotheses, a confirmatory factor analysis procedure was applied to the measurement model validity test.
Our empirical findings confirm that (1) learning orientation has a positive and significant implication as a moderator between the distinctive capabilities system and SME performance; (2) the distinctive capabilities system has a significant relationship with leadership and learning orientation, and leadership has a significant relationship with learning orientation and (3) the distinctive capabilities system has no direct impact on performance. These findings suggest that, by nature, the distinctive capabilities system has an indirect impact on SME performance, which must be understood as a consequence of living “far-from-equilibrium” and being forced to learn and adapt to come up with better market configurations.
This study intends to contribute to the existing literature in three ways: (1) it proposes the distinctive capabilities system definition; (2) it highlights the system’s features and benefits that make it a core construct for SMEs surviving and thriving and (3) it shows the causal relationship between the leadership capability and learning orientation and the distinctive capabilities system and performance.
Introduction
During a time when industries are subjected to rapid technological change, market entry from global innovators and volatility in market demand (Felin and Powell, 2016), the primary pursuit of a firm remains the same as ever: creating or maintaining a superior performance for its stakeholders (Damilano et al., 2018; Teece, 2014). This desideratum is a lively and infinite activity (Herden, 2020), to the extent that there is a relationship between competitive advantage and a firm’s superior performance (Baía and Ferreira, 2019; McGrath, 2013). However, firms need to learn how to survive and thrive in an environment where resources, capabilities and competitive advantage are transient (McGrath, 2013).
How can a firm jump from one transient competitive advantage (TCA) to another? According to dynamic capabilities view (DCV) theorists, TCA occurs when the firm’s dynamic capabilities reconfigure, transform, accumulate and combine the resource base and capabilities continually through learning and coordination of organisational efforts during a series of transitions from one advantage to another (Leinwand and Mainardi, 2011; McGrath, 2013; Seidl and Whittington, 2014; Teece, 2014).
Besides learning and coordination, one organisational capability emerges in the creation of TCA: the distinctive capability. A capability is considered distinctive if it differentiates a firm strategically and other firms cannot replicate it (Grant, 1995; Rothschild and Kay, 1996). Leinwand and Mainardi (2011) mention that distinctive capabilities, when combined as a system, work as an engine that supports the creation of a series of TCAs that allows the firm to create new value while maintaining the value created in previous periods. In other words, a system of interdependent distinctive capabilities that collectively determines the firm’s competitiveness, which plays a central role in the firm as an execution aggregator of core resources, capabilities, processes and routines.
The permanent development of resources and capabilities and their positive influence on the firm’s performance are closely linked to learning orientation (LO) (Nybakk, 2012). This stems from a belief that people are capable of change and improvement through effort (Dweck, 2016). Thus, an individual and team’s development process takes place by increasing their competence, skills and knowledge (Nurn and Tan, 2010). Given the relevance of LO for distinctive capabilities, it is important to elucidate the importance of leadership capability (LC) because leaders are maestros who coordinate organisational efforts: (1) they can initiate, facilitate and guide learning (Gorgievski and Stephan, 2016) and (2) strategically and operationally manage the resources and capabilities (Ireland and Webb, 2006).
As stated previously, the core target of the firm is creating or maintaining stakeholder satisfaction. The positive relationship between resources, capabilities, knowledge, leadership and performance has been confirmed by past research (e.g. McKelvie and Davidsson, 2009; Nieves and Haller, 2014; Para-González et al., 2018). However, the empirical evidence between dynamic capabilities and performance is quite inconsistent (Baía and Ferreira, 2019). This inconsistency is an opportunity for this study to conceptualise a distinctive capabilities system (DCS) definition, to test the impact of DCS on the firm’s financial and non-financial performance, and, simultaneously, the causal relationships of the dynamic capabilities learning orientation and leadership between the DCS and financial and non-financial performance.
To the best of our knowledge, this paper is the first to conceptualise the dynamic capabilities system and to study its impact on a firm’s performance. Thus, the study tests (1) the direct effects of DCS on performance; (2) the mediating effect of LC and LO and the role of LC and LO in moderating the relationship between DCS and performance and (3) the moderated mediation indirect effect strength of LC and LO on the relationship between DCS and performance.
Identifying and studying DCS’s complex causal relationships are vital in developing interventions targeted at superior performance. Thus, the study used an exploratory and quantitative method. A survey was administered to gather the data, and the outcomes of this study indicate that the effects of DCS on small and medium enterprise (SME) performance are positively moderated by LO. Moreover, there exists a positive relationship between DCS and LC, and DCS and LO. These outcomes do not confirm a direct effect between DCS and performance, and show different behaviours around the causal relationship, which warrant future studies. The main contribution of this research is to provide a theoretical and practical understanding of DCS and its causal relationship with LC and LO in relation to performance. This gives managers a more detailed insight into the importance of DCS in the firm’s strategic and operational level, and how it benefits from the role of LC and LO to improve performance.
This study is structured as follows: the next section will review the existing theory of the main constructs adopted in this work; it will then explore the method followed, describe the sample and data and outline the measurement of the variables used in the analysis. Afterwards, the results obtained are presented and described, and the discussion, conclusions and limitations of this study for future research are discussed.
Literature review and research hypotheses
In this section, we refer to the past literature that supports the DCS definition and its influence on performance, and the contribution of LO and LC as mediators and moderators, as well as the moderating mediating effects between DCS and performance.
Distinctive capabilities system
A distinctive capability refers to an operational or dynamic capability with a superior attribute, strength or quality that differentiates a firm from its competitors, and determines how efficiently and effectively the firm creates stakeholder value. It is the result of excellence in any organisational function or activity valued by the customer, becoming strategic, important and dominant when the firm knows its competitive position and focuses on developing those capabilities that highlight its competitiveness (Fleury and Fleury, 2003). Distinctive capabilities are hard to develop, difficult for competitors to duplicate and almost impossible to acquire. They are the source of the firm’s ability to create and deliver value to its customers, and they ensure superior performance (Espino-Rodríguez and Rodríguez-Díaz, 2014; Ljungquist, 2013). In addition, they are tough to replace if they are destroyed or damaged for any reason. Therefore, all the skills and know-how the firm possesses must be treated with vigilance in order to sustain the firm’s distinctive capabilities (Teece, 2018). Distinctive capabilities are necessary to facilitate adapting, building and renewing the resources and capabilities in order to market opportunities (Hamel and Prahalad, 2005; Singh et al., 2013).
However, a distinctive capability per se does not lead to a superior performance (Fainshmidt et al., 2018); on the contrary, it is the attributes, the complementarities and the effects of existing distinctive capabilities that, by mutually enhancing and compensating for each other in an adaptive system, enable the firm to obtain superior performance-related benefits (Ambrosini and Altintas, 2019; Leinwand and Mainardi, 2011).
We argue that DCS can be defined as a firm’s abilities to combine distinctive capabilities that mutually reinforce themselves, differentiate a firm strategically, cannot be replicated by other firms, and deliver value creation to stakeholders, which contribute to the firm building TCA and thriving.
Conceptually, DCS is a meta-capability that comprises five constituent elements:
Distinctive capabilities – They focus on some operational or dynamic capabilities, between three and six, that the firm does very well, and which competitors fail to replicate and customers appreciate (Leinwand and Mainardi, 2011). The distinctive capability relates to a capability that differentiates a firm from competitors and facilitates TCA.
A system – This combines distinctive capabilities, reinforces them and adapts to the various changes in the market (Leinwand and Mainardi, 2011). Distinctive capability links within the system to compensate for the “weakest link” by acting as a whole (Eden and Ackermann, 2000).
Strategic differentiation – The combination of distinctive capabilities as an adaptive system should focus on developing strategies with original characteristics in order to create TCA that can be perceived and taken as preferred by customers (Cardeal, 2018).
Processes and routines – The DCS uses processes and routines difficult to replicate which ensure the effective coordination of functional activities and allow a firm to execute, learn and continuously improve to achieve the desired objective (Helfat and Peteraf, 2003). It creates, extends or modifies a firm’s resources and capabilities in a way that generates opportunities for new value-creating strategies through modifying capabilities; it delivers products or service benefits valued by customers; it is hard for competitors to copy or develop and, consequently, it provokes substantial economic change (Eisenhardt and Martin, 2000; Teece, 2014).
Value creation – The DCS must create value to stakeholders; that is, it must deliver something that has worth to them (Harrison and Wicks, 2013). As for employees, value can be better wages and benefits, quality of life and well-being, fair treatment and respect. For customers, it can be related to the benefits and quality of the product or service, price–quality ratio, quality of service and after-sales service. The value distributed to customers is evaluated by indicators such as customer loyalty, attracting new customers or increasing the predisposition to pay a premium price for the firm’s product or service. For suppliers, the volume of transactions and a stable relationship, among others, can be highlighted. For the community, initiatives of social contributions and local involvement can be considered. Finally, for shareholders, it is related to the business’s financial return, risks and dividends, corporate governance and transparency, social and environmental performance and social responsibility (Harrison and Wicks, 2013).
These constituent elements contribute to the firm building TCA and thriving. Therefore, when the DCS combines distinctive capabilities effectively and efficiently, the consequent processes and routines within a firm determine its competitiveness over time (Ireland and Webb, 2006). It consequently plays an important role in the achievement of the firm’s performance (Leinwand and Mainardi, 2011).
Leadership
Since DCS encompasses the firm’s diverse processes and routines to deliver outcomes, it requires leaders who can build, coordinate and operationalise it in a specific firm setting, and simultaneously keep the firm nimble, committed and profitable (Schoemaker et al., 2018). Osborn and Hunt (2007) argue that a primary task of leadership is to establish a dynamic system where bottom-up structurisation emerges and moves the system and its components to a more desirable level of fitness.
LC is a set of soft and hard skills, abilities, knowledge, experience, good attitude and desirable leadership capabilities; all essential traits that a person embodies to influence a team or just an individual (Kouzes and Posner, 2012; Wan Muda et al., 2016). A leader is the person who effectively leads a group of individuals, turns them into a team with a purpose and engages others to share that purpose. In the case of a firm, a leader’s leadership ability allows the firm to achieve everyday performances with long-term success (Morrill, 2007).
When the firm’s LC is scarce, it will have insufficient capacity to sense, seize and reconfigure its resources and capabilities in the face of the ambiguous signs that emerge from the environment and the industry in which it operates (Schoemaker et al., 2018). Thus, LC is a condition for superior performance in a firm, since (1) leaders have great impact on the direction and decision-making within their organisations (Porter and Nohria, 2010); (2) they are central to strategic change and firm performance insofar they are behind the creation and discovery of new business opportunities (Helfat and Martin, 2015) and (3) leaders’ commitment to support a culture that fosters learning orientation as one of the firm’s main values to thrive is an obligation (Real et al., 2012).
Learning orientation
This study defines learning orientation (LO) as a firm’s basic attitude towards learning, resulting in organisational learning processes that create and use knowledge as a performance boost (Real et al., 2012). Thus, LO is a key element for firms to survive, adapt and increase competitiveness (Edmondson, 2008; McGrath, 2001). The workplace should represent more than just a place where products or services are produced; it should be an environment in which formal and informal learning and training cohabit and develop (Ellström, 2001).
The strategic literature has emphasised LO as the process through which learning for life is accepted by a firm’s members (Rhee et al., 2010). Continuous learning is an essential source of competitiveness for two reasons: (1) it fosters the firm’s ability to achieve new knowledge and promote the development and launching of new products and services (Muñoz-Pascual and Galende, 2020; Drewniak and Karaszewski, 2019) and (2) this knowledge is not the property of any individual, but rather of the collective represented by the firm, which impedes its transfer or appropriation (Decarolis and Deeds, 1999; Ebbers and Wijnberg, 2009).
Nybakk (2012) states that learning has a positive influence on performance, so the firm must be directly involved in the development of knowledge of its human resources. LO’s assertiveness requires individuals who have the opportunity to practise their interpersonal skills, abilities, knowledge, processes and work habits (Blanch-Hartigan et al., 2012), and leaders who invest in, and inspire and stimulate the development of, their human capital (Rego et al., 2017).
A firm that facilitates LO is more likely to be innovative, knowledgeable and profitable (Huang and Chu, 2010; Farrell, 2000). It will perform better because it draws lessons from successes and failures to make new knowledge and innovation. LO is an indirect factor in accomplishing the firm’s strategic objectives (Nezam et al., 2016). Literature shows that LO increases business performance directly and indirectly through its influence on competitive advantage (Calantone et al., 2002; Martinette et al., 2014).
Our work focuses on SMEs, and empirical evidence confirms the LO’s importance for them: (1) it facilitates the development of people and internal processes (Knipfer et al., 2018); (2) it is a manifestation of the firm’s trend to learn and adapt (Mavondo et al., 2005); (3) new product success and the firm’s innovativeness (Pett and Wolff, 2010); (4) financial profitability or non-financial success (Frank et al., 2012; Westerlund and Rajala, 2010) and (5) it assists SMEs in developing competitiveness and surviving in the market place (Rhee et al., 2010).
Organisational performance
In this research, firm performance is considered as the firm’s ability to realise established goals for its products and services, as indicated in the financial performance (FPER) and non-financial performance (NFPER) outcomes (O'Cass and Weerawardena, 2009). Hoque (2004) and Joiner et al. (2009) confirm the importance of these dimensions in management’s strategic choices and the firm’s performance.
Moderated mediation model
In this study, we test hypotheses on three models: direct effects, mediation/moderation and moderated mediation. The direct effects model tests the influence between a given independent variable and a dependent variable.
The mediation occurs when the causal effect of DCS on performance (PER) is transmitted by LC or LO. The LC or LO mediating variable is relevant because we want to understand the process by which it relates to DCS, in such a way that LC or LO provokes a mediation variable that then has an impact on PER. In other words, DCS affects PER because LC or LO, in turn, affects PER. The direct effects model in which DCS is the predictor is found to be associated, and presumed to be causally associated, with PER. The size of the effect from DCS to PER is the total effect and is labelled c. The mediating variables LC or LO, in turn, are added to this model, as shown in the mediation/moderation model. The variables LC or LO are hypothesised to be a measure of the mechanism by which the predictor DCS has its effect. The direct effect from DCS to PER is now labelled c′. The effect from DCS to LC or LO is labelled a, and the effect from LC or LO to PER is labelled b. The size of the effect from DCS to PER is reduced by the total amount of the indirect effect, which is found as the product of a and b. Therefore,
The moderation allows our study to test for the influence of LC or LO on the relationship between DCS and PER. Rather than testing a causal link between DCS and PER, moderation tests for when or under what conditions an effect occurs. In other words, the moderator effect or conditional effect occurs when the effect of DCS changes direction or magnitude by LC or LO influence. Thus, LC and LO can reinforce, weaken or reverse the nature of the relationship between DCS and PER, in accordance with the values of LC or LO. The moderation effect has three possible effects (Aiken and West, 1991): (1) enhancing, where increasing the LC or LO would increase the effect of the DCS on PER; (2) buffering, where increasing the LC or LO would decrease the effect of DCS on PER or (3) antagonistic, where increasing the moderator would reverse the effect of the DCS on PER.
To fully disentangle the nature of the relationships between DCS, LC, LO and PER, it was necessary to use the moderated mediation model in which a moderator is added to a mediation model (James and Brett, 1984). The moderated mediation model attempts to explain both how and when a given effect occurs (Frone, 1999). In other words, the moderated mediation model quantifies the magnitude, size or direction of the indirect effect of variable DCS on variable PER via a mediating variable LO or LC, which varies in accordance with the value of a moderating variable LC or LO (Frone, 1999).
Research hypotheses
According to the literature reviewed above, we proposed the following hypotheses:
Direct effects model
DCS is positively associated with leadership (LC).
DCS is positively associated with learning orientation (LO).
DCS is positively associated with non-financial performance (NFPER).
DCS is positively associated with financial performance (FPER).
LC is positively associated with DCS.
LC is positively associated with LO.
Mediation/moderation model
LC is a positive mediator for the relationship between DCS and NFPER.
LC is a positive mediator for the relationship between DCS and FPER.
LC is a positive moderator for the relationship between DCS and NFPER.
LC is a positive moderator for the relationship between DCS and FPER.
LO is a positive mediator for the relationship between DCS and NFPER.
LO is a positive mediator for the relationship between DCS and FPER.
LO is a positive moderator for the relationship between DCS and NFPER.
LO is a positive moderator for the relationship between DCS and FPER.
Moderated mediation model
LC has a moderated role between DCS and NFPER, and this effect is higher when mediating by LO.
LC has a moderated role between DCS and FPER, and this effect is higher when mediating by LO.
LO has a moderated role between DCS and NFPER, and this effect is higher when mediating by LC.
LO has a moderated role between DCS and FPER, and this effect is higher when mediating by LC.
Figure 1 expresses the framework of this investigation.
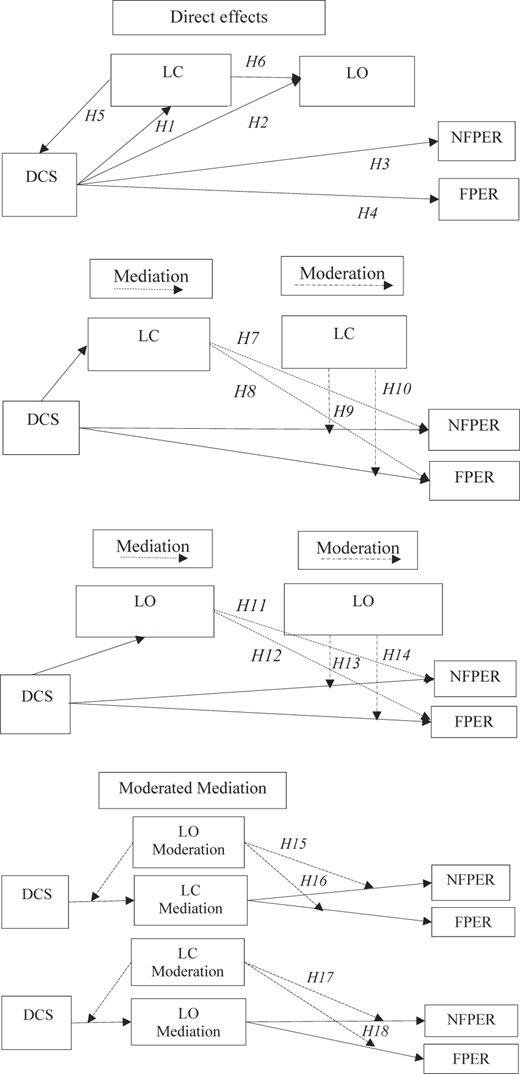
A conceptual model of the research based on the hypotheses
A conceptual model of the research based on the hypotheses
Method
The research design of the undertaken study is exploratory, quantitative and cross-sectional. Data were collected through a modified structured questionnaire. The independent constructs were measured through 33 closed-ended items and the dependent construct was measured through 12 closed-ended items, both via a 5-point Likert-type scale; potential answers ranged from 1 = “strongly disagree” to 5 = “strongly agree”. Each respondent was asked to indicate their degree of agreement with each statement. Detailed operational definitions of each variable and measurement sources were as follows and described in Appendix.
Distinctive capabilities system (DCS) – Independent construct based on Leinwand and Mainardi (2011), accordingly six items were adopted.
Leadership capability (LC) – Independent construct with four items adopted from Leinwand and Mainardi (2011) to measure the degrees of leadership, whether leaders and staff were well prepared to attend to the organisational strategy and market.
Learning orientation capability (LO) – Independent construct with 11 items adopted from Collins and Smith (2006), Velada (2007) and Tesluk et al. (1995) to measure LO, whether the organisation was prepared prior to attending to its strategy and market.
Perceived SME performance – Dependent variable with 11 items adopted from Avci et al. (2011) to measure the degrees of NFPER and FPER. The management literature accepted the use of perceptual measures of firm performance (Bartholomew and Smith, 2006; Patel and Cardon, 2010). Authors like Forth and McNabb (2008) found significant and sizable correlations between objective and perceptual measures of firm performance. Six items concerned with NFPER and six items concerned with FPER were employed.
Since the study is exploratory, we collected data via an online survey from employees, administrative staff, directors and owners who work in Portuguese SMEs (Kianto, 2009). We selected Portuguese SMEs because, according to PORDATA, in 2019 they represented 99.89% of all enterprises and 94.97% had ten or fewer people.
Online respondents were randomly recruited from the professional network LinkedIn. The survey was emailed (January 2020) to a total of 2,845 individuals. A total of 156 respondents answered the survey (5.48%). The first question was eliminatory, because it would select potential participants: Do you work in an enterprise with less than 250 employees and a turnover of less than 50 million euros?
Of the participants, 81.8% are male and 18.2% are female. The average age of the participants is 44.94 years old, and 88.05% have a university degree: bachelor’s degree (42.3%), master’s degree (26.3%) and PhD (7.7%).
The collected data were analysed using the XLSTAT statistical programme. Before testing the hypotheses, a confirmatory factor analysis (CFA) procedure was applied to the measurement model validity test. Our hypotheses are mainly causal relationships and to test their impact we used conditional process modelling (PROCESS macro).
Standard errors (SE) and critical ratios (CRAs) were calculated to assess study hypotheses. Concerning reliability and validity, a CFA was implemented (Tables 1 and 2). We measured composite reliability (CR), based on CR > 0.7 (Nunnally, 1978) and considered converging validity with average variance extracted (AVE) > 0.50 (Fornell and Larcker, 1981). For assessing discriminant validity, we computed squared intercorrelations and compared them with AVE for constructs (Fornell and Larcker, 1981).
Psychometric analysis
| Item | M | SD | Loading (Std.) | SE | CRAs | |
|---|---|---|---|---|---|---|
| DCS | ||||||
| AVE = 0.722; CR = 0.935 | DCS1 | 3.58 | 0.99 | 0.85 | 0.03 | 33.211*** |
| DCS2 | 3.56 | 1.00 | 0.90 | 0.02 | 50.302*** | |
| DCS3 | 3.36 | 1.08 | 0.88 | 0.02 | 46.000*** | |
| DCS4 | 3.51 | 1.03 | 0.85 | 0.03 | 32.150*** | |
| DCS5 | 3.32 | 1.21 | 0.86 | 0.02 | 41.249*** | |
| DCS6 | 3.26 | 1.11 | 0.90 | 0.02 | 56.917*** | |
| LC | ||||||
| AVE = 0.755; CR = 0.890 | LC1 | 3.38 | 1.16 | 0.87 | 0.03 | 31.105*** |
| LC2 | 3.42 | 1.08 | 0.91 | 0.02 | 43.546*** | |
| LC3 | 3.38 | 1.09 | 0.92 | 0.02 | 59.587*** | |
| LC4 | 3.27 | 1.01 | 0.77 | 0.05 | 16.006*** | |
| LO | ||||||
| AVE = 0.669; CR = 0.948 | LO1 | 3.54 | 1.09 | 0.76 | 0.04 | 18.497*** |
| LO2 | 3.23 | 1.09 | 0.71 | 0.05 | 13.251*** | |
| LO3 | 3.27 | 1.10 | 0.67 | 0.07 | 9.888*** | |
| LO4 | 3.06 | 1.31 | 0.62 | 0.05 | 11.722*** | |
| LO5 | 3.69 | 1.17 | 0.88 | 0.02 | 37.290*** | |
| LO6 | 3.18 | 1.16 | 0.85 | 0.03 | 30.602*** | |
| LO7 | 3.59 | 1.14 | 0.91 | 0.02 | 52.462*** | |
| LO8 | 3.54 | 1.18 | 0.90 | 0.02 | 50.619*** | |
| LO9 | 3.61 | 1.12 | 0.89 | 0.02 | 37.463*** | |
| LO10 | 3.62 | 1.12 | 0.92 | 0.02 | 58.992*** | |
| LO11 | 3.44 | 1.19 | 0.84 | 0.04 | 21.589*** | |
| NFPER | ||||||
| AVE = 0.743; CR = 0.930 | NFPER1 | 3.40 | 1.02 | 0.75 | 0.04 | 18.969*** |
| NFPER2 | 3.42 | 1.08 | 0.90 | 0.02 | 57.282*** | |
| NFPER3 | 3.35 | 1.11 | 0.90 | 0.02 | 57.092*** | |
| NFPER4 | 2.93 | 1.21 | 0.85 | 0.02 | 35.264*** | |
| NFPER5 | 3.31 | 1.24 | 0.86 | 0.03 | 25.544*** | |
| NFPER6 | 3.50 | 1.11 | 0.89 | 0.02 | 46.692*** | |
| FPER | ||||||
| AVE = 0.593; CR = 0.853 | FPER1 | 3.51 | 1.16 | 0.83 | 0.03 | 30.213*** |
| FPER2 | 3.32 | 1.15 | 0.83 | 0.03 | 25.141*** | |
| FPER3 | 3.22 | 1.05 | 0.70 | 0.06 | 10.738*** | |
| FPER4 | 3.27 | 1.21 | 0.86 | 0.03 | 33.924*** | |
| FPER5 | 3.22 | 1.24 | 0.85 | 0.02 | 34.480*** | |
Note(s): ***p < 0.001
Test for discriminant validity (Squared correlations < AVE)
| DCS | L | LO | NFPER | FPER | AVE | |
|---|---|---|---|---|---|---|
| DCS | 1 | 0.572 | 0.462 | 0.487 | 0.439 | 0.722 |
| LC | 1 | 0.449 | 0.490 | 0.467 | 0.755 | |
| LO | 1 | 0.317 | 0.269 | 0.669 | ||
| NFPER | 1 | 0.679 | 0.743 | |||
| FPER | 1 | 0.593 |
Model quality was assessed with R2. Significance of associations was assessed with Pr > |t|. Goodness-of-fit indices were calculated to assess research model fit considering as main criterion the relative goodness of fit above the 0.90 level (Esposito Vinzi et al., 2010; Henseler and Sarstedt, 2013). Finally, we used the conditional process modelling for the analysis of direct and indirect relationships between the variables (Rockwood and Hayes, 2020).
Data analysis and results
This section presents the empirical results. We employed partial least square (PLS) path modelling for testing the direct, mediation and moderation effects, and, because some hypothesis testing includes moderated mediation, we adopted PROCESS analysis (Hayes, 2013).
Results of CR were all considerably above 0.70. All items were loaded on their expected constructs very strongly at p < 0.001. Convergent validity measured with AVE ranged from 0.593 to 0.755, robustly above the recommended level of 0.50. For all items, loadings were higher on their own, and no evidence for cross-loadings was found. AVEs for constructs were considerably larger than squared intercorrelations with the exception of NFPER with FPER, perhaps due to some degree of multi-collinearity. Tables 1 and 2 show the results of the reliability and validity of the constructs.
Common method bias was also a concern since respondents were asked about dependent and independent variables at the same time. Following the recommendation by Podsakoff et al. (2003), we took three steps: (1) the questionnaire was designed and administered such that items measuring performance were separated from other constructs; by doing so, predictors were psychologically separated from predicted variables for respondents; (2) respondents were explicitly informed that their responses to the questionnaire would remain anonymous in order to reduce the threat of bias due to social desirability and (3) Harman’s single-factor test was conducted to ensure that no one factor accounted for a majority of the variance. An exploratory factor analysis with Varimax rotation indicated that the first factor accounted for 13.42% of the variance, well below 50%.
Table 2 shows significant correlations between performance and all the independent variables. Nevertheless, we also detected a high degree of multi-collinearity between the two dependent variables, with a correlation above 0.6.
Testing of hypothesised direct and indirect effects
The results of testing the research model using PLS path modelling are shown in Table 3, presenting hypotheses 1 to 14.
Test of research model
| Hypothesis | β | SE | t | Pr > |t| |
|---|---|---|---|---|
| H1: DCS → LC | 0.756 | 0.052 | 14.352 | p < 0.001 |
| H2: DCS → LO | 0.403 | 0.085 | 4.699 | p < 0.001 |
| H3: DCS → NFPER | 0.321 | 0.182 | 1.764 | p = 0.080 |
| H4: DCS → FPER | 0.360 | 0.190 | 1.896 | p = 0.060 |
| H5: LC → DCS | 0.657 | 0.047 | 4.859 | p < 0.001 |
| H6: LC → LO | 0.366 | 0.086 | 4.265 | p < 0.001 |
| H7: DCS → LC → NFPER | 0.285 | 0.163 | 1.744 | p = 0.08 |
| DCS → LC | 0.756 | 0.052 | 14.352 | p < 0.001 |
| LC → NFPER | 0.328 | 0.187 | 1.754 | p = 0.081 |
| H8: DCS → LC → FPER | 0.339 | 0.233 | 1.455 | p = 0.146 |
| DCS → LC | 0.756 | 0.052 | 14.352 | p < 0.001 |
| LC → FPER | 0.446 | 0.196 | 2.280 | p = 0.024 |
| H9: DCS → NFPER (∼LC) | 0.037 | 0.052 | 1.744 | p = 0.151 |
| H10: DCS → FPER (∼LC) | −0.031 | 0.050 | 0.63 | p = 0.529 |
| H11: DCS → LO → NFPER | 0.379 | 0.094 | 1.39 | p = 0.167 |
| DCS → LO | 0.406 | 0.189 | 2.15 | p = 0.033 |
| LO → NFPER | −0.05 | 0.176 | −0.29 | p = 0.775 |
| H12: DCS → LO → FPER | 0.333 | 0.531 | 0.77 | p = 0.441 |
| DCS → LO | 0.552 | 0.189 | 2.66 | p = 0.028 |
| LO → FPER | 0.109 | 0.167 | 0.65 | p = 0.515 |
| H13: DCS → NFPER (∼LO) | 0.277 | 0.086 | 3.232 | p = 0.001 |
| H14: DCS → FPER (∼LO) | 0.679 | 0.049 | 13.93 | p < 0.001 |
| Goodness-of-fit index | GoF | GoF bootstrap | SE | CR |
|---|---|---|---|---|
| Absolute | 0.637 | 0.648 | 0.050 | 12.671 |
| Relative | 0.882 | 0.842 | 0.044 | 20.037 |
| Outer model | 0.997 | 0.994 | 0.032 | 31.539 |
| Inner model | 0.885 | 0.847 | 0.027 | 33.233 |
Direct effects model
DCS was positively associated with LC (H1: β = 0.756, p < 0.001), confirming H1. DCS was positively associated with LO (H2: β = 0.403, p < 0.001), confirming H2. No significant associations were found between either DCS and NFPER (p = 0.080) or DCS and FPER (p = 0.060); so, no confirmation was found for either H3 or H4.
Mediation/moderation models
No mediation was found for the association of either DCS with NFPER (H7) or FPER (H8), mediated by LC. Nevertheless, significant associations were found for DCS and LC (β = 0.756, p < 0.001). LC was not a significant mediator for the association between DCS and NFPER (β = 0.285, p < 0.008) and DCS and FPER (β = 0.339, p < 0.146), confirming neither hypothesis H7 nor H8.
Testing of hypothesised moderated mediation effects
The results of testing the research model using PROCESS are shown in Tables 4 and 5, presenting hypotheses 15 to 18.
Moderated mediation effect of LO and LC on DCS association with FPER
| β | SE | p-value | |
|---|---|---|---|
| Model 1 – outcome LC | |||
| R2 = 0.622 | |||
| F(3,152) = 83.50 (p < 0.001) | |||
| 0.42 | 0.17 | p = 0.017 |
| 0.16 | 0.16 | p = 0.320 |
| 0.05 | 0.05 | p = 0.341 |
| Model 2 – outcome FPER | |||
| R2 = 0.523 | |||
| F(4,151) = 41.31 (p < 0.001) | |||
| 0.33 | 0.09 | p < 0.001 |
| 0.50 | 0.19 | p = 0.009 |
| 0.11 | 0.18 | p = 0.515 |
| −0.03 | 0.05 | p = 0.528 |
| Mediation effects (LC) | |||
| F (1, 150) = 1.25 (p = 0.313) | |||
Note(s): (a) R2 change = 0.002 (p = 0.341); (b) R2 change = 0.001 (p = 0.529)
Moderated mediation effect of LC and LO on DCS association with NFPER
| β | SE | p-value | |
|---|---|---|---|
| Model 1 – outcome LO | |||
| R2 = 0.531 | |||
| F(3,152) = 57.31 (p < 0.001) | |||
| 0.41 | 0.19 | p = 0.033 |
| 0.36 | 0.19 | p = 0.061 |
| 0.003 | 0.05 | p = 0.951 |
| Model 2 – outcome NFPER | |||
| R2 = 0.563 | |||
| F(4,151) = 48.58 (p < 0.001) | |||
| 0.38 | 0.10 | p < 0.001 |
| 0.28 | 0.20 | p = 0.151 |
| −0.05 | 0.18 | p = 0.775 |
| Interaction (LC × LO) (b) | 0.04 | 0.05 | p = 0.484 |
| Mediation effects (LO) | |||
| F (1, 150) = 0.05 (p = 0.819) | |||
Note(s): (a) R2 change = 0.00 (p = 0.951); (b) R2 change = 0.001 (p = 0.484)
Moderated effects of LO and mediated effects of LC on DCS (H15) associated with FPER are presented in Table 4. Regarding model 1, DCS showed a significant association with LC (β = 0.42, p = 0.017) in a model with global significance, F(3,152) = 83.50 (p < 0.001) and 62.2% of LC explained by DCS (p = 0.017), LO (p = 0.320) and DCS × LO interaction.
In model 2, DCS showed a significant association with FPER (β = 0.33, p < 0.001). LC was also associated with FPER (β = 0.50, p < 0.001). On the other hand, no associations were found for either LO (p = 0.515) or the interaction between LC and LO (p = 0.528). Overall model results were F(4,151) = 41.31 (p < 0.001) and explained variance of FPER based on previous covariates was 52.3%. We did not confirm mediation effects of LC F(1,150) = 1.25 (p = 0.313).
Moderated effects of LO and mediated effects of LC on DCS (H16) association with NFPER are presented in Table 5.
For model 1, which considered LO as an outcome, significant association was found for DCS (β = 0.41, p = 0.033). No significant differences were found for either LC (p = 0.061) or DCS × LC interaction (p = 0.951). Global model assessment was F(3,152) = 57.31 (p < 0.001) with 53.1% of explained variance of LC by the previously referred covariates.
In model 2, DCS showed a significant association with NFPER (β = 0.38, p < 0.001). On the other hand, no associations were found either for LC (p = 0.151), LO (p = 0.775) or the interaction between LC and LO (p = 0.484). Overall model results were F(4,151) = 48.58 (p < 0.001) and explained variance of NFPER based on previous covariates was 56.3%. We did not confirm mediation effects of LC F(1,150) = 0.05 (p = 0.819).
Moderated effects of LC and mediated effects of LO on DCS (H17) association with NFPER are presented in Table 6.
Moderated mediation effect of LC and LO on DCS association with FPER
| β | SE | p-value | |
|---|---|---|---|
| Model 1 – outcome LO | |||
| R2 = 0.531 | |||
| F(3,152) = 57.31 (p < 0.001) | |||
| 0.41 | 0.19 | p = 0.033 |
| 0.36 | 0.19 | p = 0.061 |
| 0.003 | 0.05 | p = 0.951 |
| Model 2 – outcome FPER | |||
| R2 = 0.563 | |||
| F(4,151) = 48.58 (p < 0.001) | |||
| 0.38 | 0.10 | p < 0.001 |
| 0.28 | 0.20 | p = 0.151 |
| −0.05 | 0.18 | p = 0.775 |
| 0.04 | 0.05 | p = 0.484 |
| Mediation effects (LO) | |||
| F (1, 150) = 0.05 (p = 0.819) | |||
For model 1, which considered LC as an outcome, significant association was found for DCS (β = 0.41, p = 0.033). No significant differences were found for either LO (p = 0.061) or DCS × LO interaction (p = 0.951). Global model assessment was F(3,152) = 57.31 (p < 0.001) with 53.1% of explained variance of LC by the previously referred covariates.
In model 2, DCS showed a significant association with NFPER (β = 0.38, p < 0.001). On the other hand, no associations were found for either LC (p = 0.151), LO (p = 0.775) or the interaction between LC and LO (p = 0.484). Overall model results were F(4,151) = 48.58 (p < 0.001) and explained variance of NFPER based on previous covariates was 56.3%. We did not confirm mediation effects of LC F(1, 150) = 0.05 (p = 0.819).
Moderated effects of LC and mediated effects of LO on DCS (H18) association with FPER are presented in Table 7.
Moderated mediation effect of LC and LO on DCS association with FPER
| β | SE | p-value | |
|---|---|---|---|
| Model 1 – outcome LC | |||
| R2 = 0.531 | |||
| F(3,152) = 57.31 (p < 0.001) | |||
| 0.41 | 0.19 | p = 0.033 |
| 0.36 | 0.19 | p = 0.061 |
| 0.003 | 0.05 | p = 0.951 |
| Model 2 – outcome FPER | |||
| R2 = 0.523 | |||
| F(4,151) = 41.31 (p < 0.001) | |||
| 0.33 | 0.09 | p < 0.001 |
| 0.50 | 0.19 | p = 0.009 |
| 0.11 | 0.18 | p = 0.515 |
| −0.03 | 0.05 | p = 0.528 |
| Mediation effects (LC) | |||
Note(s): (a) R2 change = 0.00 (p = 0.951); (b) R2 change = 0.001 (p = 0.529)
For model 1, which considered LC as an outcome, significant association was found for DCS (β = 0.41, p = 0.033). No significant differences were found for either LO (p = 0.061) or DCS × LO interaction (p = 0.951). Global model assessment was F(3,152) = 57.31 (p < 0.001), with 53.1% of explained variance of LC by the previously referred covariates.
In model 2, DCS showed a significant association with FPER (β = 0.33, p < 0.001). LC was also associated with FPER (β = 0.50, p < 0.001). On the other hand, no associations were found for either LO (p = 0.515) or the interaction between LC and LO (p = 0.528). Overall model results were F(4,151) = 41.31 (p < 0.001) and explained variance of FPER based on previous covariates was 52.3%. We did not confirm mediation effects of LC F (1,150) = 1.25 (p = 0.313).
In summary, the confirmed hypotheses results are in Table 8.
Confirmed research hypotheses
| Hypothesis | Results |
|---|---|
| H1: DCS is positively associated with LC | Confirmed |
| H2: DCS is positively associated with LO | Confirmed |
| H5: LC is positively associated with DCS | Confirmed |
| H6: LC is positively associated with LO | Confirmed |
| H13: LO is a positive moderator for the relation between DCS and NFPER | Confirmed |
| H14: LO is a positive moderator for the relation between DCS and FPER | Confirmed |
Discussion
This study tested (1) the direct effects of DCS on performance; (2) the mediating effect of LC and LO, and the role of LC and LO in moderating the relationship between DCS and performance and (3) the moderated mediation indirect effect strength of LC and LO on the relationship between DCS and performance.
Our first purpose was to test the direct effects. According to the findings, it seems that DCS per se does not influence either SME NFPER or FPER. However, the results suggest a positive two-way relationship between DCS and LC, a direct relationship between DCS and LO and a direct relationship between LC and LO.
These positive and influential direct relationships are important during SMEs’ TCA transition or transformation because: (1) LC decides, influences, guides and articulates the change. Since the market has a strong volatility, an essential LC role in SMEs is the ability to assess what is necessary and vital to strategic, tactical and structural changes and to immediately execute in order to achieve the organisational goals; (2) when LC intends to change, it must support LO and its organisational learning processes. This support will promote, tailor and scale learning activities throughout the entire SME. These activities are influenced by DCS due to the experience acquired during business contact with the customer; thus, customer feedback is a critical contribution to the improvement of the design and definition of the learning process and contents; (3) the leadership decision-making process has a direct effect on the DCS that can boost or hurt it. Making good decisions that have an impact on all stakeholders in changing times involves a mix of knowledge, past experience, intuition and a willingness to take a risk. On other hand, it involves uncertainty, anxiety, stress and the occasional unfavourable reactions of others. Thus, leaders should understand how to balance emotion with reason during the decision-making process. (4) Finally, DCS and LO are like muscles that need to be strengthened and stretched in order to improve people’s knowledge, increase faster adaptation to change, build resilience, increase efficiency and productivity, and create and deliver value.
When an SME understands the power of these “muscles” and recognises what resources, capabilities, processes and routines have strengths and inimitability for building or improving TCA, it establishes the most reliable path to strategically differentiate it as an SME.
Important evidence in this study is the absence of direct influence between DCS and the NFPER/FPER. This proves the non-linear relationship between some capabilities and performance mentioned by several authors (e.g. Baía and Ferreira, 2019). Attempting to find the causal relationship – when and why – between capabilities and performance is a motivating challenge for researchers.
Our second purpose was (1) to test the influence of DCS on NFPER/FPER by examining the mediating effect of LC and LO and (2) the role of LC and LO in moderating this relationship. The findings indicate that, from the various hypotheses tested, only the moderation of LO between DCS and NFPER/FPER has statistical validity.
This finding is consistent with prior literature, which asserts that SMEs which are exposed to an open LO that stimulates the firm’s willingness to create and use knowledge tend to outperform competitors that function in a restrictive bubble (e.g. Martinette et al., 2014). In fact, the continuous commitment to LO facilitates the organic renewal of resources and capabilities, and fosters the continuous improvement of processes and routines, which can improve the business knowledge and stakeholder relationships and increase an SME’s performance. Hence, it can be assumed that, by fostering a learning mindset and collective continuous learning, an SME gains the ability to build new capabilities and skills, and to combine and transform them into distinctive capabilities, improving the firm’s performance, reinforcing its TCA and undertaking value for day-to-day survival and to thrive in the long run.
In this mediation/moderation model, there was one revelation: the mediating effects of LC for a relationship between DCS and NFPER/FPER were not confirmed. This means that the causal relationship between DCS and NFPER/FPER in this case is not better explained using LC as an intermediary variable. According to past literature (e.g. Harrison et al., 2015; Rego et al., 2017; Tourish, 2014), LC has an influence on the SME’s direction, people-changing attitudes, beliefs or behaviour, close and vigilant contact between the firm and its environment, and it is also a key factor for the growth, development or failure of any SME. However, the leadership context and the actors’ personal characteristics are strong determinants; that is, there is no “one-size-fits-all” LC. In reality, one of the roles of the SME leader is to identify, invest and protect the resources and capabilities underlying the business in a way that is unique and non-transferable.
Our third purpose was to test the moderated mediation effects of LC and LO on the relationship between DCS and NFPER/FPER. The findings indicate that none of the four hypotheses has statistical relevance. Thus, according to the moderated mediation analysis of LO and LC to boost DCS: (1) LO does not have a moderated role between the DCS and NFPER/FPER, when mediated by LC and (2) LC does not have a moderated role between the DCS and NFPER/FPER, when mediated by LO. This means that the moderator does not influence the mediator, a situation that seems to us to be by virtue of the mediating effect of either LC or LO as the relationship between DCS and NFPER/FPER was not confirmed.
Academic implications
Our study advances theory by conceptualising DCS and its impact on a firm’s performance. We argue that DCS has five elements: distinctive capabilities, a system, strategic differentiation, processes and routines, and value creation. Thus, our first contribution to literature is the DCS definition and features: it is dynamic, not predictable; the distinctive capabilities evolve and adjust to each other and the environment; and the solutions arise from DCS’s ability to manage circumstances in the form of new structures, patterns or processes. DCS should be understood as a complex adaptive system that lives “far-from-equilibrium” (Mitleton-Kelly, 2003) due to the market unpredictability that forces it to continuously adapt to achieve better configurations.
Our second contribution is the indirect relationship between DCS and the SME’s performance, which reinforces the opinion of some authors (e.g. Baía and Ferreira, 2019) about the need for mediators or moderators in the relationship between dynamic capabilities and performance. The continued adaptation of the system to market volatility may be one of the causes that there is no direct relationship. However, adaptation requires the absorption of new knowledge, which may justify the moderating relationship of LO between DCS and performance.
Our last contribution has to do with the fact that leadership has a direct and two-way relationship with DCS but does not have a causal relationship between DCS and performance. That is, leadership directly influences DCS, which reciprocates by influencing it as well. However, leadership has no role in influencing the relationship between DCS and performance. A probable justification for this evidence may be related to the leadership profile and the impact it has on the SME’s internal environment with its attitudes and behaviours.
Practical implications
Our study highlights the relevance of DCS for an SME to survive and thrive. The processes and routines around DCS give an SME a clear purpose by focusing on key product categories, more agile customer-facing decision-making processes, and in delivering value to stakeholders. In this way, strong relationships are built between stakeholders, who reinforce each other; leaders get faster feedback from markets about what is working and what needs more attention; there is greater information flow available to the whole SME; people are more committed and productive; and the likelihood of anticipating crises and surprises increases. Thus, DCS’s virtue is to make the SMEs more resilient to crises and, in the process, protecting all stakeholders.
Nevertheless, in this study, the following became clear: (1) DCS is an indirect key factor in an SME’s superior performance – because of its distinctive capabilities, customer-centric need and the moderation of dynamic capabilities to assist superior performance, managers must have an integrated view of organisational capabilities as a whole to reap the greatest benefits from DCS; (2) LO makes a strong contribution to adaptation and new configurations – it assists DCS in building a new transition advantage and improving an SME’s performance – LO is one of the prime potential sources for positive changes in dynamic markets as long as managers and leadership support it; (3) managers should take the lead in encouraging an LO to develop a bright SME with a learning climate and holistic development for people and (4) SME managers should be encouraged to develop and improve a DCS with a robust LO.
Conclusion
While there is no single blueprint for success, the effort of building up the distinctive capabilities system offers an opportunity for SMEs to thrive and continue to reinvent themselves in the middle of unrelenting competition. Given the urgency for transformation, SMEs should develop and maintain a distinctive capability system moderated by learning orientation to enable new configurations to spark a high degree of customer experience and discard survival ad hoc attitudes or decisions.
The most prominent contribution of the present study is found in the establishment of the association between the new concept of the distinctive capabilities system and learning orientation moderation to reach NFPER and FPER in Portuguese SMEs. For management, our research suggests that continuous learning and improvement of distinctive capabilities and its system should improve performance management, strategy execution, and better processes and routines, thereby creating more value and customer satisfaction, as well as better economic returns.
The findings also contribute to the scarce empirical literature on the distinctive capabilities system and factors that influence it. Regarding the importance of leadership, future studies should clarify the contribution and relationship between this capability and the distinctive capabilities system.
This study supports the DCV to the extent that effective applications and reconfigurations of an SME’s idiosyncratic dynamic capabilities in terms of knowledge, skills and customer experience create superior performance. In conclusion, this study theorises about the DCV, underlining the importance of distinctive capabilities and its system. In a VUCA context, where an SME faces countless future challenges, it is worth investing resources and capabilities in building distinctive capabilities and in a system with the strength to provide for the SME’s current and future viability. In this conjunction, the distinctive capabilities system moderated by learning orientation forms a crucial management core for making an SME an economic success.
Limitations and future research
Like all research, our study has some limitations. Firstly, we focused on SMEs located in Portugal. Therefore, caution should be exercised in generalising these findings to other countries. Secondly, future research should also consider: (1) a representative and controlled sample that allows researchers to abstract the collected information to a larger population to ensure that bias is minimised and to allow generalisation of findings; (2) a sample with at least 300 respondents and (3) a more powerful statistical tool such as structural equation modelling. Thirdly, our choice of data collection was a cross-sectional design, a very common procedure in the strategic literature; however, this option limits the strength of the causal inferences that can be made. Thus, future studies that opt for a longitudinal design should strengthen or question our findings. For example, it would be interesting to re-examine the effects of moderation and mediation of leadership and learning orientation in a different population, other contexts and time performances.
We also encourage future studies to consider other constructs as moderators and mediators of the distinctive capabilities system that can influence the performance impact on SMEs, for instance, disruptive innovation and its influence on the system of distinctive capabilities.
The author thanks the editor and the two anonymous reviewers for their valuable comments and suggestions.
References
Further reading
Appendix Questionnaire
Since the sample consisted of Portuguese SMEs, the language of the questionnaire was English.
| Distinctive capabilities system measurement scale |
|---|
| DCS1 Your organisation has a clearly stated set of capabilities, such as, we do things better than anyone else, that customers value and which competitors cannot beat |
| DCS2 Your organisation’s capabilities support the way to create value in the market |
| DCS3 Your organisation’s capabilities reinforce each other to form an interlocking system |
| DCS4 Your organisation’s business draws on this superior capabilities system |
| DCS5 Your organisation’s capabilities adapt to different situations with ease |
| DCS6 Your organisation has resources (financial and physical assets, human, knowledge, etc.) that support your capabilities |
Source(s): Leinwand and Mainardi (2011)
| Leadership measurement scale |
|---|
| LC1 Is your organisation’s leadership reinforcing these capabilities? |
| LC2 How effective are your organisation’s top leaders in answering the fundamental questions about the business strategy/model and identity that will lead your organisation to long-term success? |
| LC3 How effective are your organisation’s top leaders at keeping the organisation on track in executing its business strategy/model? |
| LC4 Do all of your decisions add to our coherence? |
Source(s): Leinwand and Mainardi (2011)
| Learning orientation measurement scale |
|---|
| LO1 We provide training focused on team building and teamwork skills training |
| LO2 Performance appraisals are used primarily to set goals for personal development |
| LO3 Performance appraisals are used to plan skills development and training for future advancement within the organisation |
| LO4 The process of training and development has helped to increase my skills |
| LO5 The content of training and development meets my needs |
| LO6 I can easily mention two or three things I learned during the training and development |
| LO7 I still remember the main things I learned in the process of training and development |
| LO8 I have never thought of the things I learned in the process of training and development |
| LO9 I have applied what I learned in the process of training and development to improve my performance |
| LO10 What we learned in the process of training and development has helped me greatly improve my work |
| LO11 I have applied in my daily work most of what I learned in the process of training and development |
Source(s): Collins and Smith (2006), Velada (2007) and Tesluk et al. (1995)
| Non-financial performance measurement scale |
|---|
| NFPER1 Customer satisfaction in your organisation has increased in the past two years |
| NFPER2 Customer loyalty in your organisation has improved in the past two years |
| NFPER3 Employee satisfaction in your organisation has increased in the past two years |
| NFPER4 Your organisation’s image has been strengthened in the past two years |
| NFPER5 How successful do you consider your organisation to be? |
| NFPER6 The effort put in by employees/collaborators is in agreement with expectations |
Source(s): Avci et al. (2011)
| Financial performance measurement scale |
|---|
| FPER1 Your profitability/balance has increased in the past two years |
| FPER2 Your sales/incomes have increased in the past two years |
| FPER3 Your costs have decreased in the past two years |
| FPER4 The overall organisational performance increased in the past two years |
| FPER5 The position on the ladder/table is in agreement with expectations |
Source(s): Avci et al. (2011)

