The study aims to examine the factors influencing financial inclusion among rural households in the Barak Valley region of Assam.
A multi-stage sampling design was used to gather data using a structured interview schedule. The study employed beta regression to analyse the factors influencing financial inclusion among rural households, accounting for both traditional and digital aspects.
Beta regression analysis reveals that education, income, permanent employment and proximity to bank branches exert a statistically significant positive influence on overall financial inclusion, whereas age has a significant negative impact. For traditional financial inclusion, these factors, along with self-help group (SHG) membership, demonstrate a significant positive effect. In contrast, while age, education, closer proximity, income and religion positively determine digital financial inclusion, SHG membership has a significant adverse effect in this digital context.
The study contributes to the literature by empirically identifying the socio-economic and demographic determinants of traditional and digital financial inclusion among under-researched rural households in the Barak Valley region of Assam.
The present study contributes to the existing literature by providing a detailed, region-specific analysis of the factors influencing financial inclusion among rural households in the Barak Valley of Assam, a relatively under-researched area in empirical studies. By examining socio-economic and demographic factors, the study offers a contextual understanding of how financial inclusion is affected by local realities, including income levels, education, distance to financial institutions and other factors.
1. Introduction
Sustained economic growth has been one of developing Asia's most notable achievements, lifting millions of people out of poverty and transforming the region into a key driver of global progress. However, despite these achievements, poverty remains a serious problem, and recent trends point to a worsening of income inequality. This imbalance raises concerns about the inclusiveness of growth and its ability to deliver long-term social stability. The key challenge before policymakers, therefore, lies in extending the benefits of economic expansion to a wider segment of the population, particularly the poor and marginalised. Financial inclusion plays a vital role in this process, as broader access to savings, credit, insurance and other financial services is increasingly recognised as a powerful instrument for reducing poverty and narrowing inequality, thereby fostering more equitable and sustainable development (Park & Mercado, 2018). Financial inclusion aims to integrate marginalised and vulnerable groups within the framework of the formal financial system. This initiative is particularly vital for low-income populations, enabling them to access timely and affordable credit, as well as other essential financial services. Over the past decade, achieving financial inclusion has been a key focus for many developing nations, paralleling the goals of inclusive growth and social equity (Prasuna, Kasturi, & Annemalla, 2024). The economic development of a nation is closely tied to the extent of its financial inclusion. Policymakers around the globe have increasingly promoted financial inclusion as a vital development strategy, underscoring its importance for fostering inclusive economic growth (Nayak et al., 2024). The relationship between inclusive financial systems and various sustainable development goals (SDGs) has further emphasised this necessity. Governments have undertaken numerous initiatives aimed at enhancing financial inclusion, including the Pradhan Mantri Jan Dhan Yojana (PMJDY) and the Atal Pension Yojana (APY). These programs have made significant strides in advancing financial inclusion in India. The PMJDY has not only succeeded in extending financial services to diverse geographic regions but has also played a crucial role in assisting communities during COVID-19 pandemic. Similarly, the rise in enrolments in the APY showcases progress towards expanding pension coverage among unorganised sector workers (Ann Jennifer, 2024).
Such initiatives have led to notable advancements in global financial inclusion. According to the Global Findex Database (2021), global account ownership has increased to 76% of the world's population, with 71% of this figure coming from developing nations. Furthermore, there has been a marked reduction in the gender gap in account ownership within developing countries, decreasing from 9% to 6%. The financial technology (Fintech) sector has emerged as a significant influencer in transforming international banking and payment systems. By providing innovative, user-friendly and affordable digital transaction solutions, Fintech has revolutionised access to financial services. This digital transformation enhances accessibility, efficiency and inclusiveness, thereby reshaping the global financial landscape (Agarwal, 2025). However, despite these positive advancements in financial inclusion, notable challenges persist, particularly in rural areas. A significant portion of newly opened accounts remains inactive. The Economic Times reports that approximately 11.30 crore of the 54.03 crore accounts opened under PMJDY are inoperative as of November, 2024. This statistic highlights that simply opening a bank account does not equate to true financial inclusion. The factors that influence financial inclusion are multifaceted. Factors such as landholdings, gender, caste, family structure and distance to banking facilities all contribute to the financial inclusion in rural households (Nayak et al., 2024). Furthermore, factors like income levels, educational background, age and gender also play a significant role in shaping informal borrowing and saving behaviours (Dar & Ahmed, 2021).
Focusing on the state of Assam, the financial inclusion levels of rural households are lower than the national average (Debnath & Paul, 2024). Key contributors to financial inclusion in the state include educational attainment, income levels and awareness of self-help groups (SHGs). Additionally, closer proximity to post office banks has been shown to increase the likelihood of financial inclusion. Nevertheless, simply having access to geographic or government benefits is insufficient to guarantee financial inclusion, but evidence suggests that individuals receiving government assistance in rural areas demonstrate a greater degree of financial inclusion compared to their counterparts who do not (Bhanot, Bapat, & Bera, 2012). However, there is a notable lack of systematic studies examining the factors that determine financial inclusion, specifically in rural regions of Assam. Understanding these factors is crucial for formulating policies that go beyond simple account ownership and instead promote practical usage and higher-quality financial services. Against this backdrop, it is important to identify and understand the underlying factors that contribute to financial inclusion. Gaining insights into these determinants will enable government officials and policymakers to develop targeted strategies that promote financial inclusion.
The structure of the paper is outlined as follows: Section 2 provides a review of the relevant literature, Section 3 explains the methodology applied in the study, Section 4 presents the findings and discusses the results, and Section 5 provides conclusion of the study along with policy implications.
2. Review of literature
2.1 Theoretical framework
The foundational architecture of financial inclusion is structurally grounded in several multi-dimensional economic and social theories. Demirguc-Kunt, Klapper, and Singer (2017) conceptualize financial inclusion as stable access to, and the active utilisation of, regulated, safe, and sustainable financial services. Building upon how these systems deploy across populations, Ozili (2020) outlines three core paradigms.
The public good theory: Posits that formal financial infrastructure functions as a non-rivalrous, non-excludable public asset that must be accessible to all members of society to optimise collective welfare.
The vulnerable group theory: Asserts that financial integration framework development must intentionally target socio-economically exposed segments (e.g. the poor, youth, women, and elderly) who absorb disproportionate damage during macroeconomic contractions.
The financial literacy theory: Establishes that human capital cultivation and financial education act as the primary operational entry gateways, accelerating an individual's voluntary transition into formal banking institutions.
Complementing these frameworks, the Bottom of the Pyramid (BoP) Theory developed by Prahalad and Hart (2002) reimagines low-income cohorts as dynamic, underserved consumer segments rather than passive welfare recipients. Applied to rural financial landscapes, the BoP framework demonstrates that customising accessible, low-cost microfinance products helps integrate structurally marginalised households into broader national asset-building cycles.
2.2 Macro and structural determinants of financial inclusion
Empirical literature divides the structural drivers of banking integration into supply-side infrastructure and demand-side capacities (Ongeta, 2019). Globally, financial development strongly correlates with macroeconomic stability, institutional governance metrics, and regional conflict settlement parameters (Murshed et al., 2023; Sapre, 2025).
On the supply side, the physical penetration, proximity, and institutional outreach of banking facilities fundamentally determine deposit and credit mobilization trends (Kumar, 2011; Kumar Vaid, Singh, & Sethi, 2020). Beyond physical brick-and-mortar networks, national financial inclusion execution relies heavily on targeted public policy initiatives and state-sponsored safety nets. In the Indian context, government programs like the Pradhan Mantri Jan Dhan Yojana (PMJDY) and the Atal Pension Yojana (APY) have structurally transformed rural account ownership dynamics, demonstrating that state-administered direct transfers act as robust catalysts for baseline financial integration (Ann Jennifer, 2024).
2.3 Socio-economic and demographic correlates
A deep consensus within South Asian and cross-country empirical literature demonstrates that individual socio-economic characteristics heavily dictate formal banking system interaction. Table 1 summarises the synthesis of existing studies.
2.4 Gender asymmetries, institutional barriers and collective frameworks
Despite aggressive financial modernization policies, systemic gender and demographic disparities persist. Women, rural agricultural households and lower-caste groups face severe structural frictions – such as high documentation compliance hurdles, strict collateral specifications and physical distance penalties – that limit autonomous bank account operation (Kaur & Kapuria, 2020; Giron, Kazemikhasragh, Cicchiello, & Panetti, 2021; Antil, Swain, & Kumar, 2022; Valera, Lei, & Fong, 2025).
To counter these institutional barriers, community-driven microfinance strategies, particularly the SHG-Bank Linkage model, have been deployed extensively. Empirical assessments show that group-based credit and savings frameworks significantly compress social exclusion risks, mitigate rural household vulnerability and empower marginalized women to build independent livelihoods (Roy & Biswas, 2016; Maity, 2023).
2.5 The digital transformation and ecosystem frictions
Recent literature shifts heavily towards studying how financial technology (Fintech), mobile transaction systems and the Unified Payments Interface (UPI) drive financial inclusion (Agarwal, 2025; Bhattacharyay, Roy, & Kumar, 2025). Digital financial platforms frequently serve as critical operational pathways that bypass physical distribution limits and lower transaction processing costs (Shaban, Ayadi, Forouheshfar, Challita, & Sandri, 2024).
However, digital adoption does not progress uniformly. Empirical research indicates that digital financial integration is highly sensitive to underlying socio-economic parameters, skewing heavily towards younger, wealthier and more educated demographic strata (Ghosh and Hom Chaudhury, 2020; Ali & Ghildiyal, 2023). Furthermore, distinct institutional frictions manifest at the intersection of traditional and digital spaces; specific religious beliefs can show negative correlations with technological finance adoption (Ahamadou & Agada, 2023). Crucially, digital systems often fail to seamlessly onboard less educated, rural or structurally vulnerable populations who remain insulated by localized digital literacy deficits (Berguiga & Adair, 2025).
2.6 Literature gap and research contribution
While the literature covering financial inclusion in India is expanding, serious empirical gaps persist.
Macro-centric bias: The bulk of existing research centres on aggregated national-level datasets or economically developed urban clusters, leaving remote rural settings under-analysed.
Geographic marginalisation: Household-level financial inclusion research within the unique, complex socio-economic topography of Northeast India – and specifically the structurally impoverished Barak Valley region of Assam – remains deeply scarce (Bhanot et al., 2012; Chinngaihlian & Chavan, 2022; Debnath & Paul, 2024).
Methodological homogeneity: Existing studies frequently employ restrictive, single-indicator metrics that fail to isolate structural variances across different banking domains.
This study directly addresses these analytical deficiencies by introducing a multi-dimensional methodological framework. Rather than utilising single proxy metrics, we construct distinct, bounded composite financial inclusion indices for overall (CFII), traditional (CTFII) and digital (CDFII) ecosystems. These are rigorously built following the Reserve Bank of India's quality-use-access weights and modelled via a fractional beta regression setup. Theoretically, this research moves past generalised assumptions of linear digital transition by exposing critical operational frictions between traditional group-based frameworks and independent digital migration. By mapping these localised dynamics within Assam's poorest sub-region, this study provides an essential empirical corrective to homogenised financial expansion narratives across South Asia.
This study advances the existing literature on financial inclusion in India and South Asia by introducing a distinct multidimensional methodological framework and a nuanced theoretical perspective on household financial behaviour in economically marginalised regions. Methodologically, the research departs from conventional national-level studies that frequently rely on restrictive, single-indicator metrics by developing distinct, bounded CFII, CTFII and CDFII. These indices are rigorously modelled using a fractional beta regression framework and are structured around the Reserve Bank of India's weighted methodology, which prioritises actual service utilisation by assigning 45% weight to usage, 35% to access and 20% to quality. Theoretically, the paper extends the financial literacy theory and the bottom of the pyramid (BoP) theory to a highly contextualised sub-regional environment, demonstrating that localised socio-economic realities generate fundamentally divergent determinants for traditional vs digital systems. The primary theoretical contribution lies in uncovering the contrasting institutional role of SHG membership; while participation in these groups significantly fosters traditional financial integration and mitigates social exclusion, it exerts a statistically significant adverse effect on digital financial inclusion. This empirical divergence illustrates that while community-based, collective frameworks successfully socialise vulnerable rural households into conventional banking networks, they can simultaneously act as an institutional anchor that binds members to traditional practices, thereby inadvertently impeding independent digital migration.
The novelty of this study is reinforced by contrasting its micro-level household data with recent literature on digital financial inclusion. While contemporary South Asian studies often treat digital adoption as a linear progression or an automatic gateway that bypasses physical banking barriers, this paper exposes a critical operational friction between traditional and digital ecosystems.
Specifically, recent research typically assumes a synergistic relationship between microfinance networks and fintech adoption. In contrast, this study empirically demonstrates that self-help group membership (SHGM) – while significantly accelerating traditional banking integration – explicitly hinders digital adoption by anchoring vulnerable households to collective, traditional banking habits. Furthermore, while some recent digital finance literature suggests that adoption increases with age due to financial stability, this research establishes a strict negative relationship, highlighting a pronounced digital divide driven by a severe deficit in digital literacy among older rural cohorts. By identifying these divergent structural drivers within Assam's poorest sub-region, the paper provides an essential empirical corrective to homogenized narratives of digital financial expansion across India and South Asia. Against this backdrop, the study aims to investigate the factors influencing financial inclusion among rural households in the Barak Valley of Assam.
3. Data source and methodology
3.1 Sample design
The present study is based on primary data collected from rural households using a structured interview schedule. Data were gathered from households in three districts of Assam's Barak Valley region, viz. Cachar, Sribhumi and Hailakandi, which were selected due to their comparable socio-economic and demographic characteristics. This region faces significant challenges in accessing formal financial services, which limit opportunities for savings, investments and risk management. Additionally, low financial literacy levels contribute to the exclusion of individuals from the formal financial system, exposing them to exploitative financial practices. The Barak Valley region also lags in educational attainment; according to the 2011 Census, its literacy rate stands at 76.27%. Furthermore, according to the National Multi-Dimensional Poverty Index, 2023 report by NITI Aayog, Barak Valley is identified as the poorest region in Assam. Given the relatively high poverty levels and low educational attainment among rural households in these districts, a structured interview schedule was deemed appropriate for data collection.
A multi-stage sampling design has been employed for data collection in this study.
Stage 1: Five community development blocks are selected from the 27 in Barak Valley using a Block Level Financial Inclusion Index (BLFII), which evaluates accessibility to financial services through three indicators (number of financial institutions per 100 villages, number of financial institutions per 10,000 households and number of financial institutions per 100,000 population). Upon establishing the BLFII, the blocks have been systematically ranked according to their respective financial inclusion index (FII) scores. To further categorise these blocks for selection purposes, they have been divided into distinct groups based on their FII rankings, specifically: Group 1: Blocks ranked between 1–5 - Group 2: Blocks ranked between 6–10, Group 3: Blocks ranked between 11–15, Group 4: Blocks ranked between 16–21 and Group 5: Blocks ranked between 22–27. One block is randomly chosen from each of five categorized groups (Roy & Nath, 2025).
Stage 2: Two villages are selected from each block, one with at least one bank within its geographical area and another without any bank.
Stage 3: Households are randomly selected within these villages. One adult member, who is the head of the household, is interviewed using a structured schedule to gather data on financial decisions and experiences.
The sample size for the study was calculated based on Yamane's (1967) formula for finite population. This formula is used for calculating the sample size when the population is known, which is applicable in this case since the total number of households in each village is provided in the 2011 population census.
where n = Sample size, N = Population size and e = Sampling error and it is 0.05.
A total of 405 responses were collected and utilised for the purpose of analysis. The final analysis is based on the data recorded through the structured interview schedule (n = 405). The interview schedule is organised into four distinct sections: the first section captures demographic details of the respondents; the second section explores their access to financial services; the third section examines how frequently and to what extent these services are used; and the fourth evaluates the quality of financial services received by rural households.
3.2 Research methodology
In the current study, the CFII is constructed as a crucial metric for measuring financial inclusion among rural households. This index is considered a dependent variable in the analysis, helping to identify the factors that affect financial inclusion.
To measure the CFII, we first assessed percentage positive scores (PPS), which represent the proportion of positive responses to the total number of questions (Debi, Debnath, & Paul, 2025). We calculated the PPS separately for three key dimensions of financial inclusion: access to financial services (Access), usage of financial services (Use) and quality of financial services (Quality) (Paul & Debnath, 2025; Debnath & Shil, 2026).
Finally, we computed the CFII following the methodology proposed by the Reserve Bank of India, wherein the highest weight is assigned to usage (45%), followed by access (35%) and quality (20%). This weighting scheme reflects the theoretical understanding that mere access to financial services is insufficient unless accompanied by their effective utilization. The approach is consistent with the broader financial inclusion literature and aligns with institutional frameworks developed by the Reserve Bank of India, which emphasize outreach, penetration and usage of financial services.
The selection of indicators, such as bank account ownership, access to credit and the use of digital financial services is theoretically grounded in financial intermediation theory. This perspective conceptualizes financial systems as facilitators of efficient resource allocation, reduction of transaction costs and enhancement of economic participation.
Therefore, following equation estimates the CFII-
3.3 Methodological justification of weighting and robustness testing
The structural construction of the CFII in this study relies on a unequal weighting framework, assigning 45% weight to usage, 35% to access and 20% to quality. This specific distribution is theoretically and institutionally grounded in the framework established by the Reserve Bank of India (RBI) for assessing meaningful financial deepness. Methodologically, assigning the highest weight to usage reflects the contemporary shift in economic literature from simple physical supply-side availability (access) to actual demand-side consumption (usage). Mere proximity to a bank branch or the possession of an inoperative account does not constitute authentic financial inclusion; rather, the frequency, volume and regularity of transactions provide the true measure of economic integration. Access serves as a mandatory structural prerequisite, justifying its substantial 35% share, while quality, capturing the experiential dimension, financial literacy and user safety constitutes a critical but smaller optimization component weighted at 20%.
The utilisation of three distinct empirical models – the CFII in Model 1, the CTFII in Model 2 and the CDFII in Model 3 provides a comprehensive framework for validating the robustness of the findings. Methodologically, evaluating a single aggregated index can mask underlying localised frictions and oversimplify structural variations across banking sub-sectors. By disaggregating financial inclusion into traditional and digital domains, this tri-model layout functions as an empirical validation test, ensuring that the documented socio-economic and demographic determinants are stable, structurally invariant and not mere artefacts of a generalised index composition.
The econometric analysis in this study is executed utilizing the beta regression framework, an approach methodologically superior to standard ordinary least squares (OLS) estimations given the bounded nature of the dependent variables (CFII, CTFII and CDFII). Because the composite financial inclusion indices are structurally constrained within a strict closed interval of 0 to 1, classical linear regression models are technically inappropriate as they frequently generate predicted values outside permissible logical boundaries and violate the assumption of homoskedasticity. Beta regression inherently resolves these constraints by assuming a flexible beta distribution that naturally accommodates the skewness common in household socio-economic indices, while applying a logistic link function to ensure all predicted scores remain within the continuous (0, 1) interval. The model further establishes robust parameters by implicitly incorporating heteroskedasticity through its mean–variance relationship. To satisfy the rigorous open-interval requirement of the beta distribution, the methodology handles boundary conditions transparently; while the entire sample of 405 households is preserved for the overall and traditional models, 40 households with an absolute digital inclusion score of zero are methodologically excluded from Model 3. This structural truncation preserves a clean, continuous distribution for the remaining 365 households, ensuring that the estimated coefficients isolate genuine structural drivers among active digital adopters without suffering from statistical distortions caused by arbitrary mathematical data transformations.
3.3.1 Model 1
3.3.1.1 Response variable
The dependent variable in this study is CFII, which is bounded between 0 and 1. The use of linear regression is inappropriate in this context, as it may violate assumptions of normality and homoscedasticity and can produce predicted values outside the admissible range. Beta regression ensures that predicted values remain within the (0, 1) interval (Ferrari & Cribari-Neto, 2004).
The CFII has been constructed using three parameters, i.e. access, usage and quality of financial services.
The study employs beta regression, which inherently models heteroskedasticity through its mean–variance relationship; therefore, separate heteroskedasticity tests are not required.
To address concerns related to the robustness of the model, a correlation matrix has been included to assess the degree of association among the explanatory variables and to check for potential multicollinearity.
3.3.1.2 Explanatory Variables
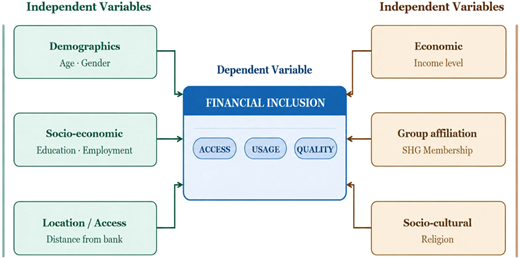
Eight explanatory variables have been considered for the study based on a literature survey. The definition and measurement scales of the variables and supporting literature related to the measurement and definition are presented in Table 2.
Figure 1 presents the conceptual framework highlighting the relationship between dependent and independent variables used in the study.
Regression model:
where, CFII i = Composite financial inclusion index of household i, bounded between 0 and 1.
Age i = Age of household head
SHGM i = Self-help group membership
Employment i = Employment type of household
Education i = Educational attainment of household head
Distance i = Distance to nearest financial institution
Income i = Household income
Gender i = Gender of household head
Religion i = Religious affiliation of household
μi = E () = Conditional mean of CFII
βi = Slope coefficients of explanatory variable
i = 1,2,3,…405 = sample households
3.3.2 Model 2
3.3.2.1 Response variable
In the current study, the CTFII has been treated as a dependent variable in the analysis and helps to identify the factors affecting traditional financial inclusion The CTFII is constructed using three parameters, i.e. access, usage and quality of traditional financial services.
3.3.2.2 Explanatory variables
Eight explanatory variables have been considered for the study based on a literature survey as used in Model 1 above.
Regression model:
where CTFII i = composite traditional financial inclusion index of household i, bounded between 0 and 1. And the independent variables are the same as those used in Model 1.
3.3.3 Model 3
3.3.3.1 Response variable
In the current study, the CDFII has been treated as a dependent variable in the analysis and helps to identify the factors affecting digital financial inclusion. The CDFII is constructed using three parameters, i.e. access, usage and quality of traditional financial services.
3.3.3.2 Explanatory variables
Eight explanatory variables have been considered for the study based on a literature survey as used in Model 1.
Regression model:
where CDFII i = composite digital financial inclusion index of household i, bounded between 0 and 1. And the independent variables are the same as those used in Model 1.
In the present study, 40 households have a digital financial inclusion score of 0, so the study excluded them to run the regression Model 3, as beta regression requires a non-zero value. Thus, the total sample size in the case of digital financial inclusion is 365.
4. Result and discussion
4.1 Result analysis
Table 3 summarises the demographic profile of the respondents. The study collected data from 405 respondents living in rural households in the Barak Valley region of Assam. The demographic profile of the respondents reveals a significant gender imbalance, with 90.1% male and only 9.9% female participants. In terms of religion, 57.8% are identified as Hindus, while 42.2% are Muslims, indicating a diverse religious composition. Regarding age, the largest group of respondents falls within the 25 to 40 years age range, comprising 40% of the sample. This is followed by 35% in the 41 to 50 years range, and 25% of the respondents are over 50 years old, suggesting a predominantly working-age population. Regarding education, 44% of respondents have between 5 to 10 years of formal schooling. Additionally, 15% have no education, 15% have more than 10 years of schooling and 26% have education up to the primary level. In terms of employment, 73.1% of the respondents have temporary source of employment, while only 26.9% have permanent source of employment, indicating a high level of employment insecurity among the respondents. In terms of caste distribution, the general and economically weaker section (EWS) categories constitute the largest group at 57.04% i.e. 231 individuals, followed by other backwards classes (OBC) at 26.42% i.e. 107 individuals and scheduled castes (SC) at 16.54% or 67 individuals, which is the smallest group. Regarding income, majority of respondents, specifically 47.90%, fall into the income bracket of ₹16,000 to ₹30,000. Moreover, a notable 44.44% of the participants earn up to ₹15,000, while only 7.65% of individuals report incomes exceeding ₹30,000.
The descriptive statistics presented in Table 4 reveal that the average CFII is 0.243, which indicates a low level of financial inclusion among the sample households. The moderate variability, represented by a coefficient of variation (CV) of 0.455, suggests that financial inclusion levels are relatively consistent across households. The average age of the respondents is 45 years, with low variability (CV = 0.219), indicating that most respondents are middle-aged with very less age difference among them. On average, respondents have completed 7 years of schooling, suggesting they have completed primary or middle school education. However, the CV of 0.571 reflects moderate to high variation in education levels, indicating a mix of low to moderately educated individuals. The average household income is ₹18,538, with a CV of 0.429, suggesting moderate income disparity.
The correlation among dependent and independent variables is used to investigate the issue of multicollinearity in the model. Table 5 presents the outcome of the correlation analysis. The results indicate that the correlations are within acceptable limits, suggesting that multicollinearity is not a serious issue. The table depicts that there is a statistically significant relationship between the CFII (dependent variable of the present study) and various independent variables. Independent variables includes Education, Employment, Distance, Income and Religion, which have a positive and significant association with CFII. However, Age, SHGM and Gender have a negative and significant association with CFII.
The econometric analysis executed in the paper utilizes a fractional beta regression framework to evaluate the determinants of the CFII presented in Table 6. This technique is methodologically superior to standard OLS estimations given the bounded nature of the dependent variable, which is structurally constrained within a strict closed interval of 0 to 1. Utilising linear regression in this context would violate the assumptions of normality and homoskedasticity, frequently generating predicted values outside permissible logical boundaries. Diagnostic indicators confirm a robust overall model fit, as evidenced by a highly significant likelihood ratio chi-square statistic (χ2 = 656.90, p < 0.001), proving that the explanatory variables collectively enhance the prediction of household financial inclusion. Furthermore, the primary diagnostic checks from the correlation matrix indicate that multicollinearity is within acceptable statistical limits, ensuring that the estimated coefficients isolate genuine structural drivers without inflation or distortion.
The beta regression results in Table 6 identify age as a statistically significant negative determinant of financial inclusion, indicating that older household heads experience lower levels of institutional financial integration. This dynamic aligns with the empirical findings of Abdu, Buba, Adamu, and Muhammad (2015) regarding widening demographic access gaps, but it directly contrasts with the research of Badar, Anwar, and Naqvi (2020), who reported that older individuals exhibit higher financial inclusion due to accumulated lifetime assets. It also diverges from the non-linear, inverted U-shaped life-cycle relationship documented by Sanderson, Mutandwa, and Le Roux (2018), suggesting that unique sub-regional constraints in the Barak Valley – such as severe deficits in technological and functional literacy among older generations – render ageing a linear barrier to inclusion. Conversely, educational attainment exerts a powerful positive influence on the CFII score, strongly validating Ozili's (2020) financial literacy theory, which posits that human capital development serves as the primary operational entry gateway for navigating complex formal banking systems.
In terms of economic capacity, both household income and a permanent employment status display highly significant positive associations with financial deepness. These findings empirically reinforce Prahalad and Hart's (2002) Bottom of the Pyramid (BoP) theory by demonstrating that regularizing rural labour streams and scaling economic resources successfully transition vulnerable cohorts from passive welfare recipients into active consumers of formal financial products. Furthermore, geographic proximity remains a critical supply-side driver; households situated closer to financial institutions exhibit significantly higher inclusion scores, corroborating the structural infrastructure models of Kumar (2011) and Kumar Vaid et al. (2020). Sociocultural dynamics also appear prominent, as belonging to the Hindu community correlates positively with financial inclusion, a finding that aligns with studies by Ghosh (2020) and Nayak et al. (2024), highlighting the asymmetric impacts of localised socio-religious realities on institutional trust and financial access.
A critical departure from mainstream South Asian literature is observed in the statistical insignificance of both gender and SHGM within the aggregate regression model of Table 6. The insignificance of gender contrasts sharply with cross-country empirical studies by Kaur and Kapuria (2020) and Giron et al. (2021), which highlight severe institutional gender penalties and documentation frictions that restrict autonomous banking operations for women. Similarly, the lack of statistical significance for SHG membership appears to contradict extensive microfinance literature, such as Maity (2023) and Roy and Biswas (2016), which positions group-based frameworks as universal catalysts for compressing social exclusion and rural vulnerability.
The authors resolve this apparent paradox by leveraging their tri-model layout, demonstrating that the aggregate index masks a powerful operational friction between traditional and digital financial ecosystems. While SHGM has a robust, significant positive impact on traditional financial inclusion by institutionalising collective savings and conventional credit (Model 2), it exerts a statistically significant adverse effect on digital financial inclusion (Model 3). This empirical divergence indicates that while community-based microfinance models successfully transition vulnerable rural households into traditional banking systems, they simultaneously act as institutional anchors that bind members to cash-based, localised practices, thereby inadvertently impeding independent digital migration. Because these opposing traditional and digital structural forces operate concurrently within the rural households of the Barak Valley, they mathematically offset each other within the overall CFII, resulting in the aggregate statistical insignificance observed in Table 6.
The regression results presented in Table 7 reveal a negative and statistically significant relationship between age and traditional financial inclusion, suggesting that as individuals age, their levels of financial inclusion tend to decrease. In contrast, several other factors demonstrate significant positive influences on financial inclusion. Education plays a pivotal role; individuals with higher levels of education are more likely to engage with traditional financial services. Similarly, employment status is a significant predictor, with those in permanent employment more likely to be financially included. Income also emerges as a crucial factor, with higher earnings positively correlating with financial inclusion. This relationship suggests that individuals with greater financial resources are more equipped to navigate and utilise financial services effectively. Moreover, distance to financial institutions further influences access, emphasising that individuals residing closer to financial institutions are at an advantage, which may also reflect the success of outreach programs or digital finance in bridging geographical barriers. Additionally, religious affiliation appears to play a role, with individuals from the Hindu community exhibiting higher levels of traditional financial inclusion compared to other religious groups. This finding is in line with the study by Dagnachew and Mawugatie (2022), Valera et al. (2025), Raichoudhury (2020) and Ghosh (2020). Participation in SHGM is another factor positively associated with financial inclusion. Membership in these groups tends to foster a supportive community environment, facilitating access to and usage of financial products and services. This is in line with existing studies by Maity (2023), Roy and Biswas (2016) which reported that women opened savings accounts, took out enough loans to purchase a Sal leaf sewing machine and puffing machine, used ATMs, etc., and spent enough money on family expenses after joining the SHG and also reported that membership in SHGs enhances financial inclusion and reduces social exclusion as well. However, gender does not demonstrate a significant effect on traditional financial inclusion in this analysis. The overall model fit is strong, with a highly significant likelihood ratio test [LR χ2(8) = 550.25; Prob > χ2 = 0.0000], confirming that the selected variables effectively explain variation in financial inclusion.
In a nutshell, the findings highlight that education, income and employment should be central to financial inclusion policies. At the same time, age-sensitive and gender-sensitive strategies are needed to address gaps, and the role of digital finance in overcoming distance barriers should be further strengthened. Recognising socio-religious dynamics can also help design more inclusive and culturally responsive programs.
In our survey, 40 households had a digital financial inclusion score of 0, so we excluded those households from the regression, as beta regression requires a non-zero value to investigate the factors affecting digital financial inclusion.
The beta regression results for CDFII highlight several important determinants of digital financial inclusion presented in Table 8. The overall model is highly significant, with a likelihood ratio chi-square of 273.42 and a probability value of 0.0000, confirming that the included variables collectively explain variation in digital inclusion outcomes.
Age has a negative and significant effect. This indicates that as individuals grow older, their likelihood of participating in digital financial services decreases. The result suggests that older populations may face barriers such as limited digital literacy or reluctance to adopt new technologies. In contrast, education exerts a strong positive influence, with a coefficient of 0.0884. Each additional year of education substantially increases the log-odds of digital financial inclusion, underscoring the importance of literacy and awareness in enabling individuals to use digital platforms effectively. Income also plays a significant role, even though the coefficient appears small. Because income is measured in absolute units, increases in earnings translate into meaningful improvements in digital inclusion. This reflects the affordability dimension of digital finance, higher income levels allow individuals to access devices, internet connectivity and digital services more easily. This finding aligns with existing studies by Ghosh and Hom Chaudhury (2020) and Ali and Ghildiyal (2023), which revealed that age, income and education significantly affect the accessibility of digital financial inclusion. Also, these factors have a significant impact on the use of digital financial services, including using the Internet or a mobile phone to make and receive payments. However, both studies reported that as age increases, digital financial inclusion also increases. This contrasts with the current study, which finds a negative relationship between age and digital financial inclusion, indicating that older individuals in the selected region are less digitally financially included than the younger ones because of lack of digital financial literacy among the older individuals. Religion also shows a positive and significant effect (0.2234), suggesting that socio-cultural or community factors influence digital financial participation, possibly through collective practices or targeted outreach. This is in line with the study by Ahamadou and Agada (2023), which stated that religious belief has a negative relationship with the adoption of financial technology.
On the other hand, employment status and gender are not statistically significant in this model. Employment has a negative coefficient (−0.1639), but the effect is not strong enough to be conclusive. Similarly, gender shows a positive coefficient (0.1913), but it is not statistically significant, indicating that men and women have similar levels of digital financial inclusion once other factors are controlled. Interestingly, SHGM has a negative and significant effect (−0.1460), implying that individuals in SHGs may rely more on traditional financial practices and are less likely to adopt digital platforms independently.
4.2 Comparison between determinants of traditional and digital CFII
The comparison of traditional and digital financial inclusion reveals important differences in their determinants. Age is a barrier in both models, but the negative effect is stronger for digital inclusion, showing that older individuals face greater challenges in adopting technology-based financial services. Education plays a positive role in both, yet its impact is far more pronounced in digital inclusion, highlighting the importance of literacy and awareness for navigating digital platforms. Income also contributes positively to both forms of inclusion, but its effect is stronger in digital finance, reflecting the costs associated with devices, Internet access and digital transactions.
Employment and SHGM show contrasting patterns. Employment significantly boosts traditional inclusion, likely through salary accounts and formal banking channels, but it has no meaningful effect on digital inclusion. Similarly, SHGM supports traditional inclusion, whereas it negatively affects digital inclusion, suggesting that SHGs remain rooted in collective, traditional practices rather than digital adoption. Distance is a significant driver in traditional inclusion, with greater distance surprisingly associated with higher inclusion, possibly due to outreach programs or mobile banking initiatives. However, distance is not relevant in digital inclusion, as digital platforms bypass physical barriers.
Religion consistently shows a positive and significant effect in both models, indicating that socio-cultural and community factors shape financial behaviour across traditional and digital domains. Gender, on the other hand, is not significant in either case, suggesting parity in access once other variables are controlled. Overall, traditional inclusion depends more on employment, SHGs, and outreach, while digital inclusion is driven by education, income, and socio-cultural factors but hindered by age and reliance on traditional group practices. This distinction underscores the need for differentiated policy strategies: strengthening employment-linked and community-based programs for traditional inclusion, while focusing on digital literacy, affordability and age-sensitive interventions for digital inclusion.
4.3 Potential endogeneity and study limitations
While this study identifies several significant socio-economic and demographic determinants of traditional and digital financial inclusion, the econometric estimations may be subject to potential endogeneity bias arising from reverse causality and omitted variables. Specifically, bidirectional relationships may exist between the dependent variables and predictors such as household income and SHGM; while higher income and SHG participation are hypothesised to drive financial integration, enhanced financial inclusion simultaneously empowers households to optimise livelihoods, generate higher income and join community networks. Furthermore, unobserved household characteristics – such as innate risk appetite, behavioural traits and psychological trust in the banking sector – could not be quantified, potentially introducing omitted variable bias into the beta regression models. Future research could mitigate these endogeneity concerns by employing instrumental variable approaches or longitudinal panel data to establish definitive causal pathways.
Beyond these econometric challenges, several inherent structural limitations must be acknowledged when interpreting the empirical findings. Geographically, the study is strictly confined to rural households within the Barak Valley region of Assam, meaning the localised socio-economic, cultural and infrastructural realities may limit the external validity and generalizability of the findings to other rural contexts across India. Additionally, the reliance on cross-sectional data captures a static snapshot of household behaviour, which fails to account for temporal shifts or seasonal income fluctuations characteristic of rural agricultural economies. The primary data collection method is also inherently susceptible to self-reported response and recall biases regarding sensitive metrics like monthly income. Finally, the methodological requirement to exclude 40 households with a score of zero to satisfy the open-interval $(0, 1)$ parameter of the digital beta regression model introduces a minor sample selection truncation, meaning the digital insights are strictly applicable to households that have already initiated their digital migration.
5. Conclusion and implication
5.1 Conclusion
Financial inclusion is increasingly recognised as a critical enabler in the pursuit of the sustainable development goals (SDGs). It plays a vital role in alleviating poverty and reducing inequality, particularly in underserved regions. The present study aims to explore the factors influencing financial inclusion among rural households in the Barak Valley region of Assam. The study identifies several key determinants of financial inclusion. Notably, age, education level, employment type, distance to the nearest bank, income and religion significantly influence an individual's financial inclusion. On the other hand, membership in SHGs and gender do not have a significant impact on overall financial inclusion. In the case of traditional financial inclusion, age, education level, employment type, distance to banks, income and religion have a significant impact. Specifically, younger individuals, those with higher levels of education, individuals with permanent employment, those living in villages with financial institutions, individuals with higher incomes and individuals belonging from the Hindu community have higher levels of traditional financial inclusion compared to their counterparts. However, gender does not have a significant impact on traditional financial inclusion. For digital financial inclusion, age, education, income, religion, and membership in SHGs are significant factors influencing financial inclusion, where, younger individuals, those with higher education levels, individuals with higher incomes and those who belong to the Hindu community and are members of SHGs exhibit higher levels of digital financial inclusion than others. In contrast, neither employment type nor gender shows any significant influence on digital financial inclusion.
These results, when viewed in light of existing theoretical frameworks, provide a nuanced understanding of financial inclusion. The impact of income and employment type can be explained by the BoP theory, developed by C. K. Prahalad and Stuart L. Hart. This theory emphasizes that economically disadvantaged groups face challenges in affordability and access, even though they represent a significant portion of the population. Additionally, the importance of education for both traditional and digital financial inclusion aligns with the financial literacy theory, given by Ozili (2020). This indicates that awareness and knowledge are crucial factors in improving access to and usage of financial services.
5.2 Policy implications based on empirical strength
In alignment with the empirical findings derived from the beta regression models, the policy implications for enhancing financial inclusion among rural households in the Barak Valley region are systematically prioritized based on the statistical strength and magnitude of their respective determinants. The most dominant determinant of financial inclusion, particularly within the digital sub-sector, is household income, which highlights that fundamental economic capacity heavily dictates the transition from simple account ownership to active service utilisation. To address this primary constraint, actionable interventions must focus on strengthening localised livelihood security by scaling up wage-employment initiatives, such as the Mahatma Gandhi National Rural Employment Guarantee Scheme (MGNREGS), to ensure direct and reliable cash inflows into formal accounts. Concurrently, banking institutions should introduce flexible micro-enterprise credit lines tailored to match rural, agricultural cash-flow cycles. Educational attainment emerges as the second most powerful driver across the models, underscoring a critical deficit in functional awareness. This necessitates the launch of a targeted “Digital Financial Saksharta Program” administered via mobile literacy units. This intervention must utilize localized vernacular mediums alongside visual and voice-assisted digital interfaces to successfully bypass formal literacy barriers among low-educated rural cohorts.
Geographic accessibility and proximity to physical banking infrastructure represent the third tier of empirical influence, confirming that distance remains a prominent structural friction point for traditional financial integration. To mitigate this physical barrier without incurring the high overhead costs of brick-and-mortar branches, policymakers should establish a subsidized “Banking Correspondent (BC) Aggregator Model”. This intervention involves setting up dedicated customer service points (CSPs) equipped with micro-ATMs and biometric systems within local retail spaces to bring essential transaction capabilities within a short walking distance of remote village clusters. Furthermore, the empirical analysis exposes a critical operational friction regarding SHGM, which strongly facilitates traditional banking integration but acts as a significant deterrent to digital financial inclusion. To rectify this divergence, an “SHG Digital Integration Model” must be deployed through platforms like NABARD's E-Shakti project. This initiative will structurally transition paper-based group ledgers into electronic formats and incentivize digital transaction mechanisms within community groups, effectively converting traditional networks into conduits for digital migration.
Finally, labour formalisation and demographic factors comprise the remaining layers of empirical strength within the study. Because permanent employment status significantly reinforces traditional financial access, commercial banks should develop specialized “Casual Labor Flexi-Accounts”. These accounts can leverage alternative credit scoring mechanisms – such as the consistency of mobile recharges and utility payments – to safely extend small-ticket overdraft facilities to vulnerable casual labourers who lack formal salary streams. In tandem, to address the pronounced digital exclusion identified among aging rural cohorts, fintech developers and financial institutions must mandate senior-friendly application architectures. These platforms should integrate simplified interfaces, high-contrast layouts and voice-guided assistance in local dialects alongside robust biometric fraud protections. By structuring policy responses around this empirically ranked framework, developmental bodies can efficiently allocate resources to target the most severe socio-economic and structural friction points holding back rural financial development.
5.3 Future scope
Building upon the empirical insights and structural boundaries identified in this research, several distinct avenues emerge for the future scope of the study. Geographically, because this investigation was strictly confined to rural households within the Barak Valley region of Assam, future research should expand its spatial boundary to encompass diverse rural and urban topographies across Northeast India to enhance the external validity and generalizability of these insights. Methodologically, future studies could transition from the current static snapshot provided by cross-sectional data to longitudinal panel datasets, which would effectively capture temporal shifts and seasonal income fluctuations characteristic of rural agricultural economies. Furthermore, researchers can utilize advanced econometric techniques, such as instrumental variable approaches, to definitively isolate and mitigate potential endogeneity biases arising from reverse causality between household income, group participation and financial deepness. Finally, given the critical friction uncovered between community networks and technological adaptation, there is an essential need for dedicated, comparative research to explore the targeted impact of specific fintech interventions, digital payment ecosystems and evolving mobile banking platforms within underserved populations.
Ethical approval and consent to participate
Primary data collected through personal interviews. Respondents were informed about the purpose of the exercise, i.e. Academic publication.