

Gateway communities are powerful assistance for national parks. By providing fundamental, ecological and cultural services, they effectively promote their own development, the parks’ comprehensive functions and public welfare.
This study first employs the ABCDE psychological model to reveal how nature-based experiences influence public pro-environmental awareness and behaviors. To better improve nature-based experiences in gateway communities, this study further employs a choice experiment. It is used to explore the public preferences for specific services in gateway communities.
(1) High-quality nature-based experiences enhance public pro-environmental awareness and behaviors. (2) Public preferences are hierarchical for gateway community services, particularly for ecological services, followed by cultural services and finally fundamental services. (3) Public preferences are heterogeneous for ecological and cultural services. Travelers seeking relaxation or companionship with friends prefer ecological services, whereas those with more leisure time, staying accommodated in gateway communities, traveling for entertainment or traveling with elders’ value cultural services more. (4) Moreover, the public can be categorized into experience-focused, environment-focused and price-focused groups.
Accordingly, this study proposes to prioritize ecological services and innovate cultural services in gateway communities. It also recommends three types of communities with distinctive functions for different groups. These findings offer empirical insights for the man–land relationship and sustainability of national parks and other protected areas worldwide.
1. Introduction
National parks and their neighboring gateway communities are interdependent, sharing economic, environmental and cultural benefits (Wei et al., 2024; Xie and Wang, 2024). With fewer restrictions, worldwide gateway communities have effectively helped national parks solve the conflicts between conservation and development. They transform national parks’ valuable resources into fundamental, ecological and cultural services. Through these services, gateway communities could promote their own development and the parks’ recreational and educational functions (Panta and Thapa, 2018; Qi et al., 2024). Moreover, these nature-based services enable the public to get closer to nature, thereby promoting pro-environmental awareness and behaviors (Wu and Wang, 2022; Liu et al., 2025; Li et al., 2024). This positive interaction harmonizes man–land coexistence. It is therefore essential to improve national park gateway community services and maximize their potential to support themselves, the parks and public welfare.
Recent studies on national park gateway communities have been increasing, yet limitations remain. First, current studies remain theoretical and lack empirical evidence on how gateway communities interact with and affect the public (Lin et al., 2024; Teng et al., 2025). Second, attention was often given to residents and other stakeholders, but rarely to the public (Li et al., 2024; Xie and Wang, 2024; Zhang and Fu, 2024). Mwongoso et al. (2023) investigated residents’ attitudes toward gateway community services and explored how these factors influence such services. Smith et al. (2024) emphasized the park staff and affiliated nonprofits, proposing pricing and operating strategies for better gateway communities. However, few studies have focused on the public preferences for specific gateway community services and how their preferences evolve. The public are the direct tourists and consumers of gateway communities, and it is crucial to understand their attitudes and motivations (Gao et al., 2020; Sivakami et al., 2023). Scholars have employed various methods such as the discrete choice experiment and structural equation modeling to investigate public preferences for ecosystem services in protected areas (Juutinen et al., 2011; Dwyer et al., 2019). The findings reveal several key psychological factors, including public awareness and identity of the local ecology and culture (Dwyer et al., 2019; Plieninger et al., 2015; Luong, 2025). These factors also significantly influence public willingness to revisit and their pro-environmental behaviors (Lee et al., 2015; Zhu et al., 2026). Nowadays, the public require not only to arrive at natural destinations but also to be enrich from them. Their expectations are evolving to authenticity and escapism, pursuing both mental and physical enrichment (Sthapit et al., 2024; Lin et al., 2024). These rising demands, however, are poorly met by the insufficient facilities and activities, as well as the limited ecological and cultural presentations in gateway communities (Teng et al., 2025; Zhang and Zhang, 2023; Liu, 2016). While existing studies have established a foundation for improving gateway community services, more differentiated strategies across fundamental, ecological and cultural dimensions still remain unexplored.
Therefore, this study first introduces the ABCDE (Activating events, beliefs, consequences, disputations and effects) psychological model to reveal that high-quality nature-based experiences enhance public environmental awareness and pro-environmental behaviors. To better improve these nature-based experiences in gateway communities, this study further employs a choice experiment. It is used to investigate specific public preferences for gateway community services across fundamental, ecological and cultural dimensions. These findings provide empirical evidence to understand and intervene in the psychological influencing mechanism among public nature-based experiences, awareness and behaviors. It also further identifies the hierarchical and heterogeneous public preferences for nature-based experiences in gateway communities. Accordingly, this study further proposes practical strategies, which contribute to both the improvements of gateway communities and the parks’ functions. Moreover, China’s national parks are characterized by vast areas, rich biodiversity and complex man–land relationship. This study also provides representative insights for balancing conservation, community development and public welfare in worldwide protected areas, in line with the sustainable development goals.
The following parts are structured as follows. Section 2 reviews the literature and presents the theoretical framework. Section 3 describes the methodology and experimental design. In Section 4, the empirical results of public preferences and heterogeneity for gateway community services are presented. Section 5 concludes the findings and offers suggestions.
2. Literature review and theoretical framework
2.1 National park gateway community services
Gateway community was first introduced by the US National Park Service in 1995. These neighboring communities benefit from national parks, and these valuable ecological and cultural resources are their main attractions (Steer and Nina Chambers,Social Science Program, 1998; Stoker et al., 2020; Zhang et al., 2024). Steer and Nina Chambers,Social Science Program (1998) and Stoker et al. (2020) defined national park gateway communities as entrance areas that tourists must pass through, with populations ranging from 150 to 25,000 and providing multidimensional tourist services.
Gateway community services have been classified in several ways. Wu and Wang (2022) regarded these services as ecosystem services, categorizing them into provisioning, regulating, supporting and cultural services. The 4E model of Gilmore and Pine (1998) was also applied, dividing these services into Entertainment, Escape, Estheticism and Education. Scholars further categorized gateway community services across fundamental, ecological and cultural dimensions (Pan and Zhang, 2023; Wu and Wang, 2022; Steer and Nina Chambers,Social Science Program, 1998). Fundamental services are the basis for providing necessary facilities and activities. Su and Yang (2018) described fundamental services as the combination of lodging, dining, transportation, shopping and sightseeing. Ecological services are the core attraction, presenting rich biodiversity and harmonious landscapes (Steer and Nina Chambers,Social Science Program, 1998). The public could gain relaxation and emotional connection through pristine and intact environment. Cultural services provide opportunities for the public to learn and experience the local history and customs (Wu and Wang, 2022). Public demands are increasing for distinctive and diverse services, especially in nature-based experiences (He et al., 2019; Juutinen et al., 2011).
2.2 Theoretical framework and hypotheses
2.2.1 ABCDE model of rational-emotive therapy
The ABCDE psychological model was developed by Albert Ellis to emphasize the connection among individuals’ experiences, awareness and behaviors (DiLorenzo et al., 2007). It discusses that Activating events (A) do not directly influence behavioral Consequences (C), but by shaping one’s awareness (Beliefs, B) about these events. That is, individuals’ decisions are jointly influenced by their previous experiences and corresponding awareness. And the model further introduces Disputations (D) to challenge and reshape existing irrational Beliefs, thus leading to new and more positive Consequences. This positive changing process of awareness and behaviors is called Effects (E). The ABCDE psychological model was first applied as a psychological therapy to identify and alleviate negative emotions (Saulius and Malinauskas, 2023; Syarafina et al., 2025). It has gradually been used to reveal and intervene in the psychological mechanisms of public decision-making and behavioral change (King et al., 2024). Some scholars have also introduced this model to explore how nature-based interventions shape public beliefs about the environment and promote pro-environmental behaviors (Fernández-Dávila, 2023).
This study innovatively applies the ABCDE model to national park gateway community services. Public pro-environmental behaviors are jointly influenced by their previous nature-based experiences and environmental awareness (He and Xu, 2023; Tu et al., 2017; Winterich et al., 2013; Xu and Tu, 2023). As shown in Figure 1, gateway community services function in two ways. First, gateway community services are activating events (1). They could shape public environmental awareness (2), thereby influencing their pro-environmental behaviors (3). Second, gateway community services could be disputations (4) to reshape and enhance public environmental awareness, thus promoting new and more positive pro-environmental behavioral changes (5). High-quality nature-based experiences can stimulate positive pro-environmental awareness and behaviors (Liu et al., 2025). Based on this, the following hypotheses are proposed:
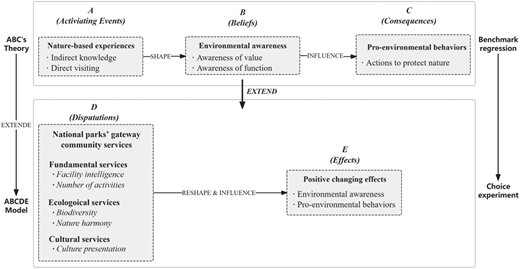
High-quality nature-based experiences will enhance public environmental awareness.
Enhancing public environmental awareness will promote their pro-environmental behaviors.
2.2.2 Random utility theory
The random utility theory posits that individuals will choose the option which maximizes their utility. As shown in Equation (1), the utility derives from the observable attributes of goods or services and the unobservable random component (Willis, 2014). These attributes can be quantitative or qualitative, presenting a bundle of features of the goods or services (Holmes et al., 2017). The choice experiment originates from the random utility theory and Lancaster’s consumption theory (Zhu et al., 2024; Han et al., 2020). It is used to explore individual preferences and choice behaviors for these attributes (Schuster et al., 2024). Individuals are asked to choose from unordered alternative combinations of key attributes, and their choices reveal the specific preferences and relative importance of each attribute. This method has been widely applied to environmental goods or services that comprise multiple attributes (Holmes et al., 2017). It assesses public preferences and willingness to pay (WTP) for different ecosystem services, as well as residents’ attitudes toward conservation and ecological compensation (Xu et al., 2020; Wang et al., 2024). The choice experiment has been proven to be a valid method for exploring individuals’ preferences for environmental goods or services.
This study then employs the choice experiment to identify public preferences for different attributes of gateway community services. It is used to explore how to better improve these attributes. And the improvements contribute to higher quality services. Gateway community services therefore could function better as activating events and disputations to promote pro-environmental awareness and behaviors. Studies have investigated several key attributes of gateway community services across fundamental, ecological and cultural dimensions. For fundamental services, a large number of scholars have cited the attributes of facility and recreational activity as two main factors (Dickinson and Robbins, 2007; Dunning, 2005; Wang and Zhuang, 2024; Akayezu et al., 2022). Facilities enhanced by intelligent technologies will effectively promote public convenience and efficiency while traveling (Lei et al., 2025). Meanwhile, more recreation rooted in local resources could significantly improve public satisfaction and utility (Liu et al., 2024). Ecological services are largely supported by the attributes of biodiversity and nature harmony (Juutinen et al., 2011). Zhong et al. (2016) and Xu et al. (2020) suggested that the public prefer mostly rich biodiversity, which enables them to achieve physical and mental recovery. Wu and Wang (2022) focused on the harmony between constructions and nature. Constructions that harmonize with the surrounding landscape could significantly improve esthetic and emotional connection (Hashemi Kashani and Pazhouhanfar, 2024; Pham et al., 2025). Moreover, for cultural services, He et al. (2019) highlighted the important attribute of cultural presentation. Xiao et al. (2024) found that the public prefer cultural experiences with deeper participation and longer duration. Instead of still display, more immersive and interactive cultural presentation could strengthen attachments to local history and customs (Li et al., 2025; Zhang and Zhang, 2024). Accordingly, the following hypotheses are proposed:
Improving fundamental, ecological and cultural services of national park community services will enhance public preferences and utility.
Improving facility intelligence and the number of activities in fundamental services will enhance public preferences and utility.
Improving biodiversity and nature harmony in ecological services will enhance public preferences and utility.
Improving culture presentation in cultural services will enhance public preferences and utility.
2.2.3 Bounded rationality theory
The theory of bounded rationality challenges the theory of perfect rationality, which assumes that individuals are rational and would choose the optimal solution to maximize utility (Deng and Zhang, 2004; Simon, 1955). This theory argues that in the complex real world, individuals are bounded rational and their decision-making is constrained by numerous factors such as knowledge and time. That is to say, individuals tend to choose the satisfying solution rather than the optimal solution (Deng and Zhang, 2004; Simon, 1955, 1989; Lu, 1996). This leads to heterogeneity in individuals’ decision-making, even when facing the same scenario (Simon, 1955). In this study, the public are bounded rational. Their different experiences and awareness lead to their heterogeneous preferences for national park gateway community services. Studies validated that the heterogeneity comes from not only demographic characteristics but also psychological and behavioral factors, such as traveling purpose and companion (Huang et al., 2002; Huang and Liu, 2016; Zhang and Liu, 2022; Su et al., 2007; Wu et al., 1997). The heterogeneous preferences of the public are mainly influenced by individual demographic, psychological and behavioral characteristics, especially in travel (Zhou and Lai, 2022). Thus, the following hypothesis is proposed:
Public preferences for national park gateway community services are heterogeneous.
3. Methodology and experimental design
3.1 Model specification
3.1.1 Influencing mechanism of nature-based experiences on environmental awareness and pro-environmental behaviors
This study employs the following two empirical models to analyze how nature-based experiences influence public environmental awareness and pro-environmental behaviors. Equation (2) represents the influencing mechanism of nature-based experiences on public environmental awareness, while Equation (3) further examines how public environmental awareness influences their pro-environmental behaviors.
where refers to individual i’s nature-based experiences, including indirect knowledge and direct visiting to natural areas. refers to individual i’s environmental awareness, including their awareness of the value and functions of nature. And represents individual i’s pro-environmental behaviors such as actions to protect nature. are control variables, such as individual i’s gender, age, years of education and average annual household income. and are random disturbance terms.
3.1.2 Choice experiment of public preferences for national park gateway community services
The choice experiment assumes that individuals will choose the option which could maximize their utility. The utility derives from the observable attributes and the unobservable random error term, namely
where is individual i’s total utility of option j in set t. is the utility of observable attributes and is the random error term. (Alternative specific constant) represents the baseline utility of choosing none of the improved options, refers to the utility of the kth attribute of option j in set t. reflects other control variables, including individual i’s personal characteristics and pro-environmental behaviors.
Based on the mixed logit model, the probability that individual i chooses option j in set t can be expressed as
The marginal utility that the public obtain from option j in set t can be calculated as their WTP (Zhang et al., 2021). The function is as follows:
where refers to the monetary value that individuals are willing to pay for the level improvement of each key attribute. and are the coefficients of attribute k and the price attribute, respectively.
To further explore the heterogeneity of individual i’s preferences, this study refers to the method of previous studies (Han et al., 2020) and introduces interaction terms between key attributes and individual characteristics:
where is the standard deviation of the kth attribute when individual i chooses option j in set t. And its significance indicates the heterogeneity in public preferences for this attribute. Furthermore, is the interaction term between key attributes and individual i’s demographic characteristics. and are the interaction terms between key attributes and individual i’s psychological and behavioral traveling characteristics, such as traveling purpose and companion. , and are coefficients to be estimated, and their significance can explain the heterogeneous preferences for the kth attribute under different individual characteristics.
A latent class model is also used to identify individual groups with distinct preferences. Akaike information criterion (AIC) and Bayesian information criterion (BIC) are two common statistical criteria to determine the optimal number of classes, and the proportion of each class should not be too large nor too small (Han and Sun, 2024). As shown above, the probability that individual i of class c chooses option j in set t can be expressed as:
3.2 Choice experiment design
3.2.1 Pretesting design
Based on previous studies and the policy mentioned in “Guidelines for Construction of Gateway Community of National Park”, this study initially identified several alternative attributes across fundamental, ecological and cultural dimensions. Then, a group discussion was held with experts and individuals who had visited national park gateway communities to refine the primary version of attributes and the corresponding levels.
To develop and validate the choice experiment, this study further conducted two rounds of pretesting. The first round of pretesting examined the validity of the primary attributes and levels, assessing their relevance to respondents’ real decision-making. Based on the results, the attributes and levels were optimized and used to design the choice sets. The preliminary questionnaire was developed accordingly. The second round of pretesting then involved 100 respondents to test the experimental design and the questionnaire, leading to further improvements in clarity and readability. After the theoretical design and two rounds of pretesting, six key attributes and their levels were finalized. The final experimental design and the formal questionnaire were determined.
3.2.2 Key attributes description
The six key attributes and their levels were finalized across fundamental, ecological and cultural dimensions, as shown in Table 1.
The design of attributes and levels of national park gateway community services
| Dimension | Attribute | Level | Description |
|---|---|---|---|
| Fundamental | Facility intelligence | 0 = Basic | The application degree of intelligent technologies in facilities |
| 1 = +10% | |||
| 2 = +20% | |||
| Number of activities | 0 = 0 | The number of recreational activities | |
| 1 = 1–3 | |||
| 2 = 4–6 | |||
| Ecological | Biodiversity | 0 = Basic | The richness degree of species |
| 1 = +10% | |||
| 2 = +20% | |||
| Nature harmony | 0 = Standard design | Construction styles without/with natural materials and appearances | |
| 1 = Nature-integrated design | |||
| Cultural | Culture presentation | 0 = Still display | Elementary display (e.g. cultural walls) |
| 1 = Immersive interaction | Interactive experiences (e.g. folk shows) | ||
| Willingness to pay | Price | 0 = CNY100 | The price that tourists are willing to pay for these services |
| 1 = CNY150 | |||
| 2 = CNY200 | |||
| 3 = CNY250 | |||
| 4 = CNY300 |
The attributes and their levels are explained below.
For fundamental services:
(1) The attribute of “facility intelligence” refers to the application degree of smart systems in gateway community facilities. Gateway communities now are poorly equipped with facilities like manual parking lots, tourist centers and static signage. And these facilities should be enhanced by intelligent technologies, improving travel convenience and efficiency. This attribute is categorized into three levels: basic (the status quo), +10% and +20%. The basic level refers to facilities without intelligent technologies. The other two levels correspond to 10% and 20% upgrades in the application of intelligent technologies, such as smart parking lots, AI-powered tourist centers and real-time crowd monitoring systems.
(2) The attribute of “number of activities” refers to the number of recreational activities in gateway communities. The resources of national park gateway communities are comprehensive and precious, while they are now suffering from insufficient and homogeneous recreational activities. More diverse activities could enhance public enrichment. Based on the pretesting and previous studies, this attribute is categorized into three levels: 0, 1–3 and 4–6.
For ecological services:
(3) The attribute of “biodiversity” refers to the richness degree of species in gateway communities, such as plants, animals and water bodies. The higher ratio of biodiversity could better promote public ecological benefit and appreciation for nature (Liu et al., 2024). This attribute is categorized into three levels: basic (the status quo), +10% and +20%.
(4) The attribute of “nature harmony” refers to the coherence between constructions and the surrounding environment in gateway communities. While cement constructions with standard design are commonly found in most destinations, the signage, trails and buildings made from local materials such as wood, bamboo and stones could enhance public esthetic and emotional connection to nature. They are better integrated with the local landscape. This attribute is categorized into two levels: standard design and nature-integrated design.
For cultural services:
(5) The attribute of “culture presentation” refers to the way to present local culture and customs in gateway communities. Instead of elementary display, more participatory and immersive cultural experiences enhance public identity and attachment to local culture. This attribute is categorized into two levels: still display and immersive interaction.
(6) And the attribute of “price” refers to how much public are willing to pay for these services, which is categorized into five levels: CNY100, CNY150, CNY200, CNY250 and CNY300.
3.2.3 Choice set design
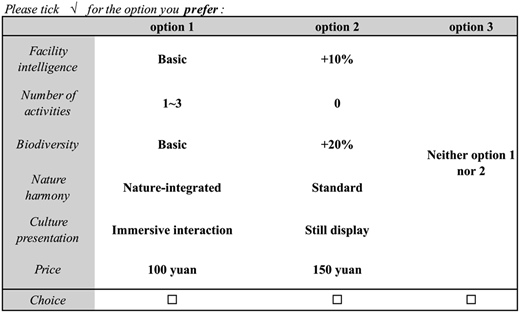
With the above attributes and levels, there are a total of 3 × 3 × 3 × 2 × 2 × 5 = 540 combinations. To ensure the quality of data collection, this study used an orthogonal design to screen out 32 combinations, constituting 16 choice sets. Since it would be too heavy for respondents to make 16 consecutive choices, this study randomly divided the 16 choice sets into 2 questionnaires. Each questionnaire contains 8 choice sets, and an opt-out option is added to each choice set, labeled “Neither option 1 nor 2”. Figure 2 shows an example of a choice set.
3.2.4 Questionnaire design and sample size
The questionnaire consists of three parts. The first part asks about respondents’ individual characteristics, such as gender, age, leisure days, travel purpose and travel companion. The second part collects respondents’ nature-based experiences, their environmental awareness and pro-environmental behaviors. The third part is the choice experiment, providing 8 choice sets for respondents to choose from. An online survey was conducted across 27 provinces in China. A total of 669 responses were received and 623 valid questionnaires were kept for analysis. The number of completed questionnaires was comparable for each version.
4. Result analyses
4.1 Analysis of nature-based experiences and environmental awareness and pro-environmental behaviors
4.1.1 Descriptive statistics
As shown in Table 2, around 54.90% of respondents were female. Most respondents were aged 19–25 and 26–35, with an average of 16.42 years of education. This indicates their ability to understand the questionnaire well. And respondents’ average annual household income was 119,140 yuan.
Description of individual characteristics
| Variable | Description | N | Mean | SD | Min | Max |
|---|---|---|---|---|---|---|
| Demographic characteristics | ||||||
| Gender | 0 = Female; 1 = male | 623 | 0.451 | 0.498 | 0 | 1 |
| Age | 1 = ≤18; 2 = 19–25; 3 = 26–35; 4 = 36–45; 5 = ≥45 | 623 | 2.674 | 0.879 | 1 | 5 |
| Education | (Years) | 623 | 16.422 | 1.772 | 9 | 23 |
| Income | (Average annual household) CNY 10,000 | 623 | 11.914 | 5.249 | 10 | 25 |
| Nature-based experiences | ||||||
| Frequency of hearing | The frequency that hear about or visit nature: 1 = never; 2 = rarely | 623 | 2.963 | 0.886 | 1 | 5 |
| Frequency of visiting | 3 = sometimes; 4 = often; 5 = very often | 623 | 2.817 | 0.931 | 1 | 5 |
| Environmental awareness | ||||||
| Ecological value | 1 = strongly disagree; 2 = disagree | 623 | 3.870 | 0.969 | 1 | 5 |
| Cultural value | 3 = neutral; 4 = agree; 5 = strongly agree | 623 | 3.670 | 0.881 | 1 | 5 |
| Lodging and dining | 0 = No; 1 = yes | 623 | 0.799 | 0.401 | 0 | 1 |
| Recreation | 623 | 0.724 | 0.447 | 0 | 1 | |
| Transportation | 623 | 0.701 | 0.458 | 0 | 1 | |
| Science and education | 623 | 0.353 | 0.478 | 0 | 1 | |
| Culture promotion | 623 | 0.331 | 0.471 | 0 | 1 | |
| Pro-environmental behaviors | ||||||
| Actions to protect nature | 0 = No; 1 = yes | 623 | 0.958 | 0.200 | 0 | 1 |
Respondents showed a considerable foundation of nature-based experiences, with the mean coefficients of 2.963 for indirect knowledge and 2.817 for direct visiting to natural areas. And their environmental awareness was sound, as indicated by the mean coefficients of 3.870 for ecological value and 3.670 for cultural value. They were relatively familiar with the fundamental functions of natural areas, such as lodging and dining (coefficients of 0.799), recreation (coefficients of 0.724) and transportation (coefficients of 0.701). But they were less familiar with scientific and educational function (coefficients of 0.353) and cultural function (coefficients of 0.331). This reflects the weak performance of comprehensive functions in natural areas. Moreover, over 95.8% of respondents were willing to participate in pro-environmental activities.
4.1.2 Benchmark regression analysis
As shown in model 1 of Table 3, indirect knowledge and direct visiting to natural areas both have significant positive influence on public environmental awareness, with the coefficients of 0.198 and 0.293, respectively. This indicates that richer nature-based experiences enhance public environmental awareness, and direct visiting has stronger impact than indirect knowledge. Model 2 further validates that public environmental awareness significantly promotes their pro-environmental behaviors, as indicated by the positive coefficient of 0.041 at the 1% significant level. The public with stronger environmental awareness are more willing to protect nature. These results indicate that high-quality nature-based experiences will shape public environmental awareness, thus fostering their pro-environmental behaviors. Hypotheses 1 and 2 are thus supported.
Benchmark regression results of nature-based experiences and environmental awareness and pro-environmental behaviors
| (1) Environmental awareness | (2) Pro-environmental behaviors | |
|---|---|---|
| Environmental awareness | 0.041*** (3.51) | |
| Nature-based experiences | ||
| Frequency of hearing | 0.198*** (5.88) | 0.016 (1.58) |
| Frequency of visiting | 0.293*** (9.04) | 0.019 (1.91) |
| Demographic characteristics | ||
| Gender | 0.198** (3.22) | −0.012 (−0.65) |
| Age | −0.083** (−2.41) | 0.004 (0.40) |
| Education | 0.012 (0.82) | −0.005 (−1.12) |
| Income | 0.006 (1.01) | 0.004* (2.23) |
| _Cons | 1.928*** (6.67) | 0.747*** (8.63) |
| N | 623 | 623 |
Note(s): Standard errors were shown in parentheses. ***p < 0.01, **p < 0.05 and *p < 0.1
4.2 Analysis of public preferences for national park gateway community services
4.2.1 Choice experiment analysis
As one of the most valuable nature-based experiences, gateway community services could effectively meet public needs, enhancing their pro-environmental awareness and behaviors. To better improve these services, this study employed a conditional logit model and a mixed logit model to explore public preferences for their six key attributes. As shown in Table 4, there are a total of 14,952 (3 × 8 × 623) observations. All other variables are controlled. The constant term of ASC and price are set as fixed variables, while all other key attributes are set as random variables. The coefficients of ASC in models 4 and 5 are both significantly negative. It indicates that the public would rather choose the improved schemes of gateway community services than the opt-out option. The improved schemes proposed by this study proved effective in stimulating public interest. The coefficients of price are also significantly negative. It indicates the negative public attitudes toward higher price, which is consistent with common sense. Model 4 is more robust than model 3, thus serving as the basis for subsequent analyses.
The conditional logit model and mixed logit model results of public preferences
| Variable | (3) CLM | (4) MLM | |||
|---|---|---|---|---|---|
| Mean | Mean | SD | WTP (CNY) | 95% CI | |
| Fixed variable | |||||
| ASC | −1.716*** | −1.891*** | |||
| (−8.96) | (−11.61) | ||||
| Price | −0.070*** | −0.089*** | |||
| (−4.95) | (−6.60) | ||||
| Random variable | |||||
| Biodiversity | 0.429*** | 0.513*** | 0.455*** | 5.798 | 4.381–8.304 |
| (16.47) | (15.47) | (11.94) | |||
| Nature harmony | 0.401*** | 0.474*** | 0.362*** | 5.352 | 3.877–7.911 |
| (12.01) | (11.99) | (5.04) | |||
| Culture presentation | 0.331*** | 0.371*** | 0.442*** | 4.191 | 3.056–6.071 |
| (9.78) | (9.51) | (6.83) | |||
| Facility intelligence | 0.170*** | 0.199*** | −0.125 | 2.247 | 1.612–3.265 |
| (7.99) | (7.79) | (−1.75) | |||
| Number of activities | 0.132*** | 0.156*** | 0.102 | 1.763 | 1.139–2.678 |
| (6.29) | (6.28) | (1.14) | |||
| Other variables | Controlled | Controlled | |||
| Likelihood | −3420.101 | −3372.237 | |||
| Prob > χ2 | 0.000 | 0.000 | |||
| N | 14,952 | 14,952 | |||
Note(s): Standard errors were shown in parentheses. ***p < 0.01, **p < 0.05 and *p < 0.1
In model 4, the mean coefficients of all key attributes are positive at the 1% significant level. It indicates that the public prefer the improvements of all attributes. The standard deviations of “biodiversity”, “nature harmony” and “culture presentation” are significant at the 1% level, further suggesting their preferences are heterogeneous for ecological and cultural attributes. Moreover, the WTP values of all attributes are positive. It indicates that the public are willing to pay for gateway community services. Hypotheses 3 and 4 are thus supported, specifically as follows:
Ecological services are the most valued. The mean coefficient of “biodiversity” is the highest at 0.513, indicating that the public prefer higher level of biodiversity with more flora, fauna and water. They could gain the highest marginal utility from biodiversity and are willing to pay 5.798 yuan for this attribute. The mean coefficient of “nature harmony” is also high at 0.474. The public prefer nature-integrated design with local materials and appearances. They are willing to pay 5.352 yuan for this attribute.
Cultural services are secondly concerned. The mean coefficient of “culture presentation” is 0.371. It reflects that the public prefer more immersive and interactive cultural experiences. Rather than museums and cultural walls, they are willing to pay 4.191 yuan for immersive interaction, such as folk performances and festival events.
Third, fundamental services are less favored. The mean coefficients of “facility intelligence” and “number of activities” are 0.199 and 0.156, respectively. It indicates public preferences for well-equipped facilities and more diverse activities. Their WTP for these two attributes is positive but relatively low at 2.247 and 1.763 yuan, respectively. This is because as basic needs, the marginal utility of their improvements is limited. And the value of diverse activities in gateway communities may be underestimated, as the public lack sufficient awareness of comprehensive functions of natural areas.
4.2.2 Heterogeneity analysis
According to the above findings, public preferences for ecological and cultural services are heterogeneous. This study then introduced the interaction terms between these attributes and individual characteristics. The interaction terms between individual demographic characteristics and these attributes are all insignificant, indicating the general preferences for high-quality ecological and cultural gateway community services.
To better trace the heterogeneity of preferences, this study then introduced individual psychological and behavioral traveling characteristics. As shown in Table 5, most respondents spent around 31–90 days for leisure annually. Around 70.6% of respondents preferred lodging in gateway communities, while 16.5% chose to stay within national parks. It shows a reliable tourism foundation of national park gateway communities. Moreover, the travel purpose of relaxation (95.8%), entertainment (77.7%) and learning (64.7%) were much more chosen than trend chasing (32.7%). This indicates public preferences for meaningful experiences instead of symbolic sightseeing. And the main travel companions were friends (57.9%) and partners (56.7%), indicating a social gathering trend in current travel.
Description of individual psychological and behavioral traveling characteristics
| Variable | Description | N | Mean | SD | Min | Max |
|---|---|---|---|---|---|---|
| Leisure days | 1 = ≤30; 2 = 31–60; 3 = 61–90; 4 = ≥90 | 623 | 2.563 | 0.773 | 1 | 4 |
| Accommodation | Gateway communities | 623 | 0.706 | 0.456 | 0 | 1 |
| National parks | 623 | 0.165 | 0.372 | 0 | 1 | |
| Farther towns | 623 | 0.109 | 0.312 | 0 | 1 | |
| Day trip | 623 | 0.019 | 0.138 | 0 | 1 | |
| Travel purpose (multiple-response) | Relaxation | 623 | 0.958 | 0.200 | 0 | 1 |
| Entertainment | 623 | 0.778 | 0.416 | 0 | 1 | |
| Learning | 623 | 0.648 | 0.478 | 0 | 1 | |
| Trend chasing | 623 | 0.327 | 0.470 | 0 | 1 | |
| Travel companion (multiple-response) | Friends | 623 | 0.579 | 0.494 | 0 | 1 |
| Partner/spouse | 623 | 0.567 | 0.496 | 0 | 1 | |
| Elders | 623 | 0.380 | 0.486 | 0 | 1 | |
| Offspring | 623 | 0.222 | 0.416 | 0 | 1 | |
| Alone | 623 | 0.161 | 0.367 | 0 | 1 |
The results of heterogeneity analyses are as follows. Table 6 summarizes all significant interaction terms of ecological attributes. People who seek relaxation and social gathering prefer harmonious ecological services. In model 5, the interaction term between “nature harmony” and “relaxation” is positively significant at the 5% level with the coefficient of 0.472. It reflects that the public who travel for relaxation prefer nature-integrated design which harmonizes with the surrounding landscape. Nature-integrated signage, trails and buildings could reduce visual disturbance and alleviate urban stress. In model 6, the interaction term between “nature harmony” and “friends” is also positively significant at the 5% level with the coefficient of 0.220. It indicates that those who travel with friends also prefer nature-integrated design which helps them to get closer to each other.
Interaction analysis of ecological attributes under psychological and behavioral traveling characteristics
| Variable | (5) MLM | (6) MLM |
|---|---|---|
| Biodiversity × Relaxation | 0.040 (0.31) | |
| Nature harmony × Relaxation | 0.472** (2.75) | |
| Biodiversity × Friends | 0.085 (1.26) | |
| Nature harmony × Friends | 0.220** (2.62) | |
| Attributes variables | Controlled | Controlled |
| Other variables | Controlled | Controlled |
| Likelihood | −3354.964 | −3356.969 |
| Prob > χ2 | 0.000 | 0.000 |
| N | 14,952 | 14,952 |
Note(s): Standard errors were shown in parentheses. ***p < 0.01, **p < 0.05 and *p < 0.1
Table 7 summarizes all significant interaction terms for cultural attributes. People who seek deeper participation and family connection prefer immersive and interactive cultural experiences. In models 7 and 8, the interaction terms between “cultural presentation” and “leisure days” (coefficient of 0.137) and “gateway communities” (coefficient of 0.198) are both positive at the 10 and 5% significant levels, respectively. It indicates that those who have more time and lodge in gateway communities prefer immersive cultural services. Their temporal and spatial convenience enables them to slow down and deeply connect with local culture. In model 9 and model 10, the interaction terms between “cultural presentation” and “entertainment” (coefficient of 0.191) and “elders” (coefficient of 0.203) are also positive at the 10% significant level. It indicates that the public who travel for entertainment or with elders also prefer immersive cultural services. More immersive cultural interactions may provide them a sense of participation and family connection.
Interaction analysis of cultural attributes under psychological and traveling behavioral characteristics
| Variable | (7) MLM | (8) MLM | (9) MLM | (10) MLM |
|---|---|---|---|---|
| Interaction terms | ||||
| Culture presentation × Leisure days | 0.137** (2.79) | |||
| Culture presentation × Gateway communities | 0.198* (2.48) | |||
| Culture presentation × Entertainment | 0.191* (2.14) | |||
| Culture presentation × Elders | 0.203* (2.39) | |||
| Attributes variables | Controlled | Controlled | Controlled | Controlled |
| Other variables | Controlled | Controlled | Controlled | Controlled |
| Likelihood | −3365.910 | −3367.685 | −3354.964 | −3356.969 |
| Prob > χ2 | 0.000 | 0.000 | 0.000 | 0.000 |
| N | 14,952 | 14,952 | 14,952 | 14,952 |
Note(s): Standard errors were shown in parentheses. ***p < 0.01, **p < 0.05 and *p < 0.1
4.2.3 Latent class analysis
This study also employed a latent class model to further identify different groups through public heterogeneous preferences. Models with 2–5 classes were all estimated, and the optimal number of classes was determined to be 3, with the lowest BIC value of 6899.743 and AIC value of 6686.59. As seen in Table 8, the proportion of each class is 38.2%, 36.7% and 25.1%, respectively.
Results of latent class model with 3 classes
| Category | Class 1 | Class 2 | Class 3 |
|---|---|---|---|
| Attribute | Experience-focused | Environment-focused | Price-focused |
| Price | −0.179*** (−3.74) | 0.164** (3.18) | −0.387*** (−5.84) |
| Biodiversity | 1.049*** (6.72) | 0.250*** (3.56) | 0.120 (1.59) |
| Nature harmony | 0.423*** (4.14) | 0.634*** (5.37) | 0.245* (2.19) |
| Culture presentation | 0.842*** (5.09) | 0.049 (0.54) | 0.311** (2.71) |
| Facility intelligence | 0.310*** (4.11) | 0.149** (3.07) | 0.183* (2.46) |
| Number of activities | 0.273*** (3.67) | 0.132** (2.59) | 0.070 (1.02) |
| Class share | 38.2% | 36.7% | 25.1% |
Note(s): Standard errors were shown in parentheses. ***p < 0.01, **p < 0.05 and *p < 0.1
The experience-focused group is the largest group with significant preferences for all key attributes at 1% level. And the mean coefficients of “biodiversity”, “culture presentation” and “nature harmony” are particularly positive at 1.049, 0.842 and 0.423, respectively. It reflects this group’s preferences for comprehensive gateway community services, especially for high-quality ecological and cultural services.
The environment-focused group, uniquely, shows a positive attitude toward “price” with the coefficient at 0.164. This can be explained by the Veblen effect that higher prices signify higher quality. The coefficients of “nature harmony” and “biodiversity” are particularly positive at 0.634 and 0.250, respectively, indicating this group’s distinct preferences for high-quality ecological services, such as rich biodiversity and nature-integrated design. And the coefficients of “facility intelligence” and “number of activities” are relatively low but significantly positive at 0.149 and 0.132, respectively. It reflects the corresponding concern about fundamental services. They prefer high-quality ecological services based on adequate intelligent facilities and diverse activities.
The price-focused group is relatively small and is highly sensitive to “price” with the coefficient of −0.387 at the 1% significant level. They emphasize functional and visible experiences, especially for immersive cultural presentation (coefficient of 0.331), followed by nature-integrated design (coefficient of 0.245) and intelligent facilities (coefficient of 0.183).
5. Conclusions and suggestions
5.1 Conclusions
All hypotheses mentioned in Section 2 have been proven to be valid. Based on the ABCDE psychological model, this study first revealed: (1) High-quality nature-based experiences enhance public environmental awareness and pro-environmental behaviors. And direct visiting to nature areas has stronger impact than indirect knowledge. Then to better improve nature-based experiences in gateway communities, a choice experiment was conducted. It was used to further explore the public preferences for specific services in gateway communities. The findings show that (2) public preferences are hierarchical for gateway community services. They especially prefer ecological services, followed by cultural services and finally fundamental services. (3) And public preferences are heterogeneous for ecological and cultural services. Those who travel for relaxation and with friends show stronger preferences for ecological services, such as rich biodiversity and nature-integrated design. While those with more leisure time accommodated in gateway communities, travel for entertainment and with elders prefer cultural services with immersive interactions. (4)Moreover, three groups with distinct preferences were identified. The experience-focused group is the largest and shows significant preferences for all services. The environment-focused group, interestingly, shows a positive attitude toward price, especially for ecological services. And the price-focused group is relatively small and emphasizes functional and visible experiences.
These findings offer empirical evidence for relevant academic studies of ecosystem services on public preferences and valuation. They also provide new insights for the sustainable development in protected areas worldwide. With higher-quality services, gateway communities could better promote their own development and the parks’ comprehensive functions. More importantly, these valuable services effectively enhance public pro-environmental awareness and behaviors. It is therefore essential to improve the quality of gateway community services across fundamental, ecological and cultural dimensions.
5.2 Suggestions
Based on the empirical evidence of the ABCDE model, indirect knowledge and direct visiting to natural areas both enhance public environmental awareness and behaviors. It is necessary to improve both the publicity and quality of gateway community services.
First, more publicity should be strengthened to enhance public awareness and interest in gateway communities. Gateway communities should provide more advertisements about their comprehensive services across fundamental, ecological and cultural dimensions. It enables national park gateway communities to quickly spread their value and functions beyond geographical constraints, while attracting the public to experience these valuable services directly.
Second, a differentiated improving strategy of these services should be proposed for public hierarchical and heterogeneous preferences.
(1) Prioritizing ecological services as core attractiveness: For biodiversity, more plants, animals and water bodies should be introduced based on the local ecosystems. And measures such as wildlife corridors and shallow wetlands should be adopted to improve the species richness. For nature harmony, construction should adopt more nature-integrated designs in both materials and appearance. To keep the harmony of the surrounding landscape, signage, trails and buildings made of wood, bamboo and stone are also recommended. Additionally, for those who especially travel for relaxation and with friends, more social gathering spaces should be included, such as cafes and reading rooms nestled in forests or by waterways.
(2) Innovating cultural services as the competitiveness: For culture presentation, more immersive interactions are recommended rather than still displays. Gateway communities should provide more experiences that allow the public to actively participate in local culture and customs, such as folk shows and seasonal festivals. Additionally, for those with more time, travel for entertainment and with elders, more slow-paced cultural experiences such as intangible cultural heritage workshops and local food sessions should also be developed to strengthen cultural identity and family connection.
(3) Developing fundamental services as the basis: Adequate fundamental services are the basis for ecological and cultural services. For facility intelligence, more intelligent technologies should be applied to facilities in gateway communities, such as digital parking lots, online reservation systems and AI-powered tourist centers. These upgrades could better meet public demand for modern and effective nature-based experiences. And for the number of activities, more diverse recreational activities tailored to local resources should be developed, such as wildlife observation, forest bathing and guided nature hikes.
Third, communities with distinct functions should be developed for groups with different preferences. Three types of national park gateway communities are recommended based on specific locations and resources. For the largest experience-focused group, (1) experience-oriented gateway communities should be developed in larger number and scale. They should provide comprehensive services across three dimensions, aiming to fulfill the multiple demands for complete and immersive experiences. For the environment-focused group, (2) environment-oriented gateway communities should be developed in quiet areas with valuable ecosystems. They should mainly provide high-quality ecological services with richer biodiversity and harmonious landscapes for relaxation and mental well-being. And for the price-focused group, (3) convenience-oriented gateway communities should be developed at transportation hubs with lower costs to meet basic needs. More functional and visible experiences should be highly enhanced, such as well-equipped facilities and cultural interactions. These clustered gateway communities effectively realize their potential to promote their own development, the parks’ functions and public welfare.
