


This study aims to create actionable guidelines for pricing decision-making by employing game a theory matrix to forecast the correlation between the average daily rate and the latest ambiance of hotels.
Utilizing a vector error correction model, the research employs game theory to assess the influence of the average daily rate on the hotel's newest atmosphere during both peak season (April–September) and valley season (October–March).
Findings indicate that during the peak season, when the average daily rate rises in resorts and falls in suburban areas, the hotel’s newest atmosphere is at its best in both types of accommodations. During the off-peak season, the hotel’s newest atmosphere is achieved when both resorts and suburban accommodations increase their average daily rates.
There are two study constraints. One is the assumption that hotel guests in both parties prefer not to change hotels, but in fact they would. Two is a limited sample of two resort and suburban markets.
This suggests that the hotel’s newest atmosphere can draw both leisure and business travelers to suburban areas during the low season and more leisure travelers to resorts during the high season.
The study’s findings have implications for revenue related to the hotel’s newest atmosphere and cleanliness for both suburban and resort hotels, particularly when promoting tourism collaboratively.
The study provides valuable insights for hotel managers in analyzing pricing strategies using matrices.
Introduction
Inadequate comprehension of game theory poses significant challenges for pricing strategies in the hotel industry, particularly in shaping the newest atmosphere within hotels. Game theory operates as a contingency plan, where one player's strategy depends on the response of their competitive counterpart, influencing payoffs for both. Hotel managers, utilizing room occupancy and revenue, compare data with competitor reports to decide on optimal room rates for maximizing revenue. However, uncertainty arises after the competitor's response, creating variations in profits due to a disconnect from game theory.
Hotel cleanliness, a key attribute in hotel services, is crucial for guests, who gauge it through the hotel's average daily rate (ADR). Previous research indicates that ADR has both positive and negative effects on hotel cleanliness, yet the duration of this relationship remains inconclusive. Hotel managers, rather than overwhelming information, prefer decision clues, but limited research explores techniques for constructing such clues as a practical operation.
The research introduces two matrices utilizing indices, applying game theory strategies to predict the connection between ADR and the hotel's latest ambiance categorized by cleanliness. The Smith Travel Accommodations (STAR) report evaluates market share performance, while game theory strategies concentrate on best responses, dominant strategies and Nash equilibrium. Despite their shared objective of assisting informed decisions in competitive settings, STAR and game strategies do not align, creating a disparity between them.
Camarer and Johnson (1991) explain why experts, despite possessing substantial knowledge, often make inaccurate predictions, attributing this to the actuarial model. This model, coupled with a few clues, enhances decision accuracy. In the absence of clues, experts seek additional and costly information, relying on intuition.
The study's central question explores the condensation of key performance indices into matrices as cues, enabling hotels to forecast trends using game theory concepts. Matrices, constructed based on a sample of two hotels serving leisure and business travelers, represent Player 1 (resort hotels) and Player 2 (suburban hotels). The assumptions involve the presence of customer preferences favoring Player 1's hotels over Player 2's, with each player's matrix reflecting percentage changes in ADR. The main goal is to construct matrices for both players utilizing time series data derived from key performance indicators. These matrices, employing game theory strategies, seek to anticipate competitive dynamics throughout the high and low seasons of the hotel life cycle, offering valuable insights for decision-making to hotel managers.
Literature
Hotel key performance index (KPI)–average daily rate (ADR)
The hotel key performance index (KPI) serves as a monthly measure of the fluctuation in prices paid by hotel guests in a given country. It encompasses various weighted averages of hotel services, representing the overall spending of hotel guests. The KPI includes supply, demand, revenue, ADR, revenue per available room and occupancy.
The ADR stands as a pivotal metric for assessing a hotel's effectiveness in room sales, determined by dividing the total room revenue for a year by the number of room nights sold. ADR growth, denoted as the percentage change in ADR, serves as a crucial indicator of the harmony between hoteliers and guest satisfaction. This is particularly evident in criteria such as value, sleep quality, service, rooms, location and cleanliness for the hotel’s newest ambience as evaluated by guests.
In the context of game theory, the ADR percent change becomes a vital tool for decision-making. The matrix consists of four quadrants, each signifying different outcomes based on the choices made by two players regarding increasing or decreasing ADR.
Previous research highlights the impact of ADR on customer satisfaction, with price playing a significant role in shaping perceptions of quality. There is ongoing debate about how price influences these perceptions, but studies suggest that guests with higher service expectations stay at lodgings when paying more for accommodations. Additionally, room cleanliness, maintenance and staff attentiveness are directly influenced by ADR. The study employs a game theory matrix comparing resort and suburban hotels to uncover the key factors behind changes in ADR and cleanliness standards.
In summary, the text emphasizes the importance of the hotel KPI, ADR and ADR percent change in the hotel industry, linking them to guest satisfaction and decision-making through game theory. The research explores the nuanced relationship between ADR and cleanliness standards, shedding light on factors influencing these dynamics in resort and suburban hotels in Figure 1 (line 40, p. 5).
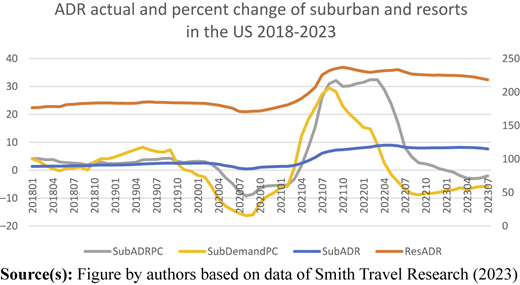
The average daily rate and percent change of suburban and resort in the US 2018–2023
The average daily rate and percent change of suburban and resort in the US 2018–2023
TripAdvisor hotel criteria – cleanliness to measure hotel’s newest atmosphere
TripAdvisor lists six hotel criteria: value, sleep quality, service, rooms, location and cleanliness. Hotel newest ambience by cleanliness, a crucial aspect of the hotel atmosphere, is a primary criterion for guest feedback. Studies by Lockyer (2003) and Lewis and McCann (2004) emphasize the direct link between cleanliness and the ADR, influencing guests' accommodation choices. The hospitality industry's core competency, highlighted by Espino-Rodríguez and Ramírez-Fierro (2017), attributes competitive advantage to the hotel atmosphere, particularly room cleanliness. Hsieh and Chuang (2020) underscore cleanliness and environmental quality as key factors shaping the overall hotel service experience. Zemke, Neal, Shoemaker, and Kirsch (2015) consider cleanliness a crucial amenity and strength for hotels.
Notably, housekeeping personnel constitute a significant portion of the hotel workforce, as indicated by Krause, Scherzer, and Rugulies (2005), and cleaning-related occupations contribute substantially to employment in France (Abasabanye, Bailly, & Devetter, 2018). Studies by Aguilar-Escobar, Garrido-Vega, Majado-Márquez, and Camuñez-Ruiz (2021), Dalci, Tanis, and Kosan (2010) and Jones and Siag (2009) delve into hotel room cleaning processes, cleaning profitability analysis and factors influencing cleaning productivity in hotels, respectively.
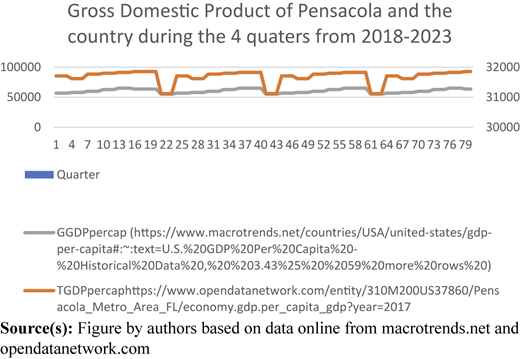
The research formulates the demand for the six criteria by considering two primary factors: ADR and guests' income, assessed through gross domestic product per capita (GDP per capita). GDP per capita represents the total value added by resident producers and taxes minus subsidies, divided by the mid-year population. The growth rate of income is quantified using the percentage change in GDP per capita. The objective of the study is to comprehend the connection between these factors and the demand for hotel criteria in Pensacola, with a particular emphasis on the growth of citizen income and comparisons to the US citizen index in Figure 2. (Line 42, p. 6).
Game theory
Von Neumann and Morgenstern (1944, 1947 and 1953) laid the foundational principles of game theory with the aim of offering insights into decision-making and strategic responses for maximizing gains in uncertain situations. Game theory revolves around three fundamental concepts: best response, dominant strategy and Nash equilibrium. The best response entails a strategy that secures a player a greater payoff than the strategy chosen by their opponent. A dominant strategy ensures a player a superior payoff regardless of the opponent's choices, while Nash equilibrium signifies a scenario where mutual best responses coexist, indicating optimal strategies for both players.
Game theory employs mathematical models to explore scenarios optimizing variables associated with benefits. Integrating decision theory, general equilibrium theory and mechanism design theory, game theory, as delineated by Levine (2016), delves into decision-making intricacies, buyer–seller interactions based on prices and compensation mechanisms, respectively. Tversky and Kahneman (1992) expanded decision theory with prospect theory, considering risk, happiness and wealth.
Significant contributors like John Keynes (1936–2008) and Hurwicz and Reiter (2006) made substantial contributions to general equilibrium theory and mechanism design theory, respectively. Nobel Prize Winners in Game Theory (2014) highlighted game theory's diverse applications in economics, political science, psychology, logic and biology.
Despite its importance, game theory remains underdeveloped in tourism. Feeny, Hanna, and McEvoy (1996) argue for a comprehensive framework addressing issues, such as overexploitation and conflicts between stakeholders. Vail and Hultkrantz (2000) express reservations about cooperative games in mitigating conflicts. Nevertheless, game theory holds potential for insights and solutions in resolving these conflicts.
Williams (2001) emphasizes challenges in establishing a stable ecosystem in tourism due to cultural differences. He suggests adopting a Western cultural approach within a game theory framework, emphasizing the shift from agricultural production to facilitating public access to the countryside.
Challenges related to time series data in tourism and the application of game theory in decision-making for hotel managers are addressed by Camarer and Johnson (1991). They utilize matrices to assist decision-making processes in suburban and resort hotels, with a focus on ADR decisions.
The study develops a game theory model for two players (suburban and resort) in the tourism sector, aiming to overcome challenges by revising ADRs and providing key clues in matrix tables. The study tests hypotheses on the correlation between hotel atmosphere and ADR fluctuations during the year and in high and low seasons. Results confirm significant changes in hotel atmosphere levels based on ADR fluctuations, supporting the proposed hypotheses.
Mossetti (2006) offers an example of applying game theory, particularly the prisoner's dilemma model, to assess social dilemmas in the context of sustainable tourism. This application centers on the uncoordinated choices made by self-interested, profit-maximizing players.
Despite its significance, game theory remains an underdeveloped area within the field of tourism. Feeny et al. (1996) argue that addressing complex issues, such as overexploitation and conflicts between more powerful and weaker stakeholders in recreational land use, requires a more comprehensive framework. Vail and Hultkrantz (2000) express reservations about the effectiveness of cooperative games in mitigating conflicts among landowners, tourists and the distribution of benefits. Nevertheless, it is evident that game theory holds the potential to provide valuable insights and solutions for addressing these conflicts.
Williams (2001) emphasizes the challenge of establishing a stable ecosystem in tourist settings, primarily due to cultural differences. He proposes adopting a Western cultural approach that involves studying cooperation and conflict within a game theory framework. Williams underscores the need to shift policy priorities away from agricultural production in favor of facilitating public access to the countryside, as restricting such access can lead to conflicts concerning the development and management of natural landscapes.
Another challenge within the tourism sector involves navigating time series data, which can obscure the relationships between tourists and property owners concerning benefits. Numerous researchers, including Buhalis (2000), Wang and Krakover (2007), Uysal, Chen, and Williams (2000), Milhalic (2000), Kozak (2001) and Ritchie and Crouch (2000), recognize the role of governments in enhancing destination appeal through support and funding. However, many of these studies overlook the inclusion of time series data in their frameworks.
To facilitate decision-making for hotel managers, who often prefer succinct guidance over extensive information, Camarer and Johnson (1991) employed actuarial models like regression equations to address why experts possess extensive knowledge but make inaccurate predictions. This study adopts a similar approach by applying game theory to decision-making processes within suburban and resort hotels in the United States of America (Figure 3).
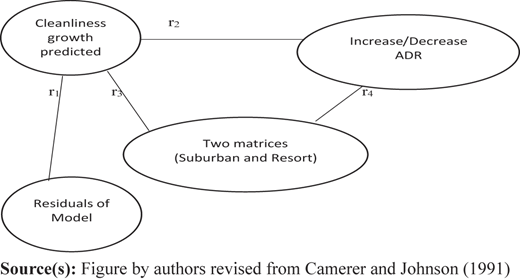
In the model above, r4 > r3 > r2 > r1 represents relationships among decisions (Camarer and Johnson, 1991). Hoteliers making ADR decisions prefer using matrices as a guide rather than relying solely on their experiences (r4 > r2). Camarer and Johnson (1991) report that full-time radiologists are no better than advanced medical students at detecting lesions in abnormal lungs, suggesting that, in some domains, training, but not professional experience, improves prediction. The main reason for this is that professional experts, such as national tourism organizations, often make decisions using the configural rule. The configural rule posits that the impact of one variable on an outcome depends on the level of another variable. To address these issues, this study proposes two matrices: one for hotels in suburban areas and another for hotels in resort areas.
The study aims to overcome the aforementioned issues by revising the average daily rates in a 12-month moving average of hotels in suburban and resort areas from 287 rooms of five hotels in Pensacola, providing crucial cues in matrix tables for hoteliers to make informed decisions in the competition. In this study, two matrices were established for two key players: Player 1 (suburban) and Player 2 (resort), catering to target customers who are leisure or business travelers in Pensacola during the six-year period (2018–2023).
The results, presented through ADR percent change growth, were reported in four quadrants of the matrix. Hotel managers can gain a clearer understanding of strategies in the matrix tables, enabling them to forecast the best responses, dominant strategies or Nash equilibrium. The study then tested the values in the four quadrants of the matrix for suburban and resort areas during the two seasons through the following hypotheses:
No significant correlation is expected between the hotel’s newest atmosphere and ADR, when there are fluctuations in ADR for suburban and resort settings throughout the year.
A positive correlation is anticipated between the hotel’s newest atmosphere and ADR during the high season, when ADR increases in suburban areas and decreases in resorts.
A positive correlation is expected between the hotel’s newest atmosphere and ADR during the low season, when both suburban and resort ADRs increase.
Methodology
Study sample
The study's sample comprises customers in the countries of Player 1 and Player 2. Data were collected from the World Trade Center and Smith Travel Research over a six-year period (2018–2023). The selection of Pensacola, encompassing suburban and resort areas, was motivated by the significant tourism potential with white-sand beaches and a thriving hotel business.
Matrices
Two matrices were developed for Player 1 and Player 2. Each matrix consists of two rows and two columns, representing an increase or decrease in the ADR for each player and their counterpart. Results based on cleanliness growth were reported in the four quadrants of the matrix. If the value in one quadrant surpasses those in other quadrants, it signifies the best response for that player. If values in one column or row exceed those in the other column or row, it indicates the dominant strategy for that player. If the values for both players are higher than those in other quadrants, it signifies Nash equilibrium for both players.
Data
Yearly data on ADRs, cleanliness levels and GDP per capita for the two players were collected from the World Trade Center and Smith Travel Research over the six-year period (2018–2023). The data were transformed into a 12-month moving average to address spurious issues in time series data. The percentage changes of the ADR for each player were calculated by dividing the difference for each year between two-year periods by the previous year to measure the growth rate.
Two peak and valley seasons were represented by a dummy variable, with 1 for quarters 2 and 3 and 0 for quarters 1 and 4. ADRs were set up in four quadrants for each player in the two game matrices, representing different scenarios. This resulted in eight variables in two matrices representing cleanliness levels for both players in the four quadrants.
Results
The matrices revealed significant variations in the hotel atmosphere's cleanliness levels when there were changes in ADRs from both players. The study's hypotheses received support, indicating distinct strategies for each player to maximize individual benefits. The pricing game between Player 1 and Player 2 involves rational individual actions, with each player choosing outcomes in their best interest.
Three matrix tables are presented below, proposing game theory strategies for the four quarters of the year between Player 1 and Player 2. Table 1 depicts the matrix for the entire year, irrespective of high or low seasons. Table 2 displays the matrix specific to the high season, while Table 3 reveals the matrix for the low season.
Percent change of cleanliness level without separating seasonal cycle
| Resort ADR increases | Resort ADR decreases | |||
|---|---|---|---|---|
| Suburban ADR increases | U1i (I,I) | Uil (I,I) | U2i (I,D) | Ui2 (I,I) |
| −5.65 | −24.9 | −0.49 | −1.9 | |
| Suburban ADR decreases | U3i (D,I) | Ui3 (D,I) | U4i (D,D) | Ui4 (D,D) |
| 7.6 | −21.8 | 2.1 | −612 | |
Source(s): Authors’ calculation
Percent change of cleanliness level in the high season
| Resort ADR increases | Resort ADR decreases | |||
|---|---|---|---|---|
| Suburban ADR increases | U1i (I,I) | Uil (I,I) | U2i (I,D) | Ui2 (I,I) |
| −7.345 | −149.4 | 0.0833 | 0.418 | |
| Suburban ADR decreases | U3i (D,I) | Ui3 (D,I) | U4i (D,D) | Ui4 (D,D) |
| 1.444 | 4.578 | −0.294 | −35128.8 | |
Source(s): Authors’ calculation
Percent change of cleanliness level in the low season
| Resort ADR increases | Resort ADR decreases | |||
|---|---|---|---|---|
| Suburban ADR increases | U1i (I,I) | Uil (I,I) | U2i (I,D) | Ui2 (I,I) |
| 10.17 | 82.17 | 1.617 | 4.56 | |
| Suburban ADR decreases | U3i (D,I) | Ui3 (D,I) | U4i (D,D) | Ui4 (D,D) |
| −29.64 | 54.5 | −8.19 | 64,872 | |
Source(s): Authors’ calculation
Comments: No Nash equilibrium is observed for both players. Hypothesis 1 has been validated.
In Quadrant 2 [0.08/0.41], Nash equilibrium is established, ensuring the highest cleanliness for both players to reflect the hotel's freshest atmosphere. When Player 1 increases its ADR and Player 2 decreases its ADR, both attain the maximum payoff during the high season.
Comments: Nash equilibrium exists in the high season. Hypothesis 2 has been substantiated.
In Quadrant 1 [10.17/82.17], Nash equilibrium is identified, securing the highest cleanliness for both players to mirror the hotel's newest ambiance. Increasing ADRs for both Player 1 and Player 2 in the low season leads to the highest payoff for cleanliness.
Comments: Nash equilibrium is present in the low season. Hypothesis 3 has been affirmed.
Discussion
In a win-win scenario, Nash equilibrium was observed during the peak season, where both players received the highest payoff. This equilibrium occurred when Player 1 and Player 2 either increased or decreased ADRs in opposite directions. In the off-season, a similar equilibrium was observed when the resort decreased ADRs and the suburb increased ADRs.
Cleanliness and sleep quality emerged as critical factors impacting a guest's decision to return. Positive experiences enhance loyalty, leading to future bookings and increased value from each guest. The study suggests that promoting hotels collaboratively during quarters 1 and 4, when room rates are lowest, can maximize promotional efforts.
Conclusions and implications
Situational manipulations, such as setting up matrices, were found to have a more substantial impact on information search than preferred cognitive styles. The study's findings have implications for revenue related to the hotel's newest atmosphere and cleanliness for both suburban and resort hotels, particularly when promoting tourism collaboratively. Despite two constraints, which include the assumption that hotel guests in both parties prefer not to change hotels and the focus on only two destinations in the tourist market, the study provides valuable insights for hotel managers in analyzing pricing strategies using matrices.

