


The purpose of this study is to evaluate rice farmers’ perceptions on the manifestations of the climate change and identify efficient strategies and determinants of adoption of these strategies in the Republic of Benin.
Surveys were conducted using participatory research appraisal tools and techniques, such as direct observation, individual interviews and field visits through a questionnaire for data collection. A total of 418 rice farmers across 39 villages located in the three climatic zones of the Republic of Benin were interviewed. Farmers’ perceptions, temperature from 1952 to 2018 and rainfall from 1960 to 2018 data obtained from meteorological stations were analysed using descriptive and inferences statistics.
All the surveyed farmers were aware of climate change and perceived diverse manifestations including the delay in rainfall regarded as the most important risk. They perceived that deforestation, no respect for the laws of nature and desacralization of morals, no respect for cultures and the traditional rainmakers are the main causes of climate change. The disruption of agricultural calendar and the reduction in rice yield were perceived as the main impacts of climate change in rice production. They used various approaches to adapt and mitigate climate change effects. The adoption of adaptation strategies was influenced either negatively or positively by the household size, land size, education level, membership to rice farmer’s association, training in rice production, access to extension services, use of improved varieties and the location in climatic zones.
For each climatic zone of the Republic of Benin, weather data were collected in only one meteorological station.
The study showed that it is important to educate rice farmers on the scientific causes of climate change for better resilience. There is an urgent need to train rice farmers in irrigation and water management techniques to cope with climate variability. To promote irrigation, the authors suggest the establishment of a subsidy and credit mechanism by the government. Factors that influenced adoption of efficient adaptation strategies to climate events must be taken into account for future adaptation policies in the Republic of Benin.
This study provided an overview of the perceptions and adaptations of rice farmers along the climatic gradient in the Republic of Benin. Therefore, the knowledge of the determining factors of the adaptation strategies used by rice farmers could be used in the setting up of effective climate change resilience policies in Benin.
1. Introduction
Climate change is one of the most disturbing and uncontrolled phenomenon that humanity is facing, and especially farmers. Throughout the world, the need to understand climate change has never been more urgent and important than in the 21st century, in a context of increase in the world population, projected to reach 9.8 billion (9.8 × 109) by 2050 [United Nations (UN), 2017]. With the evolutionary dynamics of the population, the need for food is increasing day by day, and it is urgent to carry out actions to reduce the effect of climate variability on agriculture to avoid facing the population hunger, which is increasing in the world due to climate variability (FAO, 2018). Simulation study, which uses 2014 as a baseline have shown that crop demand could increase between 25% and 70% in 2050 (Hunter et al., 2017). Several studies have been undertaken and led to the conclusion that the main climatic variability manifestations are the increase of the temperature and the decrease in the rainfalls. Modelling of temperature data in the West African region has shown increases in maximum temperatures of 0.5°C to 0.9°C and beyond +1°C for minimum temperatures (GIEC, 2019). In Benin, from 1960 to 2008, the average rainfall has declined by 3.2 mm per year and the temperature has linearly increased to 0.03°C per year (Gnanglè et al., 2011). One-degree Celsius increase in temperature results in a reduction in agricultural production in the estimated range of 3.1% to 7.4% (Zhao et al., 2017). In northern Benin, another study reveals that the conventional analysis of the series of rainfall, temperature and wind speed confirms the increase in maximum and minimum temperatures but does not allow the detection of any difference in rainfall distributions and increased high winds (Guibert et al., 2010).
These climate modifications have major consequences on agricultural activities and specifically on rice production, which is highly rainfall-dependent in the Republic of Benin (Soglo and Nonvide, 2019). Thus, climate change could lead to the decline in rice productivity, which, in turn, will reduce food availability and therefore pose a serious threat to food security (Chandio et al., 2020). Kouton-Bognon et al. (2015) showed that an increase precipitation by 1% in the southern Benin increases rice income by 1.9%, while the increase in average temperature by 1% leads to the decrease in rice income by 0.5%. To avoid facing food insecurity in general and a decline in rice yield in particular, but also the deterioration of the environment resulting from climate variability, it is essential that producers strengthen their capacity to mitigation. One of the ways to achieve this is to understand daily the behaviour of climatic parameters based on modelling over time of past data. Such a study associated with farmer’s perceptions and their adaptation strategies to cope with climate change could help mitigate the negative impacts of climate variability on the agriculture (Mtambanengwe, 2012). Although several studies have focused on climate change in the Republic of Benin, very little information on the perception of rice farmers on these manifestations, causes and impacts of climate change is documented. It is evident that this perception influences the farmers’ adaptation strategies (Kolleh and Jones, 2018). Therefore, understanding farmers’ perception of climate change is important to develop efficient adaptation strategies and highlight the climate impacts requiring policy-level interventions (Chhogyel et al., 2020).
Without these measures, agricultural production in the Republic of Benin is expected to decrease by either 5% or 20% in 2025 (Paeth et al., 2008; Yegbemey et al., 2014). According to Adger (2003), adaptive capacities refer to the ability to adapt and recover from the impacts of climate change. For instance, Arimi (2014) found that shifting planting date until the weather conditions are more favourable, and using improved rice variety and chemical fertilizer are the three major adaptation practices used by rice farmers in Nigeria. In Ghana, rice farmers attempt to adapt to climate change using practices such as early planting field and rice transplantation (Zakaria and Matsui, 2020). In South Africa, farmers opted for the adoption of drought-tolerant varieties, which is the most common climate-response strategy (Elum et al., 2017). On the contrary, Malaysian farmers added more water in the field for maintaining the required moisture level during the time of high temperature or sunshine (Alam et al., 2012). Therefore, there is an urgent need to adopt adaptation strategies to address the impacts of climate change that ultimately could threaten food security and economy in the Republic of Benin. The objective of this study aims to document farmers’ perceptions and identify the current rice farmers’ adaptation strategies to cope with the manifestations of climate change, as well as their determinants.
2. Material and methods
2.1 Study area
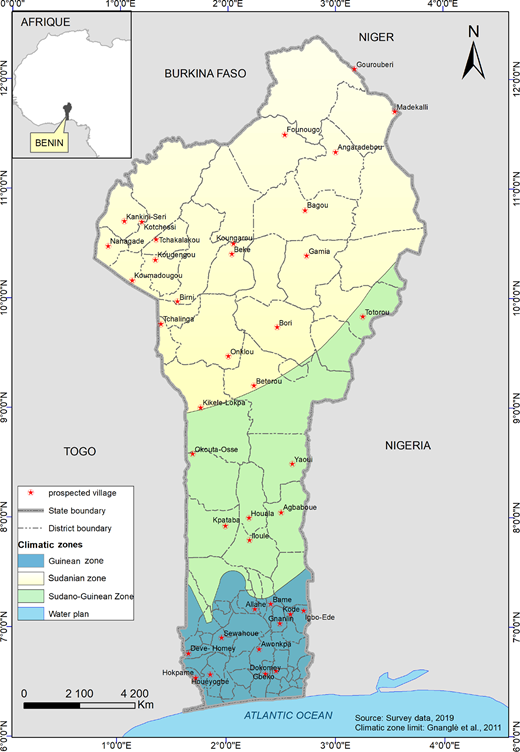
The study was carried out in Benin (114,763 km2), a West African country located between meridians 0° 40' and 3° 45' East longitude and parallels 06° 15' and 12° 25' North latitude. The population of Benin is estimated at 9,983,884 inhabitants, divided into a mosaic of sociolinguistic groups (INSAE, 2016). The three climatic zones of the Republic of Benin [Soudanian zone (9° 45’–12° 25’ N), Soudano–Guinean zone (7° 30’–9° 45’ N) and Guinean zone (6° 25’–7° 30’ N)] were taken into account in this study. In the Soudanian zone, the unimodal rainfall regime is observed with an annual mean temperature from 30°C to 38°C. In the Soudano–Guinean zone, a transitional precipitation regime is observed with a mean annual temperature of 30°C. While in the Guinean zone, the climate is subequatorial with four uneven seasons, two rainy seasons and two dry seasons with annual mean ranging from 28°C to 32°C (Gnanglè et al., 2011).
2.2 Survey
The survey was conducted in 39 villages [21 villages in the Soudanian zone, six in the Soudano–Guinean zone and 12 in the Guinean zone (Figure 1)] and involved 418 rice farmers. This number of surveyed farmers was estimated using the normal approximation of the binomial distribution proposed by Dagnelie (1998):
where n is the number of the surveyed rice farmers; = 1.96 is the quantile of a standard normal distribution for a probability value of 0.05; p = 0.11 is the proportion of rice producers population; and d is the expected error margin of any parameter to be computed from the survey and fixed at 0.03. The value of p was determined according to Adebo et al. (2018) by considering a single person interviewed per household, the number of agricultural households in the Republic of Benin (651,067 agricultural households) (INSAE, 2016) and the number of households involved in rice production (72,400 households) [Ministère de l'Agriculture, de l'Elevage et de la Pêche (MAEP), 2008].
Surveys were conducted using participatory research appraisal tools and techniques, such as direct observation, individual interviews and field visits through a questionnaire for data collection (Loko et al., 2019). These villages were selected in collaboration with the agents of the Territorial Agencies for Agricultural Development in each region based on the accessibility of the area and on rice production statistics. The surveyed rice farmers were chosen randomly, and at least 10 rice farmers were surveyed in each village. Individual interviews were conducted with the help of translators in each area for data collection. Information collected were related to the socio-economic characteristics of rice farmers (education, age, sex, household size, years of experience in rice production, membership of a farmers’ association, training in rice production, contact with extension services, land ownership, use of fertilizer, use of improved varieties and use of irrigation). Farmers’ perceptions on the manifestation of climate change, causes and influence of rainmakers on rice production were also recorded. Approaches for adaptation to cope with each manifestation of climate change identified by the surveyed farmer were recorded.
2.3 Meteorological data
The climatological data (temperature and rainfall) over a minimum period of 58 years (1960–2018) and a maximum period of 66 years (1952–2018) were collected from the Agence pour la Sécurité de la Navigation Aérienne (ASECNA) of the Republic of Benin. The data were collected for three weather stations across the country: Kandi station for the Soudanian zone, Savè station for the Soudano–Guinean zone and Cotonou station for the Guinean zone. The analysis of these climatic data were used to compare farmers’ perceptions of climate change manifestations and scientific observations (Paudel et al., 2020).
2.4 Data analysis
Descriptive statistics (per cent, average and error type) were used to describe characteristic of rice farmers’ surveyed and their response to the study. Descriptive statistics were performed using R software (R Core Team, 2019). Chi-square test and t-test were applied on the one hand to identify the relationship between the responses of the rice farmers surveyed and the different climatic zones of Benin and, on the other hand, to compare characteristics of adopters and non-adopters of strategies to cope with climate change. As applied by Asfaw et al. (2019), the effect size (ES) of chi-square test was interpreted as weak (ES < 0.1), fair (ES = 0.11–0.3), moderate (ES = 0.31–0.5), strong (ES = 0.51–0.8) and very strong (ES > 0.81).
The multinomial logistic regression was performed to identify the determinants of farmers’ adaptation choice to climate change using STATA software (version 13.0). For that, farmers’ adaptation practices in the study area were classified in five categories: use of adapted rice varieties (early varieties, flood-tolerant varieties, drought-tolerant varieties and dwarf varieties), change of farming calendar, use of irrigation systems, water management techniques and no adaptation. The explanatory variables used in the model were selected based on the literature review and presented in Table 1. The category – no adaptation was used as the base category in the multinomial logit model. The expected change in the probability of farmers to use a particular strategy to cope with climate change was estimated by calculating marginal effects.
Description of explanatory variables and descriptive statistics of the surveyed farmers in the study area
| Variables | Description |
|---|---|
| Dependent variable | |
| Adaptation to climate change | Dummy = 1 if a farmer use at least one adaptation practice to climate change, 0 otherwise |
| Independent variables | |
| Education level | Dummy = 1 if the farmer has a secondary education or higher education level, 0 if the farmer is illiterate or has a basic education |
| Gender of the rice farmer | Dummy = 1 if respondent is male, 0 otherwise |
| Age | Number of years from birth |
| Experience in rice production | Number of years in rice farming |
| Household size | Number of family members |
| Land ownership | Dummy = 1 if the farmer owns land cultivated; 0 otherwise |
| Land size | Number of hectares of rice plots cultivated |
| Use of fertilizer | Dummy = 1 if farmer use fertilizer, 0 otherwise |
| Use of improved seed | Dummy = 1 if farmer use improved seed, 0 otherwise |
| Irrigation | Dummy = 1 if the farming rice is the irrigated system, 0 otherwise |
| Membership of rice farmers association | Dummy = 1 if yes, 0 otherwise |
| Training in rice production | Dummy = 1 if yes, 0 otherwise |
| Extension services | Dummy = 1 if the farmer has access to extension services, 0 otherwise |
| Soudanian zone | Dummy = 1 if the rice farmer is located in Soudanian zone, 0 otherwise |
| Soudano–Guinean zone | Dummy = 1 if the rice farmer is located in Soudano–Guinean zone, 0 otherwise |
| Guinean zone | Dummy = 1 if the rice farmer is located in Guinean zone, 0 otherwise |
The meteorological data were processed using the Khronostat software developed by the French National Institute for Sustainable Development (IRD) (Lubes-Niel et al., 1998). The breaks of stationarity were highlighted on the rainfall series from the Pettitt (1979) test and Lee and Heghinian (1977) method. The Pettitt test is based on the Mann–Whitney two sample test (rank based) and allows the detection of a single shift at an unknown time t. The null hypothesis is no change in the distribution of a sequence of random variables; the alternative hypothesis is that the distribution function F1(x) of the random variables from X1 to Xt is different from the distribution function F2(x) of the random variables from Xt+1 to Xt (Mallakpour and Villarini, 2016). Before these tests, the inter-annual variability of rainfall levels was studied from calculations of positive and negative anomalies. As for the thermometric trends, an analysis of the inter-annual variability of the minimum, average and maximum temperatures of the study areas was carried out.
3. Results
3.1 Characteristic of surveyed rice farmers
The majority (74.5%) of surveyed rice farmers were men, and 84.9% of them were considered as illiterate. The structure of the age showed that 10.8% of the rice farmers’ surveyed were young (age ` 30 years), 77.3% adults (30 years ` age ` 60 years) and 23.8% old persons (age > 60 years), with an average age of 44 years. In total, 73.2% of surveyed farmers had household sizes between 1 and 10 persons, 24.4% between 11 and 20 people and 2.4% between 21 and 34. The surveyed farmers had an average of 14 years of experience in rice cultivation, but very few (12.7%) practised irrigated rice production system. Most of farmers were members of a rice farmers association (63%), had received a training in rice production (65.7%) and had access to extension services (60.1%). The majority cultivated improved rice varieties (80.3%) and used fertilizer (77.9%).
3.2 Rice farmers’ perceptions on the manifestations of climate change
All the surveyed rice farmers had ideas about the manifestation of climate change, their understanding about it differed according to their climatic zone (Table 2). The manifestations of climate change were dependent on the climatic zones of Benin based on the response of the people surveyed (χ2 = 76.458; DF = 16; p-value = 0.000). The rain delay (21.3%) was the main manifestation of climate change perceived across all climatic zones. Heavy rains and floods (20% each) were the second most important climate change manifestations perceived by rice farmers located in the Guinean zone, while the decrease in the rain frequency (21.9%) and the strong winds (14.2%) were the second most important in the Soudano–Guinean zone and Soudanian zone, respectively. The drought (11.1%) and the fluctuation of the rains (7%) were, however, perceived across all the climatic zones, while the proliferation of pests and diseases was only perceived in the Soudano–Guinean zone and the Soudanian zone. Rice farmers in the Guinean and Soudanian zones mentioned the high temperature (4.8%) and the early stop of rains was listed by only a few farmers in the Soudanian zone (0.1%).
Rice farmers’ perception on manifestation of climate change in function of climatic zone of the Republic of Benin
| Manifestations | Percentage of responses | |||
|---|---|---|---|---|
| Guinean zone (N = 138) | Soudano–Guinean zone (N = 63) | Soudanian zone (N = 217) | Study area (N = 418) | |
| Rain delay | 22.1 | 23.1 | 20.4 | 21.3 |
| Decrease in the frequency of rain | 15.5 | 21.9 | 13.3 | 15.1 |
| Heavy rains | 20 | 21.4 | 9.3 | 14.7 |
| Flood | 20 | 15 | 11.2 | 14.4 |
| Drought | 12.3 | 11.6 | 10.2 | 11.1 |
| Strong winds | – | – | 14.2 | 7.6 |
| Fluctuation of the rains | 9.5 | 6.4 | 5.6 | 7 |
| High temperature | 0.6 | – | 8.6 | 4.8 |
| Proliferation of pests and diseases | – | 0.6 | 7.1 | 3.9 |
| Early cessation of rains | – | – | 0.1 | 0.1 |
Note:
*N: Number of surveyed farmers
3.3 Rice farmers’ perceptions of the causes of climate change
Most of surveyed rice farmers (80.9%) observed at least one cause of climate change (Table 3). However, deforestation (71.6%) was the main cause of climate change perceived by the most of farmers, followed by the no respect for restrictions (18.1%) and the traditional rainmakers (18.1%) for rice farmers living in Guinean zone. However, rice farmers living in the Soudanian zone perceived anthropogenic activities as the second most important cause of climate change, while some farmers in the Guinean and Soudano–Guinean zones considered God as the cause of climate change (Table 3). In the same way, farmers in the Guinean and Soudanian zone perceived no respect for the laws of nature and desacralization of morals. Human population growth (1.4%) and the use of herbicides (0.5%) can also be seen as causes of climate change by few rice farmers in the Soudanian zone. A small part of surveyed farmers thought that traditional rainmakers have an influence (beneficial or detrimental) on the rainfall and its timing (Table 4).
Rice farmers’ perception on the causes of climate change in function of climatic zone of the Republic of Benin
| Causes | Percentage of responses | |||
|---|---|---|---|---|
| Guinean zone (N* = 93) | Soudano–Guinean zone (N = 33) | Soudanian zone (N = 212) | Study area (N = 338) | |
| Deforestation | 48.9 | 96.9 | 77.7 | 71.6 |
| Non respect of forbidden | 18.1 | – | 3.2 | 7 |
| Anthropogenic activities | – | – | 10.7 | 6.7 |
| Traditional rainmakers | 18.1 | – | – | 5 |
| Non respect of laws of nature | 1.1 | – | 6 | 4.1 |
| God | 12.7 | 3.1 | – | 3.8 |
| Human population growth | – | – | 1.4 | 0.9 |
| Desacralization of morals | 1.1 | – | 0.5 | 0.6 |
| Use of herbicides | – | – | 0.5 | 0.3 |
Farmers’ perception of the influence of traditional rainmakers on rice production
| Types of influence | Percentage of rice farmers | |||
|---|---|---|---|---|
| Guinean zone (N = 138) | Soudano–Guinean zone (N = 63) | Soudanian zone (N = 217) | Study area (N = 418) | |
| No influence on rice production | 46.6 | 84.9 | 97.9 | 78.6 |
| Blockage of rains that causes disturbance of rainy seasons | 35.8 | 9.4 | 0.4 | 14.1 |
| Relocate rains from one area to another | 6.8 | 3.8 | – | 2.8 |
| No control of the rain cycle | 4.1 | – | – | 1.4 |
| Low productivity | 3.4 | – | 0.4 | 1.1 |
| No control of production periods | 2.0 | – | – | 0.8 |
| Causes rains in the dry season | – | 1.9 | 1.3 | 0.8 |
| Rainfall delay | 1.3 | – | – | 0.4 |
3.4 Climate trends
3.4.1 Climate trends in the Soudanian zone.
Figure 2(a) shows the results of the application of the Pettitt test on annual rainfall series in the north Benin (Kandi station). Only the test of Lee and Heghinian showed a disruption in 1982 in the chronicle of annual rainfall (but not through the rank correlation test). The means of the sub-series before and after the disruption were, respectively, 1,151.62727 mm and 1,172.83611 mm, that revealed a rainfall deficit of 0.15% before the disruption, meaning that the period from 1961 to 1982 might be wetter than that from 1983 to 2018. This indicates a slight change in rainfall over these two sub-periods, with inter-seasonal evolution making it possible to highlight the significant decline in seasonal rainfall levels over the 1983–2018 sub-period.
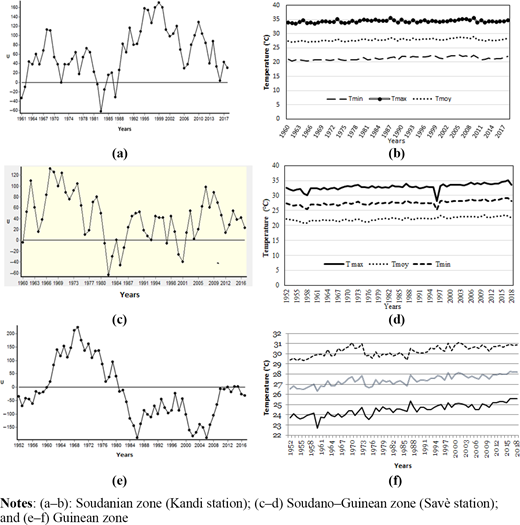
Analysis of the break in rainfall stationarity (variable U of the Pettitt test) and inter-annual variation in mean temperature in the climatic zones of the Republic of Benin (1952–2018)
Analysis of the break in rainfall stationarity (variable U of the Pettitt test) and inter-annual variation in mean temperature in the climatic zones of the Republic of Benin (1952–2018)
Figure 2(b) shows the evolution of the minimum and maximum annual temperatures observed at the Kandi station. The average annual temperatures recorded in this station during the 1960–2018 period were around 27.54°C. At the Kandi meteorological station, the average annual temperature was 27.97°C, the extreme values (35.55°C) were recorded in 2009 between March and April, while the minimum (20.32°C) in 1965–1966 from December to January. Overall, there is an increasing temperature trend between 1960 and 2018 in the study environment.
3.4.2 Climate trends in the Soudano–Guinean zone.
Figure 2(c) shows the results of the application of the Pettitt test on annual rainfall in the central Benin (Savé station). A break in stationarity was observed around 1983 in the rainfall field used (95% significance), allowing to identify two sub-periods, from 1960 to 1982 and from 1983 to 2018.
The analysis of the inter-annual change in minimal and maximal temperatures [Figure 2(d)] showed a tendency for thermometric warming in the basin for the period concerned. Temperature went overall from 30.40°C in 1970 to 34.17°C in 2015, i.e. an increase of 3.77°C for maximal temperatures and from 21.79 to 23.47°C, i.e. 1.71°C for minimal ones.
3.4.3 Climate trends in the Guinean zone.
Using a 95% significant Pettitt test on rainfall measurement, we observe [Figure 2(e)] here again two different subperiods, from 1952 to 1970 and from 1971 to 2018. The rainfall for the period from 1952 to 1970 remains higher than from 1971 to 2018, confirming that the years 1971 to 1990 are marked by rainfall decline demonstrated by previous studies in the study areas [Figure 2(e)].
The analysis of the inter-annual evolution of the maximum and minimum temperatures revealed a tendency for thermometric heating in the study environment for the same period [Figure 2(f)]. The minimal temperatures went from 23.68°C in 1952 to 25.37°C in 2018, an increase of 1.69°C.
3.5 Rice farmers’ perceptions of the impact of climate change on rice production
The surveyed rice farmers perceived diverse impacts of climate change on rice production (Table 5). Considering the five main impacts of climate change, the answers given by the respondents depend on the climatic zones (χ2 = 28.097; DF = 8; p-value = 0.000). Rice farmers perceived the disruption of the agricultural calendar (41.5%) and the drop of rice yield (41.4%) as the most common impacts of climate change on rice production in the study area, with insect attacks (8%) and the total loss of rice fields due to flooding (2.1%) also identified. The plant lodging (9.1%) was perceived by some rice farmers in the Soudanian zone with the yellowing of plants due to drought (0.7%), the rotting of mature rice grains (0.5%), the winding of rice leaves (0.2%), the unfertile soil (0.2%), the loss of sown seeds due to heavy rains (0.2%) and the loss of rice flowers due to strong winds.
Rice farmers’ perception of the impact of climate change on rice production
| Impacts | Percentage of responses | ||||
|---|---|---|---|---|---|
| Guinean zone (N = 138) | Soudano–Guinean zone (N = 63) | Soudanian zone (N = 216) | Study area (N = 417) | ||
| Disruption of agricultural calendar | 48.5 | 52.5 | 35.7 | 41.5 | |
| Drop of rice yield | 44.9 | 40.6 | 39.6 | 41.4 | |
| Insect attacks | 4.9 | 3.9 | 10.4 | 8 | |
| Plant lodging | 0.7 | – | 9.1 | 5.5 | |
| Total destruction of fields due to flooding | 1.0 | 2.0 | 2.7 | 2.1 | |
| Yellowing of plants due to drought | – | – | 0.7 | 0.4 | |
| Panicle sterility | – | 1.0 | 0.5 | 0.4 | |
| Rotting of mature rice grains | – | – | 0.5 | 0.3 | |
| Winding leaves | – | – | 0.2 | 0.1 | |
| Soil poverty | – | – | 0.2 | 0.1 | |
| Loss of sown seeds due to heavy rains | – | – | 0.2 | 0.1 | |
| Loss of flowers due to strong winds | – | – | 0.2 | 0.1 | |
3.6 Comparison of rice farmer’s perceptions and empirical trend
The raw data on the temperature revealed an increasing trend in the study area. The same observation was made by rice farmer’s confirming that they have a good knowledge about the climate change manifestation. When we considered the climatic zone of the respondents, we found that rice farmers in the Soudano–Guinean transition zone did not observe this change in temperature. The analysis of the raw data collected in the national stations of meteorology revealed a variation of the annual rainfall average between the different periods used for the modelling. Rice farmers, based on their statements, also observed this change: delay in rainfall, decrease in the frequency of rain; heavy rainfalls, flood and drought. These statements did not necessarily correlate with an annual variation as observed with the modelling using the meteorological data but expressed the changes in the rate of rainfall.
3.7 Rice farmers’ approaches towards adaptation to cope with the manifestations
Half of surveyed rice farmers (50.3%) did not use any method to cope with climate change. The remaining used various types of adaptation measures depending on the climate manifestation (Table 6). For flooding, some flood-tolerant varieties were used in the Soudanian zone (24.7%), along with early varieties (8.8%) and few late matured varieties (1.8%). In the Guinean zone, farmers build dikes in rice fields for water storage (11.9%) and avoided sowing rice in March (0.7%). In the Soudano–Guinean zone, few rice farmers (1.9%) harvested rice on time to avoid flood.
Rice famers’ adaptation approaches to some climate manifestations
| Climate manifestations | Approaches | Guinean zone (N = 138) | Soudano–Guinean zone (N = 63) | Soudanian zone (N = 217) | Study area (N = 418) |
|---|---|---|---|---|---|
| Flood | |||||
| No approach | 87.4 | 98.1 | 64.7 | 76.4 | |
| Flood-tolerant varieties | – | – | 24.7 | 13.5 | |
| Early varieties | – | – | 8.8 | 4.8 | |
| Construction of dikes for water evacuation | 11.9 | – | – | 3.9 | |
| Long cycle varieties | – | – | 1.8 | 1 | |
| Harvest quickly | – | 1.9 | – | 0.2 | |
| Avoid sowing rice in March | 0.7 | – | – | 0.2 | |
| Drought | |||||
| No approach | 99.2 | 92.4 | 59.1 | 78.6 | |
| Drought-tolerant varieties | – | – | 29.2 | 14.2 | |
| Early varieties | – | 5.7 | 11.1 | 5.4 | |
| Irrigation | 0.8 | – | – | 1.1 | |
| Creation of a channel to better serve the sown area with water | – | 1.9 | – | 0.3 | |
| Installation of barriers to block the flow of water out of the cultivated land | – | – | 0.6 | 0.3 | |
| Strong winds | |||||
| No approach | – | – | 78.9 | 88.5 | |
| Dwarf varieties | – | – | 21.1 | 11.5 | |
| Rain delay | |||||
| No approach | 100 | 100 | 40.6 | 69.1 | |
| Early varieties | – | – | 59.4 | 30.9 | |
| Early cessation of rains | |||||
| No approach | 100 | 100 | 60.8 | 79.4 | |
| Early varieties | – | – | 39.2 | 20.3 | |
| High temperature | |||||
| No approach | 100 | 100 | 99.1 | 99.5 | |
| Resistant varieties | – | – | 0.9 | 0.5 | |
| Pests and diseases | |||||
| No approach | 100 | 100 | 92.1 | 96 | |
| Pesticides | – | – | 5.1 | 2.6 | |
| Resistant varieties | – | – | 2.8 | 1.4 |
Drought-tolerant varieties were only used by one third of rice farmers in the Soudanian zone (30%), while in the Soudano–Guinean (5.7%) and Soudanian (11.1%) zones, early varieties are used to cope with drought. Creation of channels to better serve the rice-growing area with water was practised by some rice farmers in the Soudano–Guinean zone. Only few farmers (0.8%) in the Guinean zone irrigated their rice fields to avoid drought stress, and few used mulches to avoid evaporation (0.6%) in the Soudanian zone.
3.8 Determinants of rice farmers’ adaptation choice to climate change
The difference of characteristics between adopters and non-adopters of at least one adaptation strategy to cope with climate change is presented in Table 7. Statistical analysis showed that adopter had higher household size but cultivated smaller rice plots. In addition, there are significant differences between adopters and non-adopters in terms of education, membership to rice farmers’ association, training in rice production, access to extension services, use of improved varieties and the location in a climatic zone. There is, however, no significant difference between adopters and non-adopters in terms of age, gender, experience in rice production, use of fertilizer, land ownership and irrigation systems.
Comparison of rice farmers adopting and not adopting strategies to cope with climate change
| Characteristics | Adopters | Non adopters | X2 | Effect size |
|---|---|---|---|---|
| Gender | ||||
| Male | 156 | 156 | 0.028 ns | 0.008 ns |
| Female | 52 | 54 | ||
| Education | ||||
| Illiterate | 185 | 170 | 5.212** | 0.112** |
| Literate | 23 | 40 | ||
| Membership of rice farmers association | ||||
| Yes | 116 | 148 | 9.714** | 0.152** |
| No | 92 | 62 | ||
| Training in rice production | ||||
| Yes | 116 | 159 | 18.470*** | 0.210*** |
| No | 92 | 51 | ||
| Access to extension services | ||||
| Yes | 102 | 150 | 21.881*** | 0.229*** |
| No | 106 | 60 | ||
| Use of fertilizer | ||||
| Yes | 159 | 167 | 0.578 ns | 0.037 ns |
| No | 49 | 43 | ||
| Use of improved varieties | ||||
| Yes | 151 | 184 | 14.820*** | 0.188*** |
| No | 57 | 26 | ||
| Land ownership | ||||
| Yes | 156 | 162 | 0.264 ns | 0.025 ns |
| No | 52 | 48 | ||
| Irrigation | ||||
| Yes | 20 | 33 | 0.351 ns | 0.092 ns |
| No | 188 | 177 | ||
| Soudanian zone | ||||
| Yes | 169 | 61 | 115.068*** | 0.525*** |
| No | 39 | 149 | ||
| Soudano–Guinean zone | ||||
| Yes | 6 | 36 | 9.536** | 0.237*** |
| No | 202 | 174 | ||
| Guinean zone | ||||
| Yes | 30 | 109 | 66.182*** | 0.398*** |
| No | 178 | 101 | ||
| Adopters | Non adopters | t test | |
| Age | 44.1 ± 0.8 | 43.7 ± 0.9 | 0.088 ns |
| Experience | 14.5 ± 0.8 | 13.5 ± 0.7 | 1.005 ns |
| Household size | 9.1 ± 0.3 | 8.2 ± 0.3 | 3.814** |
| Land size (ha) | 1.0 ± 0.0 | 1.3 ± 0.1 | 5.465** |
Note:
ns: non-significant.
**and
***statistically significant at 5 and 1%, respectively
Out of the 16 explanatory variables used in the multinomial logit model (p < 0.0000, 38.34% of explanation), three variables (land ownership, and farmers located in Soudano–Guinean and Guinean zones) negatively influenced the decision of rice farmers to use tolerant or resistant rice varieties (Table 8). However, the use of fertilizer and the location of rice farmers in Soudanian zone positively and significantly influenced their decision to use tolerant or resistant rice varieties. All the 16 explanatory variables had insignificant influence on farmers’ decisions to change the farming calendar to cope with climate change. The membership of rice farmers to association negatively influenced the decision of rice farmers to use irrigation systems. The decision of farmers to use water management techniques to cope with climate was positively influenced by the land size but negatively influenced by the access to extension services.
Factors determining rice farmers’ adaptation decision to climate change
| Variables | Use of adapted rice varieties | Change of farming calendar | Use of irrigation | Water management techniques | ||||
|---|---|---|---|---|---|---|---|---|
| Coefficient | dy/dx | Coefficient | dy/dx | Coefficient | dy/dx | Coefficient | dy/dx | |
| Male headed household | −0.163 | 0.002 | 28.664 | −2.199 | −0.849 | 0.053 | −0.714 | −0.040 |
| Age | 0.004 | 0.011 | −1.852 | 0.144 | −0.036 | 0.006 | 0.023 | 0.006 |
| Household size | −0.017 | −0.018 | 4.328 | −0.337 | 0.085 | −0.016 | −0.023 | −0.017 |
| Education | −0.055 | 0.065 | −30.761 | 2.571 | −18.482 | 1.742 | 0.584 | 0.160 |
| Experience | −0.004 | 0.002 | −1.114 | 0.090 | 0.009 | 0.003 | −0.025 | 0.008 |
| Land ownership | −0.722* | 0.085 | 6.915 | −0.685 | 16.288 | −1.475 | 0.410 | −0.104 |
| Training in rice production | −0.507 | −0.032 | 105.766 | −8.246 | −1.230 | −0.132 | 0.246 | −0.505 |
| Membership of rice farmers association | 0.109 | −0.017 | −1.379 | 0.113 | −4.725* | 0.375 | 1.002 | −0.099 |
| Use of fertilizer | 0.865** | −0.262 | −1.673 | −0.516 | −4.316 | −0.557 | 17.300 | −2.079 |
| Irrigation | −0.033 | 0.262 | −88.055 | 7.762 | −17.439 | 2.769 | −18.360 | 2.678 |
| Extension services | −0.409 | 0.140 | −60.088 | 4.739 | 2.723 | 0.008 | −1.446* | 0.477 |
| Land size | −0.078 | −0.002 | 10.435 | −0.834 | 0.651 | −0.100 | 0.393* | −0.095 |
| Use of improved varieties | 0.515 | 0.122 | −58.625 | 5.352 | −14.419 | 2.298 | −16.814 | 2.305 |
| Soudanian zone | 1.564* | −0.206 | −56.796 | 4.327 | 3.939 | −0.353 | 0.437 | 0.108 |
| Soudano–Guinean zone | −1.419** | 0.173 | −9.378 | 0.376 | 9.492 | −1.160 | 8.146 | −0.870 |
| Guinean zone | −0.723** | 0.074 | −6.243 | 0.217 | 7.820 | −0.940 | 5.695 | −0.632 |
| Constant | −0.213 | −20.503 | −21.736 | −20.136 | ||||
| Base category | No adaptation | |||||||
| Number of observation | 418 | |||||||
| Log likelihood | −241.96892 | |||||||
| LR chi2 (63) | 300.92 | |||||||
| Prob > chi2 | 0.0000 | |||||||
| Pseudo R2 | 0.3834 | |||||||
Note:
*,
**and
***statistically significant at 10, 5 and 1%, respectively
4. Discussion
4.1 Rice farmers’ perceptions and response to climate variability
This study shows that in the Republic of Benin, rice farmers are much more aware of climate change. Indeed, all the surveyed farmers observed at least one climatic variability in their locality. Variations in the intensity and frequency of rainfalls, and the increase in temperature are listed as the most important manifestations of climate change. Yam farmers mentioned the same manifestations of climate change in the Republic of Benin (Loko et al., 2013) and the analysis of meteorological data corroborates these perceptions, especially with regard to the temperature (Mulenga et al., 2017). In addition, others manifestations of climate change listed by farmers, such as flood, drought and violent winds, were also revealed by several previous studies in the Republic of Benin but in different proportions (Gnangle et al., 2012; Soglo and Nonvide, 2019), attesting that surveyed rice farmers have a good perception of manifestations of climate change.
Similarly, to Ethiopian (Tesfahunegn et al., 2016) and Nigerian (Ofuoku, 2011) farmers, deforestation is mentioned by the surveyed farmers as the most important cause of climate change. Indeed, deforestation contributes to carbon emissions, leads to extreme warming and have the capacity to reduce rainfall (Vargas Zeppetello et al., 2020; Chapman et al., 2020). Lokossou et al. (2020) also demonstrated that it could also result in the farmers’ adaptation to climate variability, which leads them to practice extensive agriculture, the main factor of deforestation, and thus aggravating this effect. Therefore, deforestation practices by rural farmers through bushfires and charcoal making, for example, should be discouraged. In addition, as suggested by Soglo and Nonvide (2019), the promotion of reforestation is very important in the fight against desertification and strong winds.
Other causes of climate change observed by farmers in the Soudanian zone, such as anthropogenic activities, human population growth and use of herbicides, are well known as among the causes of climate change (Crowley, 2000; Bouwman et al., 2020), thus underlining a good knowledge of climate change causes. However, in the Guinean zone, many surveyed farmers rely on religious or traditional beliefs to justify climate change. These surveyed farmers perceive the climate change manifestations as a penalty by God because there is no respect for restrictions, laws of nature and desacralization of morals. In the same way, rainmaking was also perceived by some surveyed farmers living in the Guinean zone as a cause of climate change. This perception is shared by the Pedi tribes of South Africa (Semenya, 2013), which believe that traditional rainmakers using rituals can influence weather conditions. However, the action of rainmakers was perceived by some surveyed farmers as negative for rice production due to their ability to block rains to protect some social events. Therefore, it is important to educate rice farmers on the scientific causes of climate change for a better resilience.
The disruption of agricultural calendar perceived as the main impact of climate change was corroborated by the results of Lokossou et al. (2020). Many farmers produce several crops in Republic of Benin, such as yam (Loko et al., 2013), maize (Yegbemey et al., 2014; Soglo and Nonvide, 2019) and sorghum (Dossou-aminon et al., 2016), have also mentioned the disruption of agricultural calendar and the yield loss as a result of climate change. According to Mackill et al. (2011), rising temperature combined to rainfall variability leads to the important reduction of rice yield. The pressure of insect pests in rice fields as a result of climate change is corroborated by several studies that have shown the relationship between climatic factors and the proliferation of rice insect pests (Kwon et al., 2012; Haider et al., 2020). Unfertile soil are among the least observed impact of climate change, while several studies in the Republic of Benin have revealed the negative effects of climate change on soil fertility (Sale et al., 2014; Adebiyi et al., 2019). Although the surveyed farmers noted only negative impacts of climate change on rice production, some studies have shown that carbon dioxide emissions can positively influence rice yield (Chandio et al., 2020).
Similar to Malaysian rice farmers (Alam et al., 2012), the majority of surveyed farmers do not use any strategy to cope with climate change. This could be explained by the fact that a great number of surveyed rice farmers were illiterate and have meagre financial resources. Indeed, some studies revealed that education and access to credits increase the probability of farmers to adopt climate change adaptation strategies (Ali and Erenstein, 2017; Belay et al., 2017). Some farmers reported various approaches focused on modification of crop practices (changing crop varieties, adjusting planting dates, etc.). Change of cultural practices of rice to cope with climate change was also practised by some farmers around the world, such as Malaysian (Akhtar et al., 2019), Pakistani (Abid et al., 2019) and Ethiopian (Belay et al., 2017). Very few surveyed farmers in the study area use irrigation systems and water management techniques to cope with climate change; given their potential, there is an urgent need to train farmers in irrigation and water management techniques.
Our results show that farmers adopting at least one strategy to cope with climate change have a large family but cultivated smaller rice plots. This is not surprising because large families are better equipped to observe climate change through family discussions, which positively influences their adaptation (Tesfahunegn et al., 2016). In addition, according to Belay et al. (2017) and Deressa et al. (2009), household size is associated with certain coping strategies that require labour-intensive activities and cultivating a small plot favours their implementation. Similarly, education level, membership to rice farmers association, access to extension services and training in rice production influenced the adaptation of rice farmers to climate change. Indeed, several studies showed that education increases the probability of farmers to use strategies to cope with climate change (Deressa et al., 2009; Arimi, 2014; Abid et al., 2015; Vijayasarathy and Ashok, 2015; Belay et al., 2017; Asfaw et al., 2019; Eshetu et al., 2020; Paudel et al., 2020). It is known that in contact to others farmers or extension services, farmers receive more information on the climate change impact, which favours the implementation of climate change adaptation (Eshetu et al., 2020). However, the membership of farmers to farmer-based organizations negatively influences the decision of rice farmers to use irrigation to cope with climate change. Indeed, according to Nonvide et al. (2017), the high cost of irrigation systems is the main constraint of adoption of irrigation by Beninese farmers. Therefore, the low funding of farmers’ associations does not allow them to promote irrigation. Knowing that access to credit positively influences the decision to farmers to use irrigation to cope with climate change (Deressa et al., 2009), we suggest the establishment of a subsidy and credit mechanism by the government to Beninese rice farmers to boost the rice production.
The use of adapted rice varieties to cope with climate change manifestations by the surveyed farmers is negatively influenced by land ownership. Similar results were obtained by Abid et al. (2015), which observed that land owners compared to tenants are less likely to adapt their farming to cope with climate change. This could be justified by the fact that land tenants are more attentive to their farm income and, therefore, more willing to use climate change adaptation. The localization of rice farmers in the diverse climatic zones has a significant effect on the use of resistant varieties. In fact, the negative effect of the Soudano–Guinean and Guinean zones could be explained by the fact that local rice varieties allowing for a greater resilience are mainly grown in the Soudanian zone (Loko et al., 2021). It is, therefore, important that rice varieties adapted to each climatic zone should be identified and promoted to boost rice production in the Republic of Benin.
There is no surprise that the use of fertilizer positively and significantly influences farmer’s decision to use adapted rice varieties. Indeed, improved rice varieties and fertilizers are promoted together by extension services to boost rice production in rural areas. The positive influence of land size on farmers’ decision to use water management techniques is also not surprising, as some studies showed the positive relationship between land size and water management technology adoption (Fosu-Mensah et al., 2012; Amare and Simane, 2017). However, the negative influence of the access to extension services on farmers’ decision to use water management techniques to cope with climate is surprising, as it is known that access to extensions services increases the probability of farmers to adopt water management techniques such as drip irrigation and digging of new bore-wells (Vijayasarathy and Ashok, 2015). This could probably be explained by the frequency and quality of contacts with extension services. Therefore, it is important that the various stakeholders in agricultural development (non-governmental organizations, government extension services, international institutes and private partners) regularly train Beninese rice farmers on water management techniques to strengthen their resilience to climate change.
4.2 Study implications for rice production in Benin
One of the factors that affect high rice yield in Benin is climate variability. This study documented for the purpose of extension the techniques used by rice farmers in Benin to cope with the effects of climate variability on rice cultivation. It is important to note that these techniques will be improved by scientists before their vulgarization in the field for a better future for rice cultivation. The study showed that it is important to educate rice farmers on the scientific causes of climate change for a better resilience. There is an urgent need to train rice farmers in irrigation and water management techniques to cope with climate variability. To promote irrigation, we suggest the establishment of a subsidy and credit mechanism by the government. Factors identified that influence adoption of efficient adaptation strategies against climate events must be taken into account in any future adaptation policies against climate change in the Republic of Benin.
5. Conclusions
The changes in climate observed by Beninese rice farmers agree with available scientific data. This supports the notion that local perceptions of climatic changes can be used to complement climatic studies based on meteorological records. Our study showed that climate changes are mainly observed through patterns in rainfall variability. Based on the high importance that rainfall has on crop production, especially rice production, we highlight the urgent need to seriously take care of any factors that influence it. The different local strategies recorded through this study can serve as references of all efficient and sustainable actions to be taken for climate resilience. The adoption of adaptation strategies was influenced by the household size, land size, education level and membership to rice farmers’ association, training in rice production, access to extension services, use of improved varieties and the location in climatic zones. However, other factors influenced the adoption of adapted rice varieties, use of irrigation and water management techniques. All these factors must be taken into account in any future adaptation policies against climate change in the Republic of Benin.
The authors would like to thank all the village chiefs, leaders of farmers’ associations and rice farmers, who consented and shared their knowledge in the framework of this study.
Declarations
Funding: This study was funded by the French Institute for Sustainable Development (IRD) through the JEAI-GRAB « Genetic Resources and Agronomic Biodiversity in Benin » grant.
Conflicts of interest: The authors have no conflicts of interest to declare that are relevant to the content of this article.
Availability of data and material: Raw and treated data generated during the study are available from the corresponding author upon reasonable request.
Ethics approval: Not applicable.
Consent to participate: Data were collected under the previous consent of each participant.
Consent for publication: Not applicable.

