


This study aims to address the gap in understanding the determinants of induced abortion rates across Europe by examining the most comprehensive dataset available. It explores economic, sociological, demographic, health, and legislative factors influencing abortion rates over a long period and across a diverse range of European countries.
The research uses empirical analysis of data from developing and developed European countries between 1990 and 2021. The methodology includes empirical analysis of regional and temporal data to identify key trends and influences.
The results show significant correlations between abortion rates and socioeconomic factors. Economic growth and fertility have a negative effect on abortion rates in developed countries, while women’s education and contraceptive use lower abortion rates in developing countries. Divorce rates positively affect abortion rates, while abortion regulatory policies show no effect in either group.
This research is the first to analyze the determinants of abortion rates in Europe using such an extensive, long-term dataset spanning over 3 decades and including both developing and developed countries. By incorporating a wide range of factors—economic, sociological, demographic, health, and legislative—it provides a holistic understanding of the influences on abortion rates. The findings offer novel insights that can guide policymakers and healthcare professionals in designing evidence-based, integrated strategies to address abortion-related challenges.
1. Introduction
Induced abortion remains a controversial and complex issue, deeply influenced by many economic, sociological, demographic, health, and legislative factors. The complexity of induced abortion requires a comprehensive approach to understand its determinants and implications fully. This paper empirically analyses the determinants of induced abortion rates in both developing and developed European countries from 1990 to 2021, offering insights into the various factors that influence abortion rates across diverse contexts. Notably, this study is the first to address this topic in a pan-European context, using the most comprehensive dataset available, covering the highest number of countries over the longest period to date.
Historically, research has shown that economic stability (Sedgh et al., 2015), access to healthcare (Jones et al., 2002), and societal norms (Wilder, 2000) significantly impact abortion decisions. Studies have also explored how economic growth, education, contraceptive use, and legislative policies shape reproductive choices (Abebe et al., 2022; Gil-Lacruz et al., 2012; Hosseini et al., 2017; Jones et al., 2002; Väisänen, 2015; Wang, 2014). Despite the extensive body of research, there is still a gap in understanding these dynamics comprehensively across Europe, where diverse social and legislative landscapes provide a unique context for study.
This paper addresses this gap by conducting an empirical analysis of the determinants of induced abortion rates in both developing and developed European countries from 1990 to 2021. This study leverages the most comprehensive dataset available, encompassing the highest number of countries over the longest period to date. By integrating economic, sociological, demographic, health, and legislative factors, this research aims to provide a complex understanding of the influences on abortion rates across Europe.
The central research question guiding this study is what the primary determinants of induced abortion rates in Europe are and how these factors interact across different contexts and periods. By answering this question, the study seeks to inform policy-making and contribute to more effective reproductive health strategies.
Following this introduction, the paper is structured as follows: the next section provides a theoretical framework, reviewing key economic and social theories related to abortion. It is followed by an empirical analysis section detailing the data and methodology. The results section presents the findings, which are then discussed in the context of existing literature. Finally, the conclusion summarises key insights and suggests policy implications and areas for future research.
In summary, this paper integrates various determinants from economic, sociological, demographic, health, and legislative perspectives to present a comprehensive theoretical model of induced abortion. By synthesising these diverse factors, the model captures the complex interplay of influences driving abortion behaviour. The findings of this study have significant policy implications, emphasising the need for comprehensive strategies that address economic disparities, enhance healthcare access, and consider sociocultural dynamics to manage abortion rates better and improve reproductive health outcomes. This analysis, with its extensive temporal and geographical scope, provides a critical foundation for understanding and addressing induced abortion in Europe.
2. Methods
2.1 Theoretical framework
Induced abortion is a multifaceted issue influenced by a variety of economic, social, demographic, health, and legislative factors. The complexity of induced abortion necessitates a broad approach to fully understand the determinants and implications of abortion behaviour and policies. This literature review explores the current body of research on induced abortion, categorising studies into three major sections: economic factors, sociological and demographic factors, and health and legislative factors. Each section describes specific aspects, providing a comprehensive overview of the factors influencing induced abortion worldwide and preparing a framework for the following empirical model.
2.1.1 Economic and social theories
From an economic perspective, a woman’s individual decision to have an abortion can be related to the basic theoretical framework developed by Becker (1960) and subsequently elaborated by Barro and Becker (1989). In this framework, a woman weighs the costs and benefits of making such a decision.
Becker (1960) employs a unitary approach to family decision-making, treating children as a source of psychological income or satisfaction, thereby considering them a consumption good in economic terms. The “demand for children” is influenced by several factors: tastes, the quality of children, income, and cost. Tastes, which determine the shape of the indifference curves, are influenced by factors such as religion, race, and age, reflecting a family’s relative preference for children. The quality of children involves decisions on expenditures like separate bedrooms, private schooling, and music lessons, where higher spending on one child implies additional utility for the parents. Income also plays a crucial role; an increase in long-term income generally leads to higher spending on children, predominantly enhancing their quality. Barro and Becker (1989) later developed this approach into a dynastic utility function.
This decision-making process also ties into Becker’s (1964) concept of human capital, where investments in education, career, and personal development are crucial. An unplanned pregnancy might be seen as a disruption to these investments, influencing a woman’s choice to prioritise her human capital by opting for an abortion to maintain her educational and career trajectory. Additionally, an unplanned pregnancy may impose unexpected costs that she is not prepared to bear. However, in developed countries, increased availability of contraception and general awareness of family planning may ultimately lead to fewer abortions (Sedgh et al., 2015, 2016).
2.1.1.1 Economic aspects
Fertility behaviour from an economic perspective examines how socioeconomic factors influence reproductive decisions, particularly the choice to have an induced abortion. This section synthesises findings from several studies investigating the economic determinants of abortion rates across different regions and contexts. Economic factors such as income, employment status, and socioeconomic inequality significantly affect fertility decisions and abortion rates. Research in this area highlights the role of financial stability and economic opportunity in shaping reproductive choices. Studies from diverse contexts illustrate how economic hardship and income disparities contribute to variations in abortion rates.
Humphries (1980) highlighted that women’s employment opportunities, labour force participation, and urbanisation significantly influenced abortion rates in the USA during the 1970s. Gil-Lacruz et al. (2012) examined Spain from 1999 to 2004, finding that regional levels of alcohol consumption, living conditions, and public spending on health and education influenced abortion rates. They suggested that public policies should address alcohol abuse, improve working conditions, promote gender equality, and provide subsidised childcare. Ahmed and Ray (2014) analysed India using 2007 district-level data, highlighting the roles of higher education levels, employment status, and access to quality healthcare in influencing abortion decisions. Awareness and knowledge about reproductive health varied based on socioeconomic factors. Llorente-Marrón et al. (2016) found that higher national income levels and increased public health investments were associated with lower abortion rates across 22 European countries from 2001 to 2009. Significant factors included female employment, marital status, migration, and adolescent fertility. Ankara (2017) investigated Turkish women between 2003 and 2008, revealing that age, divorce, and higher age at first marriage influenced abortion rates. Deprived women had lower abortion rates compared to their wealthier counterparts. Over time, income-related inequalities in abortion decreased. Hosseini et al. (2017) analysed data from the 2015 Hamedan Survey in Iran, finding that women’s education levels, contraceptive methods used, and family income were strongly linked to abortion incidence. Higher education and income levels increased the likelihood of reporting an induced abortion.
Overall, it can be said that economic factors such as income, employment, and availability of contraception play critical roles in shaping abortion rates. Understanding the importance of these socioeconomic determinants is essential for better understanding behaviour in this context.
2.1.1.2 Human capital
The human capital theory emphasises the role of individual attributes, such as education and skills, in shaping economic and social outcomes, including fertility behaviour. This section explores how human capital factors, particularly education and socioeconomic status, influence induced abortion rates across different contexts. According to human capital theory, individuals invest in their education and skills to improve their economic prospects. Higher education and career aspirations often influence women’s reproductive choices, making the interplay between education, employment prospects, and access to reproductive healthcare a significant theme in this research.
In Brazil, Misago et al. (1998) conducted a hospital-based study in Fortaleza between 1992 and 1993, revealing that younger, unmarried women with fewer children and previous induced abortions were more likely to terminate pregnancies. The use of misoprostol for illegal abortions mitigated severe complications, highlighting the need for better family planning education and access. Väisänen (2015) examined Finnish women born between 1955 and 1979, finding that those with only an elementary education had a higher likelihood of abortion. This trend grew stronger over time, indicating that socioeconomic differences persisted despite accessible family planning services. The study suggested that education levels significantly impact abortion decisions.
In Chile, Huneeus et al. (2020) used data from the 2015 Chilean National Youth Survey to analyse induced abortions among adolescents and young women. The study found a social gradient in abortion rates, with higher socioeconomic status linked to higher odds of abortion. Despite legal restrictions, women with greater socioeconomic advantages reported more induced abortions, underscoring the importance of addressing educational and economic disparities. Abebe et al. (2022) focused on Southern Ethiopia, studying factors associated with induced abortion in public hospitals. The research highlighted that marital status, education, and contraceptive use significantly influenced abortion rates. Improving access to family planning and comprehensive sexual education was recommended to reduce unsafe abortions.
Moore et al. (2021) provided a global overview of novel approaches to abortion care from 1994 to 2019, emphasising the impact of the COVID-19 pandemic on abortion services. The study noted that telemedicine and other protocols adopted during the pandemic addressed legislative restrictions and ensured access to care. It highlighted the importance of understanding economic factors influencing abortion decisions to address inequalities and improve services.
Thus, factors related to human capital, such as education and socioeconomic status, also influence induced abortion rates, and it is necessary to consider them in the model.
2.1.2 Sociological and demographic theories
2.1.2.1 Social norms and values
The role of societal norms and cultural values in shaping attitudes toward abortion is critical for understanding regional and demographic variations in abortion rates. This section explores how social norms, gender equality, and civil rights influence reproductive choices. Comparative studies from Europe and global analyses highlight that societies with greater gender parity tend to have lower abortion rates, illustrating the impact of gender equality on abortion trends (Dema Moreno et al., 2020). Additionally, the influence of women’s civil rights on the liberalisation of abortion laws is examined, showcasing the socio-political dynamics driving policy changes. Social norms, including cultural, religious, and societal factors, significantly shape fertility behaviour and decisions regarding induced abortion, providing a comprehensive view of how these elements affect abortion rates across different contexts. Wilder (2000) examined abortion trends among Jewish women in Israel between 1974 and 1988. The study found that while factors like education and employment became less influential, shifts in religiosity and contraception use impacted abortion rates. Despite improved contraception, abortion rates remained relatively stable, suggesting that societal attitudes also play a crucial role.
Sastre et al. (2007) explored attitudes towards abortion in France, finding that acceptability was largely influenced by factors such as the adolescent’s age and the fetus’s development. This study highlights how cultural norms shape the societal acceptability of abortion. Additionally, a cross-country analysis by Bankole et al. (1998) found that lack of support and economic concerns were among the significant reasons why women opted for abortion. That suggests that economic factors are a significant driver behind abortion decisions globally. In Nigeria, Konje et al. (1992) highlighted the rising costs and complications of illegal abortions, with a notable increase in sepsis cases. Legalising abortion could significantly reduce treatment costs and complications. Oyefabi et al. (2016) found that Nigerian students had diverse views on abortion, with many supporting legal access and less stigma. This reflects a shift towards more liberal attitudes in some contexts. Ouédraogo and Sundby (2014) showed that in Burkina Faso, personal resources like education and financial autonomy significantly impacted women’s ability to obtain safe abortions, emphasising the effect of socioeconomic inequalities. Pérez et al. (2014) noted that in Spain, younger women and those with lower education levels had higher abortion rates. Regional factors, including public spending and immigration rates, also influenced these trends. Dema Moreno et al. (2020) found that gender equality in Europe correlated with lower abortion rates, demonstrating how gender norms affect reproductive health outcomes.
These studies collectively demonstrate that social norms and values, including cultural attitudes, religious beliefs, and gender dynamics, play a role in influencing induced abortion rates. However, they are often complemented by the economic factors already mentioned.
2.1.2.2 Family structure and dynamics
Family structure and dynamics, including marital status, family size, and living arrangements, play a pivotal role in abortion decisions. This subsection reviews research on how family-related factors influence reproductive choices.
In the United States, Powell-Grine and Trent (1987) observed a rise in abortion rates from 1972 to 1982. The study found that previous childbirths and higher education levels increased the likelihood of abortion. Additionally, unmarried white women had higher abortion rates compared to other groups, suggesting that sociodemographic factors like marital status and race are critical in understanding abortion trends. Fehring (2015) conducted a study on US women, examining the impact of various family planning methods, including contraception, sterilisation, abortion, and natural family planning, on divorce rates. The analysis reveals that women who used natural family planning had a lower divorce rate compared to those who used other methods, such as contraception or abortion. This difference in divorce rates might be attributed to higher religiosity among natural family planning users, as frequent church attendance was also found to reduce the risk of divorce. In India, Bose and Trent (2006) noted that despite national family planning efforts, abortion remains widespread, particularly in rural areas. The preference for sons and regional differences significantly affect abortion practices, with northern states exhibiting higher abortion rates linked to sex-selective practices. The study highlights the need for more nuanced research on gender norms and their impact on abortion. Kant et al. (2015) also focused on rural northern India, finding that while the overall abortion rate was low, induced abortions were notably high among certain socioeconomic and caste groups. Unsafe practices and sex-selective abortions, though illegal, were prevalent. That underscores the need for improved access to safe abortion services and better enforcement of existing laws. In Denmark, Rasch et al. (2008) found that the single status, being under 19, and having multiple children were strong predictors of abortion. Immigrant women, who faced poorer socioeconomic conditions, were particularly vulnerable.
Thus, family structure and regional dynamics, along with socioeconomic factors, also shape abortion patterns.
2.1.3 Health and legislative factors
2.1.3.1 Access to healthcare
Access to quality healthcare, particularly reproductive health services, is a fundamental determinant of abortion rates and outcomes. This subsection explores how healthcare availability, affordability, and quality impact abortion decisions and the safety of abortion procedures. There is an economic burden of unsafe abortions on health systems.
In the United States, Borders and Cutright (1979) found that the number of abortion facilities is the most decisive factor influencing abortion rates in US metropolitan areas. An increase in facilities from 1973 to 1975 led to higher abortion rates. Other factors included rural residence, population density, and socioeconomic variables like the proportion of Catholics and public assistance levels. Jones et al. (2002), also in the US, revealed that nearly half of the women seeking abortions had not used contraception due to perceived low risk or concerns. The availability of alternative contraception was crucial in reducing abortion rates. Ahmed et al. (1998) observed trends in Bangladesh between 1982 and 1991, finding that women with more than six births or shorter intervals between pregnancies were more likely to undergo abortions. Contraceptive methods like the pill and condoms were associated with higher abortion rates compared to injectable contraceptives. Inconsistent use of condoms and pills was a significant reason for unintended pregnancies. Increased use of emergency contraceptive pills could further reduce abortions.
In Mexico, Levin et al. (2009) found that improving access to safe abortion services could lower costs and reduce complications. Shifting to outpatient procedures like manual vacuum aspiration and medication abortion demonstrated cost-effectiveness and better outcomes.
In Ethiopia, Bonnen et al. (2014) found that second-trimester abortions were more common among younger, single, unemployed women with low education. Contraceptive use was notably low among young women, highlighting a need for better access to contraception. As for Europe, Leppälahti et al. (2016) investigated underage abortions in Finland and found that socioeconomic differences played a minor role compared to factors like substance abuse and maternal health history. The study emphasised the importance of addressing mental health and substance abuse issues to prevent underage pregnancies. Lattof et al. (2020) reviewed the economic impact of abortion services worldwide and found significant cost variation across health systems. They noted that financial savings were possible without sacrificing quality and stressed the need for more research, especially in low- and middle-income countries.
Therefore, a critical role of healthcare access in managing abortion rates and outcomes has been observed. Expanding and improving access to safe abortion services can reduce complications, lower costs, and ultimately improve health outcomes for women.
2.1.3.2 Legislation and regulation
The legal and regulatory environment surrounding abortion is a critical factor influencing abortion rates and practices. This subsection examines how different legislative frameworks, from restrictive to liberal, impact the incidence and safety of abortions. Research from China, the US, worldwide trends, and other specific country case studies illustrates the effects of legislative changes on abortion rates and access to services.
Frejka (1983) explored abortion trends in Eastern Europe between 1950 and 1980. Liberal abortion laws increased abortion rates, but the effect on fertility was less pronounced compared to contraception. Although liberal policies facilitated fertility declines, they occasionally led to temporary fertility increases. In the US, Blank et al. (1996) analysed state abortion rates from 1974 to 1988, finding that restrictions on Medicaid funding led to lower in-state abortion rates but higher rates in neighbouring states. That indicated significant impacts of funding restrictions on abortion access, particularly for low-income women. In China, there is a strict limit to the number of children a family can have, although that has changed over time. Ping and Smith (1995) examined the two-child policy’s impact and found that induced abortion rates were highest among women with one child. The policy, which included late childbearing and spacing requirements, introduced unexpected social costs and highlighted variations in abortion rates at local levels. Wang (2014) evaluated the effects of China’s one-child policy from 1979 to 2010. Initially, the policy led to increased induced abortions. After 1994, the shift to a more client-centred approach resulted in reduced abortion rates, particularly among married women. Regional and individual factors also influenced abortion likelihood, with relaxed policies leading to fewer abortions. Qiao and Suchindran (2001) focused on the 1990s, noting that induced abortions were often used to control the sex of the fetus rather than for family planning. Effective contraception kept rates relatively low, though sex-selective abortions were common. Sedgh et al. (2012) reported that more liberal abortion laws were associated with lower abortion rates. Global abortion rates were stable from 2003 to 2008, but unsafe abortions increased. In 2008, 49% of abortions were unsafe, with higher abortion rates in Eastern Europe compared to Western Europe.
Overall, these studies demonstrate how varying legislation and regulations can profoundly affect abortion rates and practices across different regions and periods.
The theoretical model of induced abortion integrates multiple determinants from economic, sociological, demographic, health, and legislative perspectives. Economic factors such as income, employment, and human capital investments significantly influence abortion decisions, reflecting the costs and benefits weighed by women. Sociological elements, including social norms, cultural values, and family structure, shape attitudes and behaviours towards abortion, while demographic aspects like age, marital status, and education further contextualise these choices. Access to healthcare plays a pivotal role, as availability, affordability, and quality of reproductive health services impact both the incidence and safety of abortions. Legislative and regulatory environments, ranging from restrictive to liberal frameworks, also critically determine abortion rates and practices. By synthesising these diverse factors, the model captures the complex interplay of influences driving abortion behaviour, emphasising the importance of comprehensive policies that address economic disparities, enhance healthcare access, and consider sociocultural dynamics.
2.2 Empirical framework
Inspired by previous literature (Ahmed and Ray, 2014; Blank et al., 1996) and according to the nature of the data, the models employ an OLS fixed effects regression. The Hausman test results indicate that fixed effects are preferred over random effects (p < 0.05). The estimation equation is formulated as follows:
where represents the dependent variable for country i in the year t, is a vector of explanatory variables, is a vector of coefficients for the explanatory variables, are the country dummies to factor in the time-invariant characteristics of a country, are the year dummies to control year-specific factors that affect all countries equally, and is the error term.
All models consider autocorrelation and heteroskedasticity in residuals by utilising country-level clusters, enabling the correlation of standard deviations within a country over time but precluding such correlations across different countries.
The dependents variable for all models is Abortions, capturing the abortion rate (number of induced abortions per 1,000 live births). The choice of control variables depends on the theoretical framework. There are three groups – economic, sociological, and legislative factors.
Economics factors include GDP, Unemployment, GINI, and Labor_women. The GDP is the real gross domestic product per capita in PPP, which denotes a proxy variable related to changes in the wealth and income for each country. The Unemployment rate captures the current situation affecting the population. The Gini is the Gini coefficient measuring income inequality within a population. It quantifies how evenly income is distributed across a society.
Sociological factors include Divorce, Women_enrollment, Fertility, Liberties_index, Nonreligious, Contraceptive, HIV, and Alcohol. Divorce is the divorce rate and captures the number of divorces occurring in one year per 1,000 inhabitants. Women_enrollment captures the ratio of total tertiary education enrolment, regardless of age, to the population of the age group that officially corresponds to tertiary education. Fertility is the total fertility rate, which represents the number of children that would be born to a woman if she were to live to the end of her childbearing years and bear children following the age-specific fertility rates of the specified year. Liberties_index links to the Women’s Civil Liberties Index, which captures the extent to which women are free from forced labour, have property rights and access to the justice system, and enjoy freedom of movement. Nonreligious captures the ratio of individuals who do not identify with, belong to, or practice any organised religion or religious denomination. These individuals may consider themselves secular, atheist, agnostic, or spiritual but not be religious or aligned with any specific religious tradition. They do not participate in the rituals, doctrines, or membership of religious organisations. Contraceptive captures the prevalence of any modern method of contraception for married women ages 15–49 who are practising or whose sexual partners are practising at least one modern method of contraception. Modern methods of contraception include female and male sterilisation, oral hormonal pills, the intra-uterine device (IUD), the male condom, injectables, the implant (including Norplant), vaginal barrier methods, the female condom, and emergency contraception. Women who use contraception are less likely to experience unwanted or unplanned pregnancies compared to those who do not. Consequently, women who use contraceptives should be less likely to seek an abortion. Because information on the costs of STIs or unwanted pregnancy is unavailable, we use the country’s HIV prevalence per 1,000 uninfected inhabitants. Finally, we included the variable Alcohol, which captures pure alcohol consumption per capita in the 15+ age category.
Further, to capture the influence of national legislation on abortion, we classified each country into one of five categories based on their legal policy regarding abortion. POLICY_1 allows abortion at a woman’s request until a certain point in the pregnancy. POLICY_2 allows abortion for medical or socioeconomic reasons. POLICY_3 allows abortion only for medical reasons and in the case of rape or incest. POLICY_4 allows abortion only to save the mother’s life. POLICY_5 means no legal abortion at all. These variables are dichotomous, POLICY_1 being the reference category.
2.3 Data
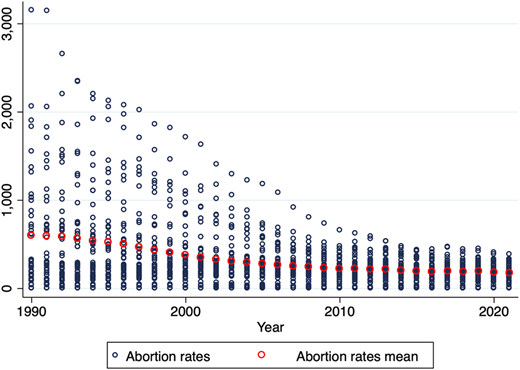
The study analyses the determinants of abortions. From Figure 1, it can be observed that the trend of abortion rates in Europe has been downward over time. In 1990, the average abortion rate was 605. This figure was mainly driven by post-Soviet countries, such as Romania (3,153 = 3.15 abortions per 1 live birth), where abortion was legal. In 2021, the average abortion rate was 173.
The abortion rate data comes from Eurostat, and the economic indicators (GDP, Unemployment, Gini, Labor_women) come from the World Bank database (WB). The non-economic indicators come from the World Bank database as well (Divorce, Women_enrollment, Fertility, Contraceptive and HIV), The Varieties of Democracy project (V-Dem) (Liberties_index), and the Pew Research Center (Nonreligious), and Alcohol comes from the World Health Organisation (WHO). Furthermore, we collect data on national legislation on abortion (Policy_2, Policy_3, Policy_4 and Policy_5) from the United Nations (UN).
The studied period is based on the availability of data from each source. There are 32 years of observations for each country. Therefore, the period begins in 1990 and ends in 2021. For clarity, the variables that affect the following models directly are recapitulated in Table 1.
Overview of the used variables
| Variable name | Description | Category |
|---|---|---|
| Abortions | Number of induced abortions per 1,000 live births | Dependent |
| GDP | Gross domestic product per capita at constant prices (reference year 2017 for PPP, in USD) | Economic |
| Unemployment | Unemployment rate (%) | Economic |
| Gini | Gini coefficient (0 = perfect equality, 100 = maximal inequality) | Economic |
| Labor_Women | Share of women in the labour market (%) | Economic |
| Divorce | Divorce rate per 1,000 inhabitants | Sociological |
| Women Enrollment | Gross enrollment ratio (%) | Sociological |
| Fertility | Number of children per woman | Sociological |
| Liberties_ndex | Women civil liberties index (0 = no rights, 1 = full rights) | Sociological |
| Nonreligious | Percentage of individuals with no affiliation to organised religion | Sociological |
| Contraceptive | Contraceptive use rate among individuals aged 15–49 (%) | Sociological |
| HIV | Incidence of HIV per 1,000 people | Sociological |
| Alcohol | Pure alcohol consumption in litres per capita (age 15+) | Sociological |
| Policy_1 | Abortion is legal (0 = false, 1 = true) | Legislation |
| Policy_2 | Abortion is illegal except with reasons (0 = false, 1 = true) | Legislation |
| Policy_3 | Abortion is illegal except for medical reasons (0 = false, 1 = true) | Legislation |
| Policy_4 | Abortion is illegal except for endangering a woman’s life (0 = false, 1 = true) | Legislation |
| Policy_5 | Abortion is illegal (0 = false, 1 = true) | Legislation |
Source(s): Authors’ own elaboration
Descriptive statistics for all years and countries are presented in Table 2.
Descriptive statistics
| Variable | Mean | Standard deviation | Min | Max | Source |
|---|---|---|---|---|---|
| Abortions | 329.0 | 385.5 | 0 | 3152.6 | Eurostat |
| GDP | 30751.3 | 19848.2 | 1730.1 | 120647.8 | WB |
| Unemployment | 9.8 | 6.4 | 0.1 | 38.8 | WB |
| Divorce | 1.9 | 1.0 | 0 | 5.6 | WB |
| Women_enrollment | 56.6 | 27.3 | 4.3 | 156.1 | WB |
| Fertility | 1.6 | 0.3 | 1.1 | 3.1 | WB |
| Gini | 32.4 | 5.0 | 20.7 | 44.4 | WB |
| Liberties_index | 0.9 | 0.1 | 0.0 | 1.0 | V-Dem |
| Labor_women | 51.0 | 10.2 | 18.7 | 85.5 | WB |
| Nonreligious | 14.9 | 15.7 | 0.1 | 64.3 | Pew Research Center |
| Contraceptive | 49.3 | 20.0 | 3.7 | 82.0 | WB |
| HIV | 0.1 | 0.1 | 0 | 1.0 | WB |
| Alcohol | 9.3 | 3.4 | 0.4 | 17.9 | WHO |
| Policy_1 | 0.77 | 0.42 | 0 | 1 | UN |
| Policy_2 | 0.1 | 0.3 | 0 | 1 | UN |
| Policy_3 | 0.1 | 0.3 | 0 | 1 | UN |
| Policy_4 | 0.1 | 0.2 | 0 | 1 | UN |
| Policy_5 | 0.0 | 0.0 | 0 | 1 | UN |
Source(s): Eurostat, WB, V-Dem, Pew Research Center, WHO, UN
3. Results
The empirical analysis reveals key determinants of induced abortion rates across Europe. The Table 3 presents the fixed-effects regression estimates for the pooled sample of countries, progressively incorporating economic, sociological, and legislative variables.
Results – all countries
| Variables | FE (1) | FE (2) | FE (3) |
|---|---|---|---|
| GDP | −464.1*** | −197.8** | −200.8** |
| (123.2) | (95.3) | (95.4) | |
| Unemployment | −1.6 | 0.8 | −1.2 |
| (4.2) | (4.2) | (4.3) | |
| Gini | 384.2 | 206.5 | 189.1 |
| (363.7) | (335.1) | (341.5) | |
| Labor_women | 9.5* | 5.3* | 5.5* |
| (4.8) | (3.0) | (3.0) | |
| Divorce | – | 113.8*** | 118.6*** |
| (41.1) | (41.0) | ||
| Women_enrollment | – | −2.9** | −2.9** |
| (1.3) | (0.6) | ||
| Fertility | – | −278.9*** | −277.9*** |
| (103.3) | (101.5) | ||
| Liberties_index | – | −53.8 | −49.3 |
| (72.1) | (73.1) | ||
| Nonreligious | – | 7.3** | 7.5** |
| (3.4) | (3.5) | ||
| Contraceptive | – | −9.1 | −9.2 |
| (5.7) | (5.7) | ||
| HIV | – | −68.5* | −68.1* |
| (39.6) | (40.3) | ||
| Alcohol | – | −0.2 | −4.6 |
| (84.2) | (82.4) | ||
| Policy_2 | – | – | −67.2 |
| (58.7) | |||
| Policy_3 | – | – | 16.9 |
| (51.6) | |||
| Policy_4 | – | – | −23.0 |
| (85.7) | |||
| Policy_5 | – | – | −115.7 |
| (145.0) | |||
| constant | 3200.6** | 1830.9 | 1919.4 |
| (1429.8) | (1297.5) | (1312.4) | |
| Country dummies | ✓ | ✓ | ✓ |
| Year dummies | ✓ | ✓ | ✓ |
| Observation | 1,354 | 1,354 | 1,354 |
| R2 – within | 0.29 | 0.47 | 0.47 |
Note(s): Standard errors (in parentheses) are clustered at the country level, ***p < 0.01, **p < 0.05, *p < 0.1
Source(s): Eurostat, WB, V-Dem, Pew Research Center, WHO, UN, Authors’ calculations
Across all model specifications, economic growth (GDP) is a robust and statistically significant determinant, exhibiting a negative association with abortion rates. This suggests that as countries experience economic development, the incidence of induced abortions tends to decline. Among sociological variables, the fertility rate shows a consistently negative and statistically significant effect, indicating that higher fertility contexts are associated with lower abortion rates. In contrast, divorce rates and the proportion of non-religious individuals are positively associated with abortion rates, possibly reflecting more liberal social attitudes and family structures conducive to higher abortion prevalence. Other factors such as unemployment, income inequality (Gini), and alcohol consumption were not statistically significant in the full sample. Importantly, legislative variables—capturing differing levels of abortion restriction—also failed to reach statistical significance, likely due to limited variation in legal frameworks across European countries, where abortion access is generally liberalised.
In previous research (Sedgh et al., 2015), the abortion rates often behaved differently in developing and developed countries. This trend is visually supported by Figure 2, which compares abortion rates and GDP per capita across European countries in 1990 and 2021. While both OECD and non-OECD countries experienced substantial reductions in abortion rates over this period, the level of decline varies. In 1990, non-OECD countries exhibited an average abortion rate of 1,015 per 1,000 live births, compared to 341 in OECD countries. By 2021, these rates fell to 189 and 164 respectively. This convergence illustrates not only a general reduction in abortion rates, but also a narrowing developmental divide. These patterns support the broader empirical finding that economic development, along with increased access to reproductive healthcare and education, contributes to lower abortion incidence. Given these structural differences, the analysis proceeds by disaggregating countries into two groups based on OECD membership. The list of OECD and non-OECD countries is shown in Appendix (Table A1).
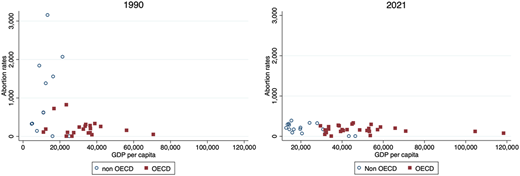
Abortion rates and GDP per capita in 1990 and 2021. Source: Eurostat and World Bank
Abortion rates and GDP per capita in 1990 and 2021. Source: Eurostat and World Bank
The regression results for each group are reported in Table 4. In OECD countries, GDP continues to demonstrate a significant negative effect, while female labor force participation (Labor_women) is positively associated with abortion rates—possibly reflecting increased opportunity costs of childbearing. Notable, unemployment is negatively related to abortion rates, which may reflect both limited access to services during economic hardship and shifts in personal decision-making under financial constraints.
Results – OECD and non-OECD
| Variables | FE (1) | FE (2) | FE (3) | |||
|---|---|---|---|---|---|---|
| OECD | Non-OECD | OECD | Non-OECD | OECD | Non-OECD | |
| dependent variable: abortions | ||||||
| GDP | −364.0*** | −502.2** | −482.7*** | −105.0 | −483.8*** | −105.2 |
| (110.5) | (187.1) | (121.9) | (92.3) | (122.4) | (95.2) | |
| Unemployment | 0.6 | −1.9 | −6.7** | −0.9 | −6.6** | −0.9 |
| (2.7) | (7.4) | (2.9) | (5.8) | (2.7) | (6.0) | |
| Gini | −88.3 | 688.9 | −222.0 | 134.6 | −203.0 | 80.5 |
| (298.5) | (579.7) | (220.7) | (281.7) | (227.0) | (288.5) | |
| Labor_women | 7.0* | 11.8 | 6.2** | 7.2** | 6.1* | 6.8** |
| (3.7) | (7.3) | (3.0) | (3.2) | (3.1) | (3.2) | |
| Divorce | – | – | 59.0** | 227.9*** | 58.4** | 234.6*** |
| (27.9) | (73.9) | (28.4) | (75.1) | |||
| Women_enrollment | – | – | 1.1* | −12.4*** | 1.1* | −12.6*** |
| (0.6) | (2.2) | (0.6) | (2.0) | |||
| Fertility | – | – | −197.7** | −313.3** | −196.1** | −313.1** |
| (78.5) | (110.5) | (0.6) | (111.2) | |||
| Liberties_index | – | – | −219.4 | −3.2 | −220.1 | −10.4 |
| (152.9) | (61.5) | (154.2) | (65.5) | |||
| Nonreligious | – | – | 1.8 | 3.6 | 1.69 | 4.0 |
| (2.7) | (3.7) | (2.7) | (3.9) | |||
| Contraceptive | – | – | −1.2 | −16.6** | −1.1 | −16.5** |
| (1.6) | (6.1) | (1.5) | (6.0) | |||
| HIV | – | – | −28.1 | −78.0* | −27.9* | −73.9** |
| (14.1) | (40.3) | (14.4) | (42.8) | |||
| Alcohol | – | – | −106.5 | 107.8 | −104.8 | 93.6 |
| (78.2) | (77.4) | (77.4) | (77.1) | |||
| Policy_2 | – | – | – | – | 36.1 | −139.1 |
| (62.5) | (146.4) | |||||
| Policy_3 | – | – | – | – | 16.68 | −88.9 |
| (29.7) | (124.9) | |||||
| Policy_4 | – | – | – | – | −19.9 | – |
| (74.7) | ||||||
| Policy_5 | – | – | – | – | 88.4 | – |
| (80.2) | ||||||
| constant | 3979.2*** | 2225.2 | 6099.0*** | 1394.3* | 6033.5*** | 1640.3* |
| (1123.5) | (2405.0) | (1448.8) | (793.6) | (1457.8) | (836.1) | |
| Country dummies | ✓ | ✓ | ✓ | ✓ | ✓ | ✓ |
| Year dummies | ✓ | ✓ | ✓ | ✓ | ✓ | ✓ |
| Observation | 837 | 517 | 837 | 517 | 837 | 517 |
| R2 – within | 0.40 | 0.29 | 0.58 | 0.67 | 0.58 | 0.67 |
Note(s): Standard errors (in parentheses) are clustered at the country level, ***p < 0.01, **p < 0.05, *p < 0.1
Source(s): Eurostat, WB, V-Dem, Pew Research Center, WHO, UN, Authors’ calculations
In contrast, in non-OECD countries, the most salient factors are women’s education (Women_enrollment) and contraceptive use (Contraceptive), both of which are significantly associated with reduced abortion rates. These findings underscore the critical role of educational attainment and access to modern reproductive health services in lowering the incidence of abortion in developing contexts. Other variables, including legislative restrictions and civil liberties indicators, remain statistically insignificant across both groups.
Overall, the results highlight the importance of economic and social development in shaping reproductive outcomes and affirm the relevance of tailoring policy responses to country-specific conditions.
4. Discussion and conclusion
While several cross-sectional studies have examined the determinants of abortion rates, this study analyses economic, sociological and legislative factors across all European countries. Our results reveal that although European countries have differing abortion regulations, these legislative differences do not fully explain the variation in induced abortion rates. Instead, variation is primarily driven by socioeconomic factors and the individual characteristics of women.
Higher GDP per capita is associated with lower abortion rate. This aligns with earlier findings that abortion rates tend to be higher in developing countries compared to developed ones (Sedgh et al., 2015, 2016). These differences can be attributed to disparities in access to healthcare, education, abortion legislation, and cultural norms. Interestingly, in OECD countries, the GDP did not have a statistically significant effect on the abortion rate, while in non-OECD countries, it showed a significant negative effect on abortion rates.
Unemployment also had a significant negative impact on the abortion rate in OECD countries. This may reflect financial barriers to accessing abortion services or psychological and social dynamics. During economic uncertainty, individuals may prioritise family stability and view children as a source of meaning and security (Ahmed and Ray, 2014). The Gini coefficient showed no significant relationship, possibly due to limited variation across European countries. Conversely, female labor force participation rate had a positive and significant effect, potentially reflecting increased time and career pressures on women.
The fertility rate was negatively associated with abortion rate, potentially due to cultural and religious factors (Wilder, 2000). In less developed countries higher fertility may be related to limited access to contraception or view of children as economic benefit, especially in agricultural economies (Bhalotra and Heady, 2003). The divorce rate showed positive and significant relationship with abortions. Following divorce, women may face financial and emotional challenges, which could increase the likelihood of abortion in the case of an unintended pregnancy (Fehring, 2015; Santos et al., 2016). In developing countries, women’s education level emerged as the most significant determinant. Previous research has shown that higher education reduces abortion rate by improving contraceptive use and enabling women to better plan their families (Abebe et al., 2022; Ahmed and Ray, 2014; Gil-Lacruz et al., 2012; Hosseini et al., 2017; Misago et al., 1998; Väisänen, 2015). Relatedly, greater use of contraception generally reduces the abortion rate. Other variables, such as The Index of Women’s Freedoms, religion, and alcohol consumption, were not statistically significant, likely due to low variability across countries.
The model included HIV prevalence as a proxy for the costs of sex and found a negative effect on the abortion rate, particularly in developing countries. This may reflect stronger healthcare infrastructure in regions with higher HIV prevalence, including improved access to contraception and reproductive counselling (Jones et al., 2002). Legislative variables related to abortion laws were not statistically significant, perhaps due to the overall liberal stance on abortion in most European countries.
The findings confirm that the determinants of abortion rates vary between developed and developing countries, which has important implications for reproductive policies. In countries with higher abortion rates—particularly developing ones—improving education and access to contraception can be effective strategies to reduce unintended pregnancies. Additionally, in both developing and developed countries, policies aimed at increasing fertility (e.g. family support measures) may indirectly reduce abortion rates.
However, generalising these conclusions has limitations. The analysis was based on data from a specific period and limited to European countries. Incomplete or missing data for some of the 44 countries may have also affected results.
Ultimately, the rate of induced abortions is influenced by a wide range of interconnected economic, social, cultural, health, and legal factors. Key predictors include the divorce rate, fertility rate, education level, labor market participation, and prevalence of sexually transmitted infections. For effective policy-making, it is crucial to approach these determinants holistically – focusing on improving education, access to healthcare, economic stability and social and emotional support for women.
We would like to express our sincere gratitude to the anonymous reviewers for their valuable feedback and constructive comments, which greatly contributed to improving this work.
Appendix
Abortion regulations in the European countries in 2021
| Country | Category | Country | Category | Country | Category |
|---|---|---|---|---|---|
| Albania | Non OECD | Georgia | Non OECD | Norway | OECD |
| Armenia | Non OECD | Germany | OECD | Poland | OECD |
| Austria | OECD | Greece | OECD | Portugal | OECD |
| Azerbaijan | Non OECD | Hungary | OECD | Romania | Non OECD |
| Belarus | Non OECD | Iceland | OECD | Russia | Non OECD |
| Belgium | OECD | Ireland | OECD | Serbia | Non OECD |
| Bosnia and Herzegovina | Non OECD | Italy | OECD | Slovakia | OECD |
| Bulgaria | Non OECD | Latvia | OECD | Slovenia | OECD |
| Croatia | Non OECD | Lithuania | OECD | Spain | OECD |
| Cyprus | Non OECD | Luxembourg | OECD | Sweden | OECD |
| Czechia | OECD | Malta | Non OECD | Switzerland | OECD |
| Denmark | OECD | Moldova | Non OECD | Turkey | OECD |
| Estonia | OECD | Montenegro | Non OECD | Ukraine | Non OECD |
| Finland | OECD | Netherlands | OECD | United Kingdom | OECD |
| France | OECD | North Macedonia | Non OECD |
Source(s): OECD

