


This research investigates how manufacturing processes integrated with reverse logistics (RL) practices could improve sustainability performance (SP) through a strategic framework of prioritised RL practices.
This research adopted a single case study approach. A conceptual framework was developed using a comprehensive literature review. The framework's three phases were demonstrated through a mixed methods approach using an RL case study.
Recycling as the highest-ranked RL practice suggests that several SP measures, including reduced use of raw materials, energy consumption and water consumption, contribute to both economic benefits and environmental conditions. While recycling of materials strongly contributes to economic and environmental performance, the adoption of advanced technology emerges as a critical factor driving the social dimension.
The proposed framework advances theory by prioritising RL practices with manufacturing to improve SP. It extends existing conceptualisations of RL from process-level considerations to a more strategic, technology-enabled perspective. The research is based on a single industry case, which limits the generalisability of the findings.
The empirical validation of the proposed framework for improving SP measures, aligned with prioritised RL practices, offers researchers, managers and policymakers valuable insights and guidance.
This study proposes a strategic framework designed to guide manufacturing firms in developing roadmaps for integrating manufacturing with RL practices towards performance improvement, drawing on expert insights. The study's main contribution is identifying key sustainability measures aligned with RL practices in manufacturing, while offering an industry-specific framework for implementing RL in energy-intensive sectors.
1. Introduction
Sustainable supply chain management covers a full life cycle from design/concept to reverse logistics (RL). In this context, five broader sustainable supply chain management (SCM) practices are identified as (1) sustainable design, (2) sustainable procurement/purchasing, (3) sustainable manufacturing (SM), (4) sustainable distribution and (5) RL/supply chains. From a manufacturing perspective, all these practices are interrelated. Depending on the type of manufacturing, manufacturing firms can focus on different areas of sustainable supply chain management (SSCM) practices and prioritise those accordingly (Limon-Romero et al., 2025). Recently, Oubrahim and Sefiani (2025) delineated a comprehensive set of SSC performance criteria for manufacturing, highlighting priority criteria within each TBL dimension and mapping the causal relationships among them, identified with short-term and long-term sustainability outcomes.
Among several elements of the life cycle thinking, SM plays a critical and central role. SM encapsulates a balanced approach to meeting economic objectives, environmental conditions and social factors from the perspectives of specific dimensions in the manufacturing industry sector. SM covers the three integral elements of products, processes and systems that enable sustainable value creation and economic growth (Enyoghasi and Badurdeen, 2021). Similarly, knowledge of the relationships between Industry 4.0 (I4.0) and the three dimensions of sustainability is valuable for effectively adopting I4.0 technologies to achieve SM (De Alwis et al., 2024). The adoption of I4.0 technologies has transformed traditional products, processes and systems to a higher level, including products with digital features, processes supported by I4 technologies and systems connected/updated with real-time data for big data analytics (Enyoghasi and Badurdeen, 2021; Samaranayake et al., 2024).
RL, closely connected with SM, has attracted many manufacturing sectors to adopt several strategies/practices such as reuse, refurbishment, recycling and re-manufacturing. RL is considered a central part of overall SSCM as it not only supports the circular economy (CE) concept but also supports manufacturing with several RL strategies/practices. These strategies also form part of the 6R processes (reduce, redesign, reuse, recover, remanufacture and recycle) (Jayal et al., 2010). Manufacturing organisations have been adopting these strategies in many combinations, depending on the scope and type of industry. Asamoah et al. (2024) show that manufacturing firms, such as those in the beverage sector, implement RL in ways that directly enhance environmental performance, emphasising the sustainability benefits achievable through different RL configurations across industry contexts.
Apart from the close association between RL practices and SM, the importance of integration of RL practices with advanced technologies for sustainability performance (SP) is emphasised in recent times. For example, the effect of RL on green firm reputation is fully mediated, suggesting RL alone is insufficient for holistic sustainability gains (Asamoah et al., 2024). According to Kalubanga and Mbekeka (2023), RL outcomes are context-dependent and structurally constrained, particularly when not strategically embedded within manufacturing systems. Similarly, RL improves SP only when complemented by organisational learning capability (Yang et al., 2024). Furthermore, evidence from manufacturing firms indicates that RL contributes more effectively to SP when it is integrated with manufacturing and supply chain operations and supported by I4.0-enabled practices (Sun et al., 2022; de Oliveira Neto et al., 2025).
However, existing studies are often limited to either specific industries/or examine SP performance improvement through a narrow set of SP measures (e.g. cost of recycling, waste reduction, etc.) (de Oliveira Neto et al., 2025). In addition, they frequently lack integration of RL practices with advanced technologies, which is necessary to achieve a balanced and enhanced SP (Sun et al., 2022). By focusing on the integration of manufacturing and RL practices in large manufacturing firms, this study extends current research by examining how digitally enabled integration mechanisms contribute to improved SP.
Furthermore, extant studies remain fragmented, as they are often confined to specific industries and assess sustainability outcomes using a limited or unbalanced set of measures (e.g. environmental indicators without corresponding cost or waste-reduction performance) (Salah et al., 2026). More critically, prior research largely overlooks the integration of RL practices with advanced digital technologies, thereby failing to explain how such integration can deliver balanced and enhanced SP (Sun et al., 2022). To address these research gaps, this research proposes a conceptual framework for SM, with a particular focus on RL practices, and empirically illustrates the framework using secondary data from a selected manufacturing case organisation. Empirical validation of the case scenario is carried out to assess the current level of RL and develop a holistic approach for identifying priorities and interdependencies of those measures for improving current practices. Thus, the key research questions of this research are:
What are the priority areas of reverse logistics in the selected industry?
What are the economic, environmental and social factors of different areas of reverse logistics applicable to the selected manufacturing sector?
What are the priorities of selected areas of reverse logistics practices for improving overall SP?
This study makes an academic contribution to the RL and sustainability literature by providing empirical evidence on how digitally enabled integration between manufacturing and RL practices in large manufacturing firms enhances SP. It further makes a theoretical contribution by identifying the relative priorities and strategic roles of key RL areas in driving economic, environmental, and social performance within a manufacturing context.
The remainder of the article is structured as follows. Section 2 presents the research background, followed by the research methodology. Section 4 introduces the conceptual framework of SM with RL, which is then illustrated and empirically validated. The research findings and their discussion are presented in sections 6 and 7, respectively. Finally, Section 8 concludes the article, outlining practical implications and future research directions.
2. Literature review
SM practices seek to meet requirements and enhance performance across three core dimensions: economic benefits, environmental conditions and social responsibility. Several studies in different industry contexts have reported on respective SM practices, including the impact of SM practices on overall SP (Abdul-Rashid et al., 2017), implementation of SM practices using sustainable product design, lean-agile practices and barriers in I4.0-enabled SM in the Sri Lankan manufacturing sector (De Alwis et al., 2024). In addition, other studies have focused on specific industries, including a framework of composite SM and performance in auto-part manufacturing in China (Wang et al., 2015) and drivers to SM from a perspective of leather industries in Bangladesh (Moktadir et al., 2018).
The implementation of SM practices is very broad and can be considered from four broader categories, including (1) sustainable product design and development, (2) SM process, (3) sustainable SCM and (4) sustainable end-of-life management (Abdul-Rashid et al., 2017). End-of-life management is closely connected with RL practices associated with the manufacturing sector. Key areas of development in the RL as part of SM include frameworks, strategies and performance measurement. Recently, Prajapati et al. (2023) proposed an approach for the selection of a strategy for RL implementation from an Indian manufacturing sector perspective. Similarly, a few other studies have focused on using the 9R strategy framework for improving RL practices, using different combinations of R practices (Enyoghasi and Badurdeen, 2021; Kuik et al., 2017; Kirchherr et al., 2017). Furthermore, SM is effectively supported by implementing the 6 Rs, which focus on recovering end-of-life products to establish a closed-loop system. This approach aligns closely with RL practices and considers the entire lifecycle of material and resource flows (Enyoghasi and Badurdeen, 2021). Several studies have examined SP from a strategic resource and innovation perspective of performance-based budgeting on SP and technological innovation (Alhasnawi et al., 2025) and emphasised the critical role of roadmaps and evaluation criteria for SP implementation (Oubrahim and Sefiani, 2025)
While frameworks, strategies, and performance measurement systems are essential for planning SM implementation, industry-specific roadmaps play a critical role in translating these approaches into actionable and context-relevant implementation plans. Several studies have proposed frameworks and models to enhance understanding of these practices and to support the development of roadmaps tailored to specific industry sectors. Some studies have extended conceptual frameworks emphasising the implementation of SM practices/CE principles towards SP, including circular business models for mining companies to upgrade and move to a new level of technological sophistication (Marinina et al., 2022), waste reduction and performance measurement approach as critical factors underpinning SSCM practices and performance (Mahroof et al., 2022), and RL implementation using strategy selection (Prajapati et al., 2023). Recently, Gupta et al. (2025) identified government initiatives and social sustainability considerations as the most critical factors to adopt R-based sustainable practices in the textile industry. However, existing studies largely examine RL practices in isolation, provide limited integration with manufacturing activities and fail to systematically link these practices to overall SP, resulting in a fragmented understanding of how RL can holistically enhance organisational sustainability.
Recent studies highlight the growing role of RL in supporting SP in manufacturing. Asamoah et al. (2024) show that while RL practices enhance environmental performance, their contribution to broader sustainability outcomes remains indirect and dependent on complementary organisational mechanisms. Kalubanga and Mbekeka (2023) similarly find that RL influences environmental performance mainly through mediating factors such as regulatory compliance, underscoring its context-dependent role. Moving beyond operational perspectives, Sun et al. (2022) argue that traditional RL approaches are insufficient to deliver systemic sustainability gains without integration with I4.0-enabled manufacturing systems. Supporting this view empirically, de Oliveira Neto et al. (2025) demonstrate that digitally integrated RL systems can generate measurable environmental, economic and social benefits. Together, these studies suggest that sustainability benefits from RL are most effectively realised through digitally enabled integration with manufacturing practices. Moreover, macro-level evidence shows that improvements in sustainability-related indicators are closely linked to economic development outcomes, underscoring the broader importance of effective SP across organisational and national contexts (Osunnaiye and Kucukaltan, 2025).
Despite the substantial literature on sustainability, advanced technology adoption and RL practices from individual perspectives, the literature lacks an adequate explanation for why companies have limited responses to address the key challenge of identifying and prioritising key performance measures that are not only aligned with sustainability but also linked to relevant technologies, particularly advanced technologies. Moreover, the growing adoption of advanced technologies in manufacturing presents significant opportunities to investigate how these innovations influence SP within SM systems integrated with RL. A comprehensive analysis of RL practices and their impact on SP, using the case of a large manufacturing firm, can generate valuable industry insights and inform practical guidelines. Such research can help practitioners prioritise RL practices that achieve a balanced and holistic approach to sustainability across environmental, economic, and social dimensions.
To address RQ1, a conceptual framework is developed. This is followed by engaging with stakeholders involved in RL in the case study organisation to select priority areas and identify measures from the literature to address RQ2. Developing a hierarchical model of key SP measures and illustrating the proposed model are carried out next for addressing RQ3. Research methodology is outlined next.
3. Research methodology
A mixed-methods approach was adopted, combining a literature-based conceptual framework with an empirical RL case study employing both qualitative and quantitative methods. The overall methodology is shown in Figure 1.
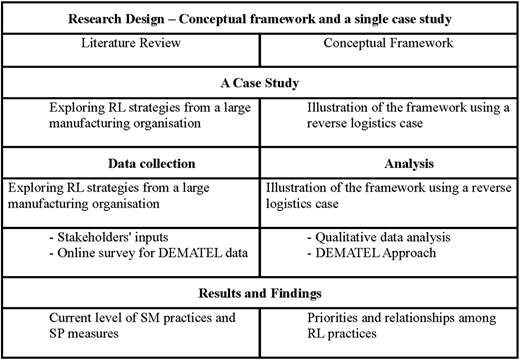
As shown in Figure 1, the first stage of this research project involved a literature review on broader areas of SM and performance as outlined earlier. Based on the literature review, a conceptual framework is developed for adopting SM by organisations. The second stage of the research project involves the illustration of the framework using a case scenario. The illustration of the framework involves developing a hierarchical model for assessing RL practices and associated SP using a multi-criteria decision-making (MCDM) approach (DEMATEL), based on the inputs from industry experts and qualitative data analysis. The grey-DEMATEL procedure/process comprises five main stages: (1) factor identification, (2) expert pairwise evaluation, (3) construction and normalisation of the grey relation matrix and (5) cause-effect analysis. Detailed steps are provided in Appendix 1. Grey-DEMATEL integrates grey system theory with the classical DEMATEL method to handle uncertainty and imprecision in expert judgments (Thakkar, 2021). Grey-DEMATEL studies typically rely on expert panels rather than large samples, as the method emphasises judgment quality over quantity. Numerous empirical studies successfully apply grey-DEMATEL with a small sample, even a sample of three experts (Raj et al., 2020). Content validity is ensured through literature review and subsequently screened and validated by experts (Limon-Romero et al., 2025). In the given context, grey-DEMATEL offers a distinct advantage over alternative MCDM approaches by revealing the connections between criteria and giving them priority according to the nature of these connections. Additionally, Grey-DEMATEL provides valuable insights into the collective understanding of relationships within intricate systems (Raj et al., 2020).
This study adopts a single-case design to support analytical generalisation. As an exemplary case, it provides transferable insights for large manufacturers due to its scale, established RL practices, formal SP measurement and adoption of advanced technologies, while recognising that future multi-case studies could enhance external validity. Details of the conceptual framework, the approach adopted for identifying SP measures and methods for illustrating the proposed model using a case study are presented next.
4. Conceptual framework of sustainable manufacturing with reverse logistics
Adoption of RL is directly connected with SM, as many of the practices support the reduction of waste and reduced energy consumption due to common practices. The adoption of RL has also been aided by several frameworks, including the 9R framework (Kirchherr et al., 2017), and the RL strategy framework incorporating joint venture RL (Prajapati et al., 2023). It is evident from the broader aspects of SM practices supported by RL and a diverse range of SP measures that organisations need not only a strategic framework but also a framework for selecting, prioritising and developing guidelines for the implementation of any selected sustainable practice/s. Therefore, it is envisaged that a conceptual framework be proposed as a holistic approach for guiding the industry in adopting SM practices.
A conceptual framework for SM, with detailed activities under each stage, focusing on RL practices, is proposed. The proposed framework is shown in Figure 2. The framework's five stages are grounded in established methodological streams. Explore follows design-science problem framing and evidence synthesis (Gregor and Hevner, 2013); Identify/Select draws on multi‑criteria decision analysis (MCDA)-based criteria elicitation (Hwang and Yoon, 1981); Categorise adopts taxonomy development to structure criteria (Nickerson et al., 2013); Prioritise/Determine relationships applies recognised prioritisation and causal-analysis techniques (Saaty, 1980; Raj et al., 2020); and Develop/Implement aligns with design-build-evaluate and staged deployment approaches (Gregor and Hevner, 2013).
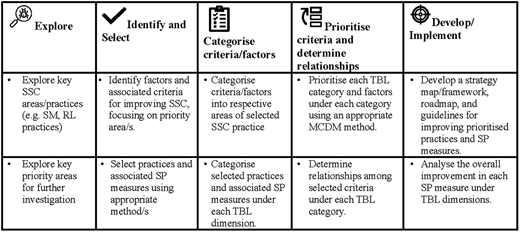
Based on the proposed framework, manufacturing organisations can develop guidelines, depending on the focus area/s within the broader sustainable supply chain management. In the case of SM, organisations can consider RL practices and CE principles, as well as the adoption of advanced technologies from the perspectives of products, processes and systems. Once the scope of the SM context is identified, economic objectives, environmental conditions and social factors need to be identified in a broader SM context, and relevant measures for selected sectors/s of the manufacturing industry are incorporated into the framework.
5. Illustration and empirical validation of the framework
The framework is illustrated using a single case study as a basis for providing guidance for the related industry sector in terms of adopting advanced technologies towards improving SP measures. Data required for testing the framework depends on the project scope (e.g. RL associated with the product life cycle) and measures considered for evaluating economic benefits (e.g. reduced cost of energy), environmental conditions (reduction in CO2 emission) and social factors (e.g. health and safety), aligned with the broader SM. The case organisation background and the details of the framework illustration are presented next.
5.1 Background of the case organisation
The case organisation is a large glass manufacturing firm operating in an emerging ASEAN economy. To preserve confidentiality, it is referred to using the pseudonym Smart Glass Pty Ltd (SGP) hereafter. SGP is a well-established organisation with over 4 decades of existence. It currently operates with five manufacturing/packaging plants and has become the largest glass manufacturing firm in the country. The company's mission is well established on a foundation of innovation, advanced production technology and effective performance, as evident from its growth and international recognition. SGP is committed to SM practices based on the concept of a CE. The data and information presented in this case study were gathered by the authors during their two visits to TGP and discussions held with team members who participated in two separate online briefing sessions. Since RL practices, closely connected with SM, are identified as one mission area of the organisation, the company is continually aiming for approaches to make manufacturing more sustainable from the TBL perspective. Details of the framework illustration are presented next.
5.2 Illustration of the framework
As shown in Figure 2, the proposed framework has five stages: (1) Explore, (2) Identify and Select, (3) Categorise, (4) Prioritise and Determine relationships and (5) Develop/Implement. The case scenario illustration is presented in two phases. The first phase involved the illustration of stages 1–3 (Explore, Identify/Select and Categorise measures) using a critical review of literature on SM practices and SP, and the secondary data collected from the case organisation. The completion of phase 1 leads to the illustration of the last two stages (iv and 5) using analysis of performance measures related to selected areas of SM (outcome of stage 1: Explore) and secondary data from the case organisation.
5.2.1 Explore
This phase of the framework (Explore) was illustrated using a critical review of the literature and the inputs from key stakeholders of a selected case organisation. Preliminary analysis of broader literature on definitions and characteristics of RL, CE principles and 6 R/9R processes/frameworks suggests that three areas are interrelated. To explore the sustainable practices of the organisation in terms of (1) a broader understanding of key areas of RL and (2) the importance of RL from a strategic perspective, managers were asked the following two questions.
From your perspective, how do you describe reverse logistics within broader sustainable SC practice, from the perspectives of strategies and benefits?
What are the key areas of RL and priority areas for further investigation and adoption, and why?
Profiles of two managers who participated in this preliminary phase of the illustration of the framework are shown in Table 1.
Profiles of managers
| Area of specialisation | Role | Years of experience |
|---|---|---|
| Supply chain (SC) and logistics | SC Development Manager | 15 Years |
| Sustainability and RL | Sustainability Operations Division Manager | 17 Years |
Qualitative insights as responses to the questions (Q1 and Q2) were gathered through face-to-face discussions with experts from the case organisation, with follow-up clarifications via email. Those clarified and confirmed responses are outlined in Table 2. These insights informed the development and refinement of the DEMATEL data-collection template by identifying relevant criteria and clarifying causal relationships, which were subsequently verified and finalised through organisational review. Consistency between qualitative insights and the DEMATEL data was ensured by involving the same group of experts in both data-collection stages.
Importance of RL and benefits from the organisation's perspective
| Key themes identified from responses | Details of each SM/RL practice and associated SP measure/s |
|---|---|
| Strategies | Design for circularity: Products/materials should be designed to be durable, reusable, repairable, recyclable and compostable |
| Reduce, reuse, repair, recycle: Consumers and businesses should reduce their consumption of resources, reuse products/materials whenever possible, repair damaged products and recycle materials at the end of their life | |
| Share and lease: Businesses can transition from selling products to selling services, such as leasing or sharing products. This can help to reduce the amount of resources that are consumed and the amount of waste that is generated | |
| Benefits | Reduced environmental impact: The circular economy can help to reduce greenhouse gas emissions, water pollution and land degradation |
| Increased economic resilience: The circular economy can help to create new jobs and businesses and reduce reliance on imported resources | |
| Improved social well-being: The circular economy can help to create a more sustainable and equitable society by reducing poverty and inequality | |
| Priority areas | Key areas of RL practices, very specific to the operations of the organisation: a. Recycling: Cullet returning as raw material. |
| b. Reuse: Packaging material and mould | |
| c. Resell/Refurbishment: Re-sorting glass bottle products |
As outlined in Table 2, responses to two questions led to identifying/selecting three priority areas with specific details associated with the current practices, challenges and strategies. It can be noted from responses that the organisation is keen to proceed with RL practices, particularly recycling, reuse and refurbishment, in support of SM. The illustration of the framework based on this outcome is continued through other stages.
5.2.2 Identify and select factors of sustainable manufacturing/reverse logistics practices
The identification and selection of specific SP measures followed a two-stage approach. First, a comprehensive literature review of RL practices was conducted to identify a broad set of relevant SP measures. Second, these measures were refined and categorised into TBL dimensions through expert input from the case organisation, gathered via a focused group meeting with a panel of experts. The following sections detail these two stages, prior to presenting the prioritisation and interdependencies of the selected measures using an MCDM approach.
The comprehensive literature review examined contemporary studies published between 2013 and 2024, using search terms such as SP, 6R processes, RL and CE, both individually and in combination. Applying defined inclusion criteria (e.g. empirical focus and methodological rigour) and exclusion criteria (e.g. English-language publications only) resulted in 18 relevant articles. Analysis of these studies identified key SP measures associated with RL practices, as presented in Table 3. In this case, only broader SP measures are outlined, while many related SP measures can be identified through a detailed analysis of each measure. The second stage involved the identification and selection of SP measures, aligned with the three priority areas of RL identified by the case organisation (Table 2), and using inputs from the experts in the organisation as outlined above.
Key measures of SM associated with RL practices
| Key Measure | Short description of relevant RL practice/s (remanufacturing, redesign, recover, reuse and reduce) with supporting reference/s | |
|---|---|---|
| Economic dimension | Usage/Cost of Raw materials | Redesign to reduce components [1], process design to reduce/eliminate hazardous materials [2] |
| Recycling of materials to reduce consumption of virgin materials [1] [3] | ||
| Reuse of materials within the product to reduce virgin material/s [1], reusing packaging to reduce raw materials [4] | ||
| Reduce the use of raw materials by maintaining the product characteristics [4] | ||
| Energy consumption/Cost | Remanufacturing process, supported by IoT-based energy management system reduces energy use [5] | |
| Products can be redesigned to reduce energy consumption [6] | ||
| Recycled plastics consumed less energy with optimised processes [7] | ||
| Reuse of components of significantly high PUV can reduce energy consumption [1] | ||
| Reduce energy consumption using advanced technologies such as I4.0 [8] | ||
| Environmental dimension | Waste (Energy, materials, water) generation | Re-manufacturability offers an opportunity for resource conservation [9] and enables lower waste and emissions [10] |
| Sustainable design reduces waste by extending its life through reuse [9] | ||
| Recovery of products through waste management reduces the need for raw materials [4] | ||
| Recycling of materials mitigates the negative environmental impact [9] | ||
| Reuse of products reduces waste and minimises product's adverse environmental impact [9] | ||
| CO2 emission | Recycling reduces the amount of greenhouse gases emitted from some materials in manufacturing processes [10] | |
| RL implementation limits waste and reduces CO2 emissions [11] | ||
| Social dimension | Level of social acceptability | Sustainable manufacturing, with stakeholder involvement, increases product acceptability [12] |
| Improvements in product lifespan through redesign enhance social acceptability [9] | ||
| Recycling of products increases social acceptability [9] | ||
| Recycling helps preserve the environment for future generations [11] | ||
| Health and safety issues | Sustainable manufacturing and RL practices contribute to safer products and working environments, benefiting both consumers and employees [13] | |
| Recover and reuse of e-waste products and banning the use of certain substances require regulations and compliance [4] | ||
| Recycling reduces open landfills and thereby has less impact on health and the environment [3] |
Three priority areas of RL and related practices are selected to evaluate sustainable practices in the selected manufacturing industry sector. The three areas of RL practices are within broader 6R processes (Jawahir and Bradley, 2016) and practices well-established in the literature (Yang et al., 2024). In this case, priority RL practices of glass manufacturing include recycle, reuse and reduce within broader 6R practices. These three processes within 6R processes are also directly related to four RL practices (direct product returns, returns to retailers, recycling recyclable/used items and collecting used packaging from customers for reuse/recycling) broadly influencing SP (Yang et al., 2024).
5.2.3 Categorisation of factors for sustainability performance
Based on the comprehensive review of SP associated with RL practices (Table 3) and inputs from the experts of the case organisation through a focused group meeting with a panel of experts, SP measures were selected and categorised into TBL.
SP measures are related to each area of RL practices and broadly related to the economic dimension (e.g. raw material cost, cost of recycling of cullet, resorting and reuse/refurbishment) and the environment dimension, including environmental impact, and energy consumption. In the case of SP measures associated with the advanced technologies and selected SM practices of the case organisation (e.g. RL), Table 5 outlines key measures of glass manufacturing, including all of the key cost, quality and waste-related measures associated with recycling cullet, resorting products and refurbishing packing materials.
5.3 TBL criteria and individual factors for sustainability performance
To illustrate the framework's stage 4 (Prioritise and determine relationships), a hierarchical model of key SP measures across TBL dimensions is developed. In line with the factor identification stage of the DEMATEL procedure outlined earlier, the measures under each TBL dimension were derived from the indicators identified in Table 4. These measures were further informed by data collected through on-site semi-structured interviews. The resulting set of measures was subsequently validated through multiple email exchanges and Zoom meetings with key stakeholders involved in the research project. The proposed hierarchical model of SP measures, connected with RL practices, is presented in Figure 3. This phase of data collection involved interviews with four experts, two of whom had also participated in the preliminary phase. The profiles of these participants are presented in Tables 5 and 6. Key SP measures are directly related to cost, quality and waste associated with current RL practices in the case organisation.
Selected measures of SM aligned with the current practices
| Economic measures | Environmental measures | Social measures |
|---|---|---|
| Reduce raw material usage using recycled materials (C1) | Reduce CO2 emissions using reduced energy consumption (C6) | Reduce accidents using automation and robots (C11) |
| Reduce energy costs using reduced consumption of raw materials and using recycled materials (C2) | Reduce waste by reducing product defects (C7) | Reduce the workload of workers (C12) |
| Improve product quality using resorting (C3) | Reduce hazardous materials (C8) | Improve working conditions with break times and AC/Fans (C13) |
| Reduce the cost of packaging by recycling and refurbishment (C4) | Reduce energy consumption by reducing the use of raw materials (C9) | Reduce smoke levels using monitoring and control (C14) |
| Reduce water usage/cost by recycling with reduced discharging (C5) | Reduce/eliminate the discharge of water (C10) | Improve the health and safety of workers through simulation-based training (C15) |
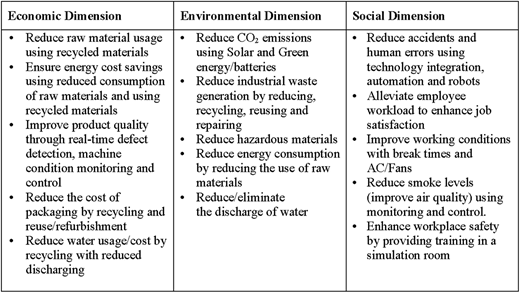
Hierarchical model of SP measures and RL practices. Source: Authors' own work
Hierarchical model of SP measures and RL practices. Source: Authors' own work
Key measures/variables of glass manufacturing
| The main area associated with the performance measure | Performance Measure |
|---|---|
| Raw materials | Reduce raw materials usage Increase recycled materials (Cullet) usage |
| Energy | Reduce energy consumption |
| Product quality | Improve product quality (decrease product failure rate) |
| Production cost | Reduce the cost of materials and resources |
| Wastage | Reduce waste (materials/products) generation |
| Environmental impact | Reduce Carbon emissions |
| Health and safety | Improve health and safety |
| Health and safety | Reduce accidents and human errors |
| Working conditions | Alleviate employee workload (work hours and breaks) |
| Working conditions | Reduce air pollution in the work environment |
Profiles of experts who participated in interviews (second stage)
| Area of specialisation | Role | Years of experience |
|---|---|---|
| SC strategy | Chief Strategy Officer | 30 years |
| Cooperate strategies | Senior Corporate Strategy Division Manager | 15 years |
| SC development | SC Development Manager | 15 years |
| Sustainability and RL | Sustainability Operations Division Manager | 17 years |
This stage of the framework illustration involved the prioritisation of each TBL category and SP measures under each category using an appropriate MCDM method. Once priorities are identified, interdependencies of measures under each TBL category are evaluated using (1) relationships among selected criteria under each TBL category in terms of prominent, influencing and resulting factors and (2) identifying specific RL practices (e.g. recycling) and I4.0 technologies that can help improve those factors (e.g. reduce energy consumption). In addition, this phase can be used to determine the interrelationship among factors for the capability of SM.
5.4 Prioritisation of sustainability performance criteria using the DEMATEL approach
The priorities of TBL dimensions and measures, as well as interdependencies of those measures, can be used to guide the glass manufacturing organisation to effectively measure their recycling efforts, prioritise resource utilisation, minimise environmental impact, and make informed decisions to promote sustainability in their operations. The evaluation of the hierarchical model is carried out as an integral part of the illustration of the framework (stage 4: prioritise and determine relationships) using the DEMATEL approach.
Based on the SP measures identified and categorised into TBL categories, as shown in Figure 3, a survey questionnaire was prepared for collecting data for DEMATEL analysis. In order to collect experts' inputs on how each criterion is evaluated concerning other criteria, a questionnaire for assigning the relative influence of each criterion against other criteria using linguistic terms (No (N), Very Low (VL), Low (L), High (H) and Very High (VH)) is developed. To collect experts' inputs using the developed questionnaire as an Excel spreadsheet, the survey questionnaire was shared with a senior manager of the case organisation and refined based on the feedback received. The final survey questionnaire was circulated among several managers of the selected case organisation for collecting their responses.
Seven SGP managers from diverse functional areas, with 5 to over 20 years of experience, completed the final questionnaire and their agreed-upon profiles are presented in Table 7. The expert panel size was set purposively to match the judgment-intensive nature of DEMATEL, where smaller, knowledgeable panels are standard and sufficient to derive causal structures (Raj et al., 2020). Furthermore, reliability and bias were addressed by using a standardised rating protocol, conducting a verification/feedback round, ensuring functional heterogeneity and triangulating DEMATEL outputs with qualitative insights from the same cohort. The data were analysed using the grey-DEMATEL method to identify causal relationships and highlight the most significant criteria in terms of prominent, influencing and resulting criteria within each TBL dimension.
Participants' profiles
| Job profile | Years of experience | Areas of expertise/responsibility |
|---|---|---|
| Expert (E1) – Engineering Division Manager | >16 years | Operations/Production |
| E2 – Sustainable Development (SD) Engineer | >20 years | Product Design/Logistics |
| E3 – SD Division Manager | >20 years | Overall Sustainable Operations |
| E4 – SC Manager/Professional | >5 years | Procurement/Logistics |
| E5 – SC Development Manager | >5 years | Procurement/Production/Logistics |
| E6 – Sustainability Manager | >20 years | Sustainable Operations |
| E7 – Purchasing Manager | <5 years | Procurement/Warehouse Operations |
5.5 The DEMETAL analysis and results
The results of the DEMATEL analysis, using the seven-step DEMATEL procedure (Raj et al., 2020), are directly aligned with the illustration of the fourth stage of the proposed framework. In the case of the selected case scenario, the results include (1) prioritisation of each TBL dimension and causal relationships among them and (2) prioritisation and causal relationships among criteria under each dimension. The causal relationships are identified in terms of prominent, influencing and resulting factors. These priorities and relationships are presented below.
5.5.1 Priorities and causal relationships of TBL dimensions
Tables 8 and 9 present the DEMATEL results for TBL dimensions (D1–D3), showing interdependencies (prominent, influencing and resulting factors) and cause-and-effect relationships. Table 9 includes the normalised total relation matrix, while Table 10 highlights net effects. R + D values indicate factor prominence, and R − D values reveal causal direction, with the highest R + D identifying the most prominent dimension.
Normalised total relation matrix (T) for the TBL dimensions
| Economic benefits (D1) | Env. Conditions (D2) | Social factors (D3) | |
|---|---|---|---|
| D1 | 0.280 | 0.355 | 0.365 |
| D2 | 0.290 | 0.262 | 0.320 |
| D3 | 0.270 | 0.284 | 0.252 |
Prominence and net cause-effect of TBL dimensions
| R | D | R + D | R − D | Cause/Effect | |
|---|---|---|---|---|---|
| D1 | 6.27 | 5.27 | 11.531 | 1.001 | Cause |
| D2 | 5.47 | 5.65 | 11.114 | −0.177 | Effect |
| D3 | 5.05 | 5.88 | 10.929 | −0.823 | Effect |
Prominence and net cause-effect of Economic measures/benefits (C1–C5)
| R | D | R + D | R − D | Cause/Effect | |
|---|---|---|---|---|---|
| C1 | 8.54 | 8.70 | 17.235 | −0.156 | Effect |
| C2 | 8.36 | 8.92 | 17.275 | −0.564 | Effect |
| C3 | 7.19 | 6.58 | 13.768 | 0.608 | Cause |
| C4 | 7.18 | 6.81 | 13.990 | 0.375 | Cause |
| C5 | 6.87 | 7.13 | 13.996 | −0.263 | Effect |
It can be noted from normalised total relation matrix for TBL dimensions (Table 9) that economic benefits significantly affect social factors (0.365). In other words, social factors receive strong influence from both Economic benefits (0.365) and Environmental conditions (0.320).
Table 9 shows that the most prominent TBL dimensions, those with higher R + D scores, are strongly correlated with others. Economic benefits (D1) emerged as the most prominent, which is typical for large organisations in emerging economies. It is interesting to note that the social factors (D3) are the most influenced by both environmental (D2) and economic (D1) factors. Overall, the three dimensions demonstrate comparable prominence, as the R + D values fall within a narrow range (10.929–11.531).
5.5.2 The prominent, influencing, and resulting measures (factors) and their relationships under each TBL dimension
Measures under each TBL dimension were analysed using the DEMATEL method described above for determining priorities and causal relationships among them. Results and analysis of measures (factors) under each TBL dimension, derived using the DEMATEL approach, are presented in terms of prominence (R + D) and net cause (R-D) values. The total relation matrices for each dimension are excluded owing to word-limit constraints. This follows the presentation of priorities and causal relationships among measures under each TBL dimension. As outlined earlier, five measures/factors identified from the first stage of the research were analysed using the DEMATEL approach. The prominence and net-cause effects of each measure are presented in Table 10.
From the economic dimension perspective, the most prominent measure is identified as “Ensure energy cost savings using reduced consumption of raw materials and using recycled materials” (C2). Five environmental conditions/measures identified from the first stage of the research were analysed using the DEMATEL approach. The prominence and net-cause effects of each measure are presented in Table 11. Similarly, five social factors/measures identified from the first stage of the research were analysed using the DEMATEL approach. The prominence and net-cause effects of each measure are presented in Table 12.
5.6 Validation of empirical findings on SP in reverse logistics and advanced technologies
This stage of case study research design incorporated open-ended questions as part of its data collection process, using a face-to-face meeting and observations during a site visit. These questions were used in interviews with managers and practitioners to validate and enrich the findings derived from the earlier structured interviews. Of the seven managers who participated in the data collection for DEMATEL analysis, with profiles shown in Table 7, four senior/middle-level managers (E1–E4) participated in this round of data collection. Whereas the structured interviews captured systematically comparable data on CE practices, specifically the adoption of advanced technologies and the implementation of RL practices, the open-ended questions allowed participants to elaborate on contextual factors, challenges, and enablers that were not fully addressed in the structured format used as part of data collection in the DEMATEL approach.
This qualitative validation process helped triangulate insights, ensuring that the initial findings were not only accurate but also representative of the complexities of practice. Participants were invited to reflect on the prioritisation of key performance measures, identify gaps and suggest opportunities for improvement. Their input was then synthesised and mapped against the structured interview results to refine and validate the emerging themes. Ultimately, the integration of open-ended responses provided practice-oriented evidence that informed the selection of key SP measures associated with RL and advanced technologies and the development of structured questions for collecting data for DEMATEL analysis.
Apart from the experts' inputs into the final selection of themes for DEMATEL data collection, several key observations were made from the discussion with senior managers of the organisation. These observations can be summarised into three main areas: (1) CE principles and RL practices, (2) advanced technology adoption and (3) SP measures/improvements. Responding to key initiatives on technology adoption as part of RL practices, all participants agreed on the need for emphasising CE practices, influenced by several drivers, including the need to comply with extended producer responsibility laws, and technology adoption for decarbonisation as a priority. It is evident from the following statement:
Currently in the process of transformation from analog to digital through sensor-enabled process for carbon emission measurement (E1)
Similarly, it is emphasised that the need for clarity on regulations by the law as quoted by:
Regulation is not clear and needs to start with one for national pro-service (E1)
When responding to the technology adoption, key technologies, including robots, 3D printing, rapid prototyping, digital twins and simulation, were emphasised. Robots are mainly used for reducing waste, improving safety by replacing manual work, etc. Similarly, rapid prototyping is used by marketing for promoting products and is being explored for identifying customers' needs before actual products are manufactured.
Respondents were asked to comment on key current RL practices in their respective functional areas and cross-functional collaboration. In general, several functional areas, including production, quality, transportation, inventory and maintenance, are involved in the journey of adopting advanced technologies, well-supported by cross-functional collaboration, but the current state of technology adoption is limited to a few technologies, for improving SP. Some of the examples include (1) solar power and batteries being used in production for reducing energy consumption, (2) technology-enabled sorting processes for better quality, where defects are detected early in the process, (3) sensors being used for machine condition monitoring and control and (4) workplace safety training using virtual simulations and digital twins.
5.7 Developing strategy framework and improvement roadmap
This involved two broader steps/activities: (1) develop a strategy map/framework, roadmap and guidelines for improving overall sustainable supply chain practices and (2) analyse the overall improvement in terms of economic benefits, environmental conditions (e.g. CO2 emission) and social factors (e.g. OHS). These activities are closely aligned with the recommendation of two key activities in RL for SP (Barletta et al., 2021). Thus, RL practices at the case organisation are further investigated using both steps. The first step of this phase is carried out by investigating the current practices of each RL area. Current practices, directly supported by several areas of RL associated with glass manufacturing, are outlined in Table 13.
Current reverse logistics practices and priorities
| Area of reverse logistics | Priority | Current practices |
|---|---|---|
| Recycling | 1 |
|
| Reuse | 2 |
|
| Refurbishment | 3 |
|
| Resell | 4 |
|
As shown in Table 5, each RL practice is identified by key activities and their priorities, based on the analysis of experts' inputs, carried out through DEMATEL approach. In addition to those priorities, the processing of waste (disposal) is emphasised as a necessary practice and involves several steps/activities as listed below:
General waste is disposed of and goes into a landfill
Waste is recycled by reselling to the owner or bidding buyers at the recycling accumulation/sorting centre.
Some hazardous waste is disposed of in a legal waste disposer (waste-to-energy)
Remaining hazardous waste is used to upcycle products at the technology and innovation centre.
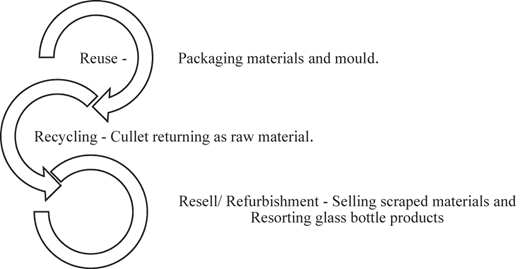
It can be noted from Table 5 that reuse, recycling of cullet, and refurbishment are directly linked with glass manufacturing. Since recycling is directly contributing to both production and delivery processes and is ranked the highest among the three different types of RL practices, it is recommended as a candidate for developing a strategic roadmap (Figure 4) for implementing further improvements of RL in the case organisation.
6. Findings
The research study empirically investigated SM practices, integrated with advanced technologies towards SP improvement, based on a case of RL practices in a large manufacturing organisation. The research findings from a stage approach of analysis of qualitative and quantitative data, including using an MCDM method, provide a comprehensive selection of performance measures closely associated with the current practices, prioritisation of key measures under each dimension and causal relationships in terms of prominence, influencing and resulting factors.
Individual SP measures under each dimension are considered from both direct and indirect effects. It can be noted from the results presented above (Tables 10-12) that ensuring energy cost savings (C2), reducing CO2 emissions (C6) and minimising accidents and human errors (C11) are identified as the highest priorities within the economic, environmental and social dimensions, respectively. Both C2 and C6 are supported by the recycling of raw materials, making recycling the main focus of the organisation when it comes to sustainability and its priorities. Interestingly, technology adoption plays a significant role as the highest-ranked social measure is to reduce accidents and human errors through technology integration, automation and robots in current practices. Overall, prioritisation of SP measures across three dimensions and their relationships in terms of prominence, influencing and resulting factors provides a current status of sustainable practices and priority areas for further improvements.
The proposed strategic framework is centred around the highest priority sustainable practice of recycling of materials and resources. While recycling of cullet as raw material is highly prioritised (ranked 1) in the organisation, the reuse of packaging materials and mould is also contributing to the overall SP, with reduced cost of packaging and reduced industrial waste generation. Apart from recycling and reuse, reselling/refurbishment by selling scrap materials and resorting to glass bottle products makes further improvement in the overall SP. The proposed strategic framework can be used to guide the organisation in adopting advanced technologies for improving SP from current levels to higher levels, by selecting prioritised areas and associated technologies in each sustainable practices. For example, organisation can explore advanced technology options to ensure energy cost savings (C2) and reduce CO2 emissions (C6) as a starting point. Similarly, the organisation can strengthen the already in-place technology integration, automation and robots to reduce accidents and human errors (C11).
The identification of recycling as the highest-ranked RL practice indicates that key SP measures, such as reduced raw material usage, energy consumption and water consumption, simultaneously generate economic benefits and improved environmental outcomes. This finding directly addresses RQ1 and RQ2, demonstrating that recycling is the most prioritised RL practice for the selected industry and that its associated sustainability measures are closely aligned with both economic and environmental performance. Furthermore, the integration of this prioritised recycling practice with advanced technologies provides a clear response to RQ3, highlighting how targeted RL practices can be leveraged to enhance overall SP.
7. Discussion
7.1 Discussion of research findings
Findings from the election of key performance measures across TBL dimensions indicate the importance of advanced technologies associated with several measures. This is closely aligned with the earlier studies. These include the integration of integration of I4.0 principles to strengthen sustainability by maximising economic, environmental and social outcomes (Tseng et al., 2021), identification of critical success factors that support SSCM practices and enhance business performance through the use of digital technologies (Mahroof et al., 2022) and the importance of experts' knowledge-based strategies to overcome implementation barriers (De Alwis et al., 2024).
Furthermore, key SP measures with very high priorities include reduced use of raw materials, energy consumption and water consumption, mainly through recycling, which contribute to both economic benefits and environmental conditions. While recycling of materials is a key sustainable practice that strongly contributes to both economic and environmental performance, the adoption of advanced technology emerges as a critical factor driving the social dimension of SP. From a resource-based view (RBV) and dynamic capabilities perspective, recycling dominates because it reconfigures material, energy and water flows into sustained economic and environmental advantages. This evidence supports the argument that recycling operates as a core dynamic capability that transforms waste and resource flows into long-term environmental and economic value (Asamoah et al., 2024).
By contrast, advanced technology and digital technology adoption primarily enhance the social dimension of sustainability, as these technologies improve workplace safety, transparency, traceability and workforce skills (Mahroof et al., 2022). In light of this, prior studies have also shown the importance of recycling as a key RL practice for reducing energy consumption and supporting the reduction of CO2 emissions, particularly in a similar industry context (Colangelo, 2024).
The importance of prioritising efforts when adopting advanced technologies is emphasised, particularly focusing on SP and selected SM practices (Yang et al., 2024). In addition, the inter-dependencies among measures, such as recycling materials contributing to a reduction in energy consumption, indicate the strong connection between RL practices and SP. Similarly, reducing accidents and human errors using technology integration, automation and robots as identified as a key performance measure under the social dimension. This is very closely aligned with the close association with the finding that several technologies, such as Industrial Internet of Things (IIoT), additive manufacturing and autonomous robots are being adopted in manufacturing for achieving sustainable performance (De Alwis et al., 2024).
The research findings indicate that, among several common RL practices identified in the literature, three practices of recycling, reuse and refurbishment stand out in the selected industry. These practices guide similar process-based and energy-intensive industries in achieving SP through the integration of advanced technologies (Mahadevan, 2019). This aligns with empirical evidence confirming the positive impact of SM on overall SP (Abdul-Rashid et al., 2017). The research findings also align closely with recent studies showing that RL-aligned practices can materially improve environmental outcomes (Habiburrahman et al., 2025) and reinforce evidence that RL contributes measurable SP improvements in manufacturing contexts (Yadav and Singh, 2025). Overall, from a theoretical standpoint, these findings reinforce a dynamic capabilities and RBV perspective by demonstrating that recycling delivers structurally embedded environmental and economic advantages, whereas digital technologies play a more complementary, socially enabling role rather than acting as primary drivers of sustainability value creation.
7.2 Theoretical implications
This study contributes to theory by reframing RL not merely as an operational sustainability practice but as a strategic, theory-supported capability through which manufacturing firms reconfigure resources for sustainable value creation. Drawing on dynamic capabilities theory, the findings demonstrate how selected RL practices, particularly recycling, function as higher-order capabilities that enable firms to sense, seize and reconfigure material flows in response to sustainability pressures. From an RBV perspective, the proposed framework clarifies how RL practices translate environmental stewardship into economic advantage, particularly within energy-intensive manufacturing contexts where resource efficiency is critical. Moreover, by explicitly differentiating sustainability priorities across the TBL dimensions, the study extends RL beyond generic sustainability claims and introduces a more nuanced, criteria-based understanding of performance trade-offs. In doing so, the research advances a context-specific and operationalisable theoretical framework, addressing long-standing calls for greater conceptual precision and industry sensitivity in RL and SM research.
7.3 Practical implications
From a practical implications perspective, the empirical application of the proposed framework within a large energy-intensive manufacturer demonstrates how prioritised RL practices can be translated into actionable managerial guidance. The framework offers managers a structured decision-support tool for prioritising RL practices, allocating resources across competing sustainability objectives and embedding RL within broader operational and sustainability strategies. By operationalising sustainability criteria and linking them to performance outcomes, the study enables practitioners to assess trade-offs, monitor progress and justify RL initiatives to internal and external stakeholders, thereby supporting more informed, consistent and strategically aligned RL implementation.
8. Conclusions
The present study proposed a holistic approach for adopting selected SM practices, integrated with advanced technologies for SP improvement, based on an assessment of selected measures through prioritisation and causal relationships. In the selected industry for this research, RL practices, prioritised based on SP, are integrated into a strategic framework and roadmap aimed at enhancing current practices through the adoption of advanced technologies, with consideration given to the relevant technologies at each stage.
The finding that prioritising RL practices, particularly when integrated with advanced technologies for SM, enhances resource efficiency and strengthens SP directly addresses the first research question (RQ1): “What are the priority areas of RL in the selected industry?” This alignment demonstrates that identifying and ranking these key RL practices is essential for guiding firms towards improved sustainability outcomes. The research identifies a comprehensive set of TBL measures that shape how RL is applied in the selected manufacturing sector, thereby addressing the second research question. RL contributes to reducing raw material use, lowering energy and water costs, improving product quality through enhanced monitoring and minimising packaging expenses.
The empirical investigation using the selected case scenario, supported by the DEMATEL analysis, directly addresses the third research question (RQ3): What are the priorities of selected areas of RL practices for improving overall SP?. The findings indicate that recycling, reuse and refurbishment emerge as the most critical and prioritised areas for enhancing both economic and environmental performance, particularly when combined with advanced technologies. In addition, the social dimension is strongly influenced by the highly prioritised social measure: “Reduce accidents and human errors using technology integration, automation and robots”. These findings confirm that technology-supported RL practices play a pivotal role across economic, environmental and social dimensions, thereby providing a clear and evidence-based response to RQ3.
The research examined how integrating RL practices with advanced technologies can enhance SP. It also developed a balanced and comprehensive set of SP measures aligned with prioritised RL practices, highlighting the interdependencies among these measures. Thus, this study contributes to theory by explaining how the integration and prioritisation of RL practices within manufacturing enhances SP through resource orchestration and dynamic capabilities (Barney, 1991). Drawing on the RBV theory (Teece et al., 1997), the framework conceptualises RL practices, particularly recycling, as strategic, technology-enabled capabilities that reconfigure resource flows, support cross-functional learning and convert operational routines into sustained economic and environmental advantages. In addition, the social dimension of SM, centred on employee health, safety, working conditions and job satisfaction, shows a strong link with advanced technologies across key performance measures. The implications of prioritised social measures integrated with advanced technologies are directly associated with the social measures (Table 4): Reducing accidents and human errors using technology integration, automation and robots (C11), improved air quality through smoke monitoring and control (C14) and enhancing workplace safety through simulation-based training (C15).
This empirical research study has some limitations, both methodological and contextual perspectives. First, the research is limited to a single case study/scenario of a selected industry, making the research findings less generalisable across other industries. Second, performance measures were derived from the literature and from a small group of experts, which may limit their applicability over time as new research emerges. A further limitation of this study is its focus on SP rather than the broader concept of organisational sustainability. Lastly, it is also important to recognise the need for further research on a comprehensive analysis of SM, integrated with advanced technologies in similar process and energy-intensive industry sectors, for a better understanding of integrated advanced technologies in other areas of SSCM practices (e.g. sustainable product design). Future research could enhance the framework through multi-case validation across sectors and emerging-economy contexts and by integrating longitudinal quantitative performance data to statistically examine the relationships between prioritised RL practices, technology adoption and sustainability outcomes.
About the authors


Ethical approval
We confirm that this study did not require ethical clearance. The first stage consisted of a panel discussion conducted as part of an ongoing research collaboration established earlier, involving professional participants contributing within their areas of expertise. The second stage involved an Excel-based pairwise comparison of pre-identified factors from the first stage for the DEMATEL method. This activity relied solely on expert judgement and did not involve the collection of sensitive or personal data, nor any intervention affecting participants. Therefore, both stages fall within standard professional and collaborative research practices that do not require separate ethical approval.
We gratefully acknowledge the valuable support and collaboration of SPG Ltd throughout this research project. Their generous engagement, through multiple meetings and participation in interviews, was instrumental to the study. We extend our particular thanks to the former Executive Vice President, Chief Strategy Officer, Supply Chain Development Manager, and Sustainability Operations Division Manager for their time, insights, and continued support.
Appendix The Grey-DEMATEL procedure
Step 1: Computing the initial relation matrices
Let n represent the number of identified I4R determinants and associated criteria, and let k represent the number of experts who responded. Each respondent evaluated the direct effect of I4R determinants and criteria i over I4R determinants and criteria j, on an integer scale of n I4R determinants and criteria.
Step 2: Computing the grey-relation matrix
In the second step, integer scale results were modified to fit the corresponding grey values with higher and lower limits, as shown below:
Where 1≤k ≤ K; 1≤i ≤ n; 1≤ j ≤ n, the lower limit of grey values is denominated by and the upper limit of grey values is denominated by for respondent k in terms of the relationship valuation among factor i and factor j.
Step 3: Computing the average grey-relation matrix (A)
The average grey-relation matrix (A) or , is derived from the K grey-relation matrices (Raj et al., 2020),
Step 4: Determining the crisp-relation matrix (Z)
In a crisp relation matrix, the elements or criteria are typically represented as rows and columns, and the cells of the matrix contain binary values (0 or 1) to indicate the existence or absence of relationships between the elements. A value of 1 indicates a positive relationship or dependency, while a value of 0 indicates no relationship or dependency. The crisp values of the grey number is arrived at by converting fuzzy values into crisp scores, as shown in the next steps:
Normalisation
where
The computing of a total normalised crisp value
Determining final crisp values
Step 5: Computing the normalised direct crisp-relation matrix (x)
The following equations were used to arrive at a normalised direct crisp-relation matrix (X), where the values lie between 0 and 1.
Step 6: Computing the total-relation matrix (T)
“I” represents the identity matrix.
The above equation (12) was used to determine the total-relation matrix (T).
Step 7: Determining the causal influence and building a digraph diagram.
There are three sub-steps to this step.
Step 7a: Computing the row (Ri) and column (Dj) sums.
The sum of each row (i) and column (j) on the total-relation matrix (T) was obtained using equations (13) and (14)
Step 7b: Computing the overall prominence (Pi) and the net effect (Ei)
The following equations were used to obtain the overall prominence (Pi) and the net effect (Ei):
A higher Pi value indicates higher prominence (importance) of factor i regarding its total relationship with other factors. Ei values above zero (Ei > 0) indicate factor i is a foundation for other factors or a net cause (influencing factor). Ei values below zero (Ei < 0) indicate factor i is a result of other factors (Raj et al., 2020), known as the net effect (resulting factor). These values are next plotted on a two-dimensional axis for each factor.
Step 7c: Calculating threshold value and plotting the digraph.
The total-relation matrix (T) indicates how each factor influences the other. However, a threshold value needs to be calculated to avert comparably insignificant effects. Factor i influences or causes factor j, if . The threshold value ( is calculated by considering the mean of the elements of the total matrix (. Then a direct arrow is drawn on the plot from factor i to j. Dotted lines illustrate a two-way relationship, and a one-way relationship is illustrated by a solid line. Casual relationships among the factors are plotted in the digraph using the following equation (17).

