This study aims to account for the business travel-related greenhouse gas (GHG) emissions of a department of sustainability science at a geographically isolated Finnish university and examines how the department may lead the way in climate action.
Data related to business travel of 65 department staff members were collected and compared to similar data for the entire university for the calendar year 2023. Four scenarios for possible climate actions were developed and presented to the staff in a survey to gauge the level of action that could be achieved in the future.
The study found that the department’s travel-related emissions account for 3% of the total university emissions despite it representing 5% of the staff. Staff showed an inclination towards adopting more aggressive climate actions, particularly in reducing air travel and increasing the use of low-carbon transport options. Findings suggest that green academics are aware of the environmental impacts of their travel and are willing to take meaningful steps to mitigate these impacts.
The methodology developed and recommendations from this study can guide the development of effective policies and practices to reduce travel-related emissions across the entire university community and other institutions facing similar challenges.
This study analyses business travel-related GHG emissions focusing on improved data accuracy and completeness for a sustainability science department and challenges previous conclusions that green academics do not differ from others in their business travel behaviour. It also examines the role of accommodation-related emissions and shows there are different attitudes towards travel within an academic community that impact preferences for different travel modes.
1. Introduction
Higher education institutes (HEIs) can be seen as simultaneously driving societal change while embracing various traditions of the past. And with issues of sustainability, sometimes a strong attachment to past traditions can conflict with a drive for progress. This is most evident with issues surrounding business travel, particularly air travel (Glover et al., 2018, 2019). The credibility of HEIs could be questioned if a significant climate impact related to travel mixes with calls to action, particularly in the field of climate change mitigation (Ahonen and Rask, 2024). This has coupled with recent efforts by universities and other HEIs to more accurately account greenhouse gas (GHG) emissions. Consequently, the body of scientific literature has no shortage of examples of realizations of the magnitude of the problem of travel-related emissions as well as suggested efforts to engage in more appropriate climate action (Ma et al., 2023). Despite this, travel can account for more than one third of total university GHG emissions (Tseng et al., 2022). This has been referred to as an “unsustainable paradox” (Fox et al., 2009).
The reasons for the apparent disconnection between knowledge and action in the academic community include denial and resistance, a possibly misguided perception that travel contributes to career success (Wynes et al., 2019), geographic remoteness (Ahonen and Rask, 2024; Glover et al., 2019), and misalignment between climate action targets and the policies that support their achievement (Theeuwes et al., 2024). A common conclusion is that there is a need to improve methods that shape academic travel practices, increase the adoption of sustainable travel, open meaningful dialogue around what constitutes good scientific practice, and fairly enable travel futures that are positive options for academic and non-academic staff at universities.
Wynes et al. (2019) have shown that heightened knowledge of sustainability issues may not necessarily result in less travel. Specifically, “Green” and “Not-green” academics showed no significant differences in either total air travel emissions, or in emissions that could be more easily avoided. However, the focus of that study was entirely on air travel of the academic staff. Wynes et al. (ibid.) exclude discussion on choices being made regarding other modes of travel, and it also excludes comparison to a whole university consortium, including non-academic staff. In addition, very few studies have included GHG emissions related to travel-related accommodation. Taken together, these boundaries limit the conclusion that the so-called Greens are not leading the way. If universities are to develop effective policies that achieve climate targets, they must be developed for the entire university community. And if universities are to maintain an active and exemplary position in enabling societal change, then policy development should be applicable to a wider context. What can be done on a smaller scale may have a resonating handprint that reaches well beyond the confines of a university.
To address these issues, this study aims to account for the business travel-related GHG emissions of a green university department and examine how it intends to lead the way. Lappeenranta-Lahti University of Technology (furthermore referred to as LUT University), located on two main campuses in southern Finland, represents an appropriate case study in this regard. The two main campuses in Lahti and Lappeenranta are located approximately 110 and 220 km, respectively, from the closest hub airport in Helsinki, there is need to travel between campuses and other regional units, and other domestic travel is common by both academic and administrative staff. In addition, Finnish geographic remoteness for academics has already been described as “an island on the edge of Europe” (Ahonen and Rask, 2024). LUT University has a department of Sustainability Science (SuSci) with staff located on both campuses, and the university consortium ranked tenth in the world in the 2024 Times Higher Education University Impact Rankings for Climate Action (Times Higher Education, 2025). It is assumed, therefore, that this academic department may be among the greenest of the green, at least in terms of awareness of GHG emissions.
Business travel will be defined as all travel made by employees in all modes, excluding daily commuting, but including accommodation. This study will also develop an expanded method to improve reporting data accuracy and completeness within the context of business trips in response to a recent call for improvement by Woszczek et al. (2025). In addition, the study will outline several possible scenarios for change and seek consensus on the level of climate action that is deemed desirable for the department. A judgement on how well those actions can meet the climate targets of the university will also be added. A final aim will be to showcase an expanded method of measurement and management of GHG emissions that can be adapted for a broader community.
Specific research questions include: What are the components of and total business travel-related emissions of the Department of Sustainability Science and how do they compare to the university community as a whole? Consequently, what scenarios for climate action could be developed within the department and what are the attitudes towards them? What specific recommendations could be made for the university community that would promote the achievement of stated climate action targets?
2. Literature review
HEIs maintain an important role in society and face increasing challenges to develop a leading role in sustainability issues (Rosa et al., 2024). More than “any other sector in society”, da Silva et al. (2023a, 2023b) argue that HEIs have essential influence on sustainability issues. Not only are graduating students agents of change in their future communities (Adjei et al., 2021), but HEIs have a role in transferring knowledge to surrounding companies and their wider communities as a whole (Booth et al., 2020). This applies to sustainability issues more generally, but is often manifest in more specific issues, such as climate change mitigation (Leal Filho et al., 2019).
HEIs bear the dual responsibility to achieve societal impact through education and innovation while also serving as models of sustainable practices. At the same time, they are examples of organizations that struggle to achieve sustainability in general and decarbonization more specifically (Basheer et al., 2025; da Silva et al., 2023a). Meeting the challenge of unsustainable travel practices at HEIs is therefore an opportunity for internal carbon footprint reduction and lowering the risk of hypocrisy in a broader societal context. By developing carbon footprint reduction strategies internally and overcoming challenges related to standardized data collection, data accuracy, stakeholder misalignment and financial constraints, a more honest societal impact may be created.
Behavioural change theories such as the theory of planned behaviour (Ajzen, 1991) posit that individual intentions and behaviours are shaped by attitudes, subjective norms and perceived behavioural control. This framework may explain the gap between sustainability awareness and travel choices among academics. Furthermore, a sustainable organizational management framework, such as the multi-level perspective on transitions (Geels, 2002), offers insight into how institutional policies and cultural norms can enable or constrain the adoption of low-carbon travel practices. These perspectives enable a more comprehensive understanding of both individual and systemic factors influencing climate action in HEIs.
Glind and Gomez-Baggethun (2023) outline the main drivers, alternatives and possibilities of change regarding air travel in academia. They report strong implicit and explicit encouragements by research groups and funding agencies that reinforce a perception that flying to promote internationalization “is a routinized and normalized component of academic life” (Glind and Gomez-Baggethun, 2023). Furthermore, there is a perception that young academics have a need to travel to build networks, while senior academics have a similar need to maintain and expand current networks of international cooperation. This combines with the idealized culture of high academic output and workload to be further counterproductive to achieving a low-carbon academia. Flying “is seen as the status quo” that is viewed as almost obligatory despite environmental concerns on the part of academics (Glind and Gomez-Baggethun, 2023). However, recent restrictions on travel during the COVID-19 pandemic highlighted effective substitutes for academic travel and reflection on the extent to which digital tools can replace physical presence (Glind and Gomez-Baggethun, 2023).
While there appears to be support within academia to reduce air travel, there is disagreement about how this may affect academic work either positively or negatively (Kreil, 2021) as well as how to facilitate such change. Eriksson et al. (2020) outline four main possibilities to reduce air travel emissions as perceived by academics themselves, including fine tuning trips to reduce emissions, instituting quotas or other hard rules that strictly limit emissions through means developed within organizations, implementing regulatory changes that influence the travel industry to provide more environmentally attractive options, and fundamentally transforming the overarching academic, political and economic systems that contribute to the perceptions that academic travel, productivity and success are inherently intertwined. Most academics reported preferences for the first solution, which may have very limited overall impact on travel emissions, but may be easiest to institute (Eriksson et al., 2020). This also reflects a greater perception of the need to fly and a fear of not flying among academics.
Glind and Gomez-Baggethun (2023) advocate for the development of a slower academia, one that challenges the high output mentality and the necessity of air travel, to enable a more low-carbon academia. This could begin with grant-providing agencies placing greater weight on the environmental impacts of funded research projects instead of merely reinforcing a high-output mentality that leads to greater travel. This could combine with the observation by Wynes et al. (2019) that reducing academic flying may not significantly affect network building or career success, perhaps especially for senior academics. Moreover, embracing digital tools could offer more egalitarian contributions to the world of academia by removing advantages of those with the resources and ability to travel (Jack and Glover, 2021). This could result in greater academic contributions by those with responsibilities as care givers (predominantly women) or who are otherwise restricted from travelling by temporal or physical means (Jack and Glover, 2021).
This work addresses several gaps in knowledge. Firstly, there have been few adequate comparisons of the choice of travel mode drawn between communities with higher awareness of sustainability and others. While Wynes et al. (2019) find no difference between so-called green and not-green academics, this study challenges the findings by extending the analysis beyond air travel to include all forms of business travel. Secondly, this analysis includes emissions related to accommodation, which have likewise been mostly ignored in analyses of business travel. Thirdly, attitudes towards the possibilities of reducing air travel emissions proposed by Eriksson et al. (2020) are tested beyond a community of computer science academics to include those that may have greater sustainability awareness. This need is highlighted in recent work that shows there could be different clusters of attitudes towards travel within an academic community that impact preferences for different travel modes (De Vos et al., 2024). The same study states simply that “air travel needs to reduce, and particularly for those who fly frequently”. This study examines the extent to which we can add “and beginning with those who should know better”.
3. Methods
This study assessed business travel-related GHG emissions for 65 staff members of the Department of Sustainability Science at LUT University, comparing them to university-wide data for 2023. A detailed trip-by-trip analysis was conducted to enhance data accuracy and completeness, particularly for modes of travel and accommodation. In addition, four scenarios were created for possible climate actions by the department and presented to staff in survey form to gauge the level of future action that could be achieved related to business travel. Results were then compiled and analysed with respect to the research questions posed.
3.1 Data collection
Travel data were sourced from LUT University’s Travel Management System, which included itineraries from the university’s travel service provider. Emissions were calculated for seven categories: plane, train, taxi, private vehicle, public transport, ferry and accommodation. Manual data mining enabled inclusion of trips not booked through the provider and allowed for detailed analysis of travel purpose, job position and transport mode. The process of compiling annual GHG emissions data from travel service provider summaries for LUT University is reported in Woszczek et al. (2025) and Ottelin (2024). For SuSci air travel, instead of simplified annual summaries from the travel service provider, the origins and destinations could be seen trip by trip, which enabled a determination of how many flights were direct or indirect. For all other transport modes and accommodation, data was mined from original trip receipts found in the Travel Management System. This additional mining was estimated to take approximately 120 person hours.
Accommodation emissions were calculated using hotel-specific data when available from the itinerary, or country-level averages used in Woszczek et al. (2025). Four stays were excluded from a total of 80: two Airbnb stays of one and nine nights, and two long-term rentals of 71 and 90 nights due to a lack of available data on emissions concerning private rentals.
For plane travel, emissions were calculated based on the method used by Woszczek et al. (2025) for LUT University as a whole, which divided trips into three categories and assigned an emissions factor recommended by the travel service provider and originating from UK Department for Energy Security and Net Zero (2023), see Table 1.
The calculated distances and emissions were also compared to those found using the International Civil Aviation Organization (ICAO) Carbon Emission Calculator (International Civil Aviation Organization, 2025) as a means of testing the validity of emission factors used by the travel service provider. Overall emissions related to all air trips differed by less than 1%, so the travel service provider emission factors were deemed suitable.
Train trip distances were calculated using Google Maps (2024) by inputting the names of train stations found on the customer receipts. Each independent train trip was recorded in cases where multiple intercity or local trains were used for a single journey. Within Finland, an emission factor of 0.0015 kg CO2e/pkm was used based on the annual report of the state-owned railway company (VR Group, 2023). For train trips within Europe, which tend to have high levels of electrification, a general emission factor of 0.02 kg CO2e/pkm was used (Bleijenberg, 2020). For train travel in the USA, limited to a single return trip in New York City, an emission factor of 0.04 kg CO2e/pkm was used (Federal Transit Administration, 2010).
The categories of taxi, public transport and ferry were investigated for SuSci whereas they were not collected at the LUT University level. Calculations and emission factors used for these modes and private vehicle use were seen as comparable by following methods outlined in Woszczek et al. (2025).
Taxi distances were generally found on customer receipts. However, if this information was missing, Google Maps was used to determine distances between stated trip origins and destinations. In total, 5 of 48 taxi trips were excluded due to a lack of information to allow inferring distances. An emission factor of 0.144 kg CO2e/pkm was used under the assumption that all taxis were internal combustion engine vehicles that used petrol. Powertrain information was not found on any customer receipt, and the highest emission factor related to cars was chosen as a conservative assumption. As data were not available on the number of passengers on each taxi trip, it was assumed there was a single traveller, and that 1 km would also be one pkm.
Customer receipts showed the total distances travelled for each trip using one’s own private vehicle as well as trip origins and destinations. As the number of private vehicle trips was rather limited (26 trips), supplemental information was requested from staff by email to determine the powertrain and fuel type. Only three types of vehicles were reported. The emission factors used are found in Table 2 (Woszczek et al., 2025). It was known that all trips involving private vehicles involved a single traveller, so the assumption that 1 km equals one pkm held.
The category Public Transportation included several modes such as streetcar, metro, bus, train and other, but was resolved for each trip through other information found from trip receipts or through supplemental questioning of the traveller by email. Appropriate emission factors for each mode for public transport were assigned. Distances between reported origin and destination were estimated for known public transport routes using Google Maps. In total, there were 141 Public transport trips reported. However, 65 trips were excluded due to a lack of data available about trip origin or destination. Of the exclusions, 45 trips were reported in Finland, where GHG emissions from public transport tend to be very low. It was assumed that all exclusions would not impact final results significantly. An emission factor of 0.023 kg CO2e/pkm was used for all trips, appropriate for a diesel bus. Most of the known public transport trips (62 of 86) involved bus journeys from train stations to LUT University campuses in Lappeenranta and Lahti, where diesel buses are used. Although electric and biogas buses are available in both cities, their use on routes cannot be known with certainty. Therefore, a more conservative assumption of complete diesel bus use was assumed (Woszczek et al., 2025).
Ferry transport was limited to the use of two ships from the same company, Tallink, which report emission factors of 5.8 (Helsinki-Tallin) and 41.01 (Helsinki-Mariehamn-Stockholm) kg CO2e/passenger for the routes that were used over five trips (Tallink, 2025). As one traveller on four occasions departed the ship in Mariehamn, which represents 70% of the distance, the emissions for the trips were reduced proportionally.
3.2 Scenario development
To determine levels of climate actions that could be used, four scenarios were developed with specific descriptions of actions with increasing mitigation potential for each category of business travel described in section 3.1. Table 3 provides an overview.
Based on this framework, specific statements outlining climate actions in each category of business travel were devised, and several were adapted from possibilities proposed by Eriksson et al. (2020). These statements (see Survey statements related to scenarios of climate action) were formed as actions that employees may agree to or plan to adopt in the future:
Climate actions related to air travel
BAU – I do not plan to make any changes to my air travel choices beyond those currently defined by the university’s travel guidelines.
PCE – I would be willing to eliminate non-essential domestic flights and fly to close hubs within Europe so that trips could be completed by train or other low-carbon ground transport modes. Destinations outside of Europe would be minimized.
ACE – I would be willing to set quotas for air travel emissions on a departmental level that can be “traded” within or between departments. These quotas would become more strict over time.
TCE – I would be willing to eliminate all non-essential air travel.
Climate actions related to train travel
BAU – I do not plan to make any changes to my train travel choices beyond those currently defined by the university’s travel guidelines.
PCE – I would choose train travel over all other modes when possible.
ACE – I would agree to making train travel recommended for all domestic trips barring exceptional cases.
TCE – I would agree to making train travel mandatory for short and medium-range trips. Furthermore, I would support a ban on domestic air travel and use of my own car barring exceptional cases.
Climate actions related to private vehicle use
BAU – I do not plan to make any changes to my private vehicle choices beyond those currently defined by the university’s travel guidelines.
PCE – I would agree that private vehicle use should be approved only when it is the least costly and most appropriate solution.
ACE – I would agree that private vehicle use should be more strictly monitored and limited.
TCE – I would agree to eliminate the use of private vehicles unless they are zero emission vehicles for all trips barring exceptional cases.
Climate actions related to public transportation
BAU – I do not plan to make any changes to my public transport choices beyond those currently defined by the university’s travel guidelines.
PCE – I would agree to increase trip planning time to maximize use of public transport.
ACE – I would agree to establish a merit order of public transport options and follow that order when planning travel.
TCE – I would agree to ban the use of taxis and own cars unless they are zero emission vehicles when there is a reasonable public transport option.
Climate actions related to overnight accommodation
BAU – I do not plan to make any changes to my overnight accommodation choices beyond those currently defined by the university’s travel guidelines.
PCE – I would agree to select the lowest emission options only.
ACE – I would agree to select the lowest emission option offered by the travel company and minimize energy usage and waste during my stay.
TCE – I would agree to eliminate all overnight stays that are non-essential.
Climate actions related to online meetings and conferences
BAU – I do not plan to make any changes to my choices related to online meetings and conference attendance.
PCE – I would agree to limit travel when an online option exists.
ACE – I would agree to set increasing targets for online participation each year.
TCE – I would agree to eliminate all travel when an online option is available barring exceptional circumstances.
Source: Authors’ own work
They also formed the basis of a survey sent to all department staff members via email with a link to the survey tool. Ahead of the release of this survey, staff were briefed on the results of the business travel analysis and familiarized with the scenarios during a regularly scheduled meeting to present general research findings.
3.3 Departmental survey
All members of the department had the opportunity to participate anonymously in a survey concerning business travel that was opened for a three-week (January 7–28) period following the initial briefing described in section 3.2. The survey was available from the Webropol web-based survey tool available at LUT University. Confidentiality was assured and informed consent was solicited so that the study and compiled results with the EU General Data Protection Regulation. Survey questions were composed of multiple statements that participants chose to best reflect their opinions, and supplemental questions were added to allow participants to add any additional comments to questions if they felt the need to elaborate on their answers. The survey is available in the Supplementary Materials.
4. Results
Results are shown separately for carbon footprint measurements and the department’s desired future climate actions based on survey results. SuSci results are compared to those presented for LUT University (Ottelin, 2024). While comparing SuSci and the university, it should be kept in mind that calculated values for SuSci are the result of efforts to find more accurate and complete data. As such, comparison may not always be direct as different methods were used.
4.1 Carbon footprint
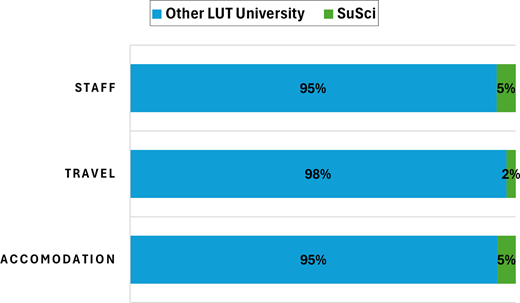
Figure 1 shows the share of staff and GHG emissions related to business travel for both SuSci and LUT University.
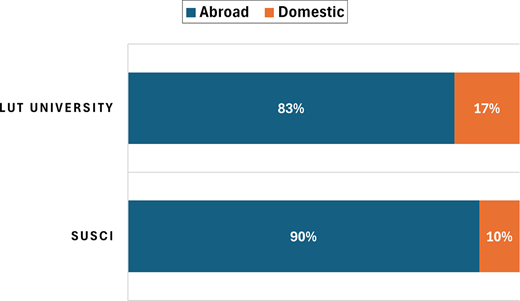
While SuSci represents 5% of staff, its emissions are only 3% of the total for the university. Accommodation represents a slightly higher share of emissions for SuSci even though the number of nights in accommodation (152 nights) represents 4% of the LUT total (3567 nights). The reason for this can be seen in Figure 2, which shows that the percentage of domestic accommodation (where emission factors tend to be lower) is lower for SuSci than for the whole university. Given that SuSci data has been collected in a manner that increases accuracy and completeness, the proportion of SuSci emissions is assumed to be inflated when compared to university level results. If the improved method were used at a university level, overall emissions might be higher, and SuSci emissions might be lower proportionately in a direct comparison.
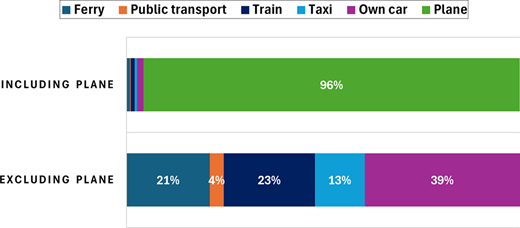
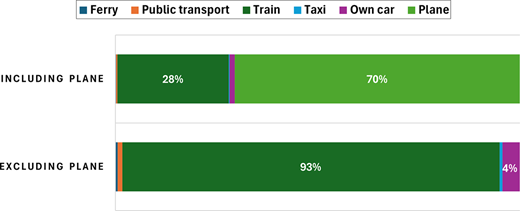
Emissions and travel distances related to modes of travel are shown in Figures 3 and 4. As plane travel dominates the results, values are also presented without plane travel to allow closer analysis.
An indirect comparison of the use of different modes of travel between SuSci and LUT University can be seen in Table 4.
Results show that SuSci staff have proportionally lower emissions related to air travel, the use of private vehicles and domestic accommodation. However, train travel is much more common. In terms of distance, SuSci staff travel represents 3% of the LUT University air travel total distance of 6 325 812 pkm; 1% of personal car travel compared to LUT’s 287 000 km; and 8% of train travel compared to LUT University’s 871 564 pkm.
Tables 5 and 6 show an overview of who is travelling by air and where they are travelling. Overall, SuSci staff travel by plane a bit more than once every two years, while more senior academic staff travel about once per year. Domestic air travel represents just 5% of the total number of trips, while air travel within other parts of Europe represents 85% of trips and outside of Europe represents 10% of trips. Due to the longer distances, emissions related to air travel outside of Europe represented a high share of overall emissions (27%). The total travel distance by plane was 176,249 km and the total emissions were 12,462 kg of CO2e. Of the 40 trips by plane, 29 of those were direct flights (72.5%). Of the indirect flights, 9 of the destinations would be impossible to reach by direct flight from Helsinki. For the remaining indirect flights, two trips involved a direct flight in one direction and an indirect flight in the other.
4.2 Future climate actions
Table 7 shows results of the survey questions related to climate actions that SuSci staff would be willing to adopt in the future. In supplementary comments, several respondents indicated that they are already engaging in climate actions that exceed the minimum standards set by the university travel guidelines. For each question, a Chi-Square goodness-of-fit analysis was performed, with p-values ranging from 4.40 × 10⁻⁴ (Q6) to 1.76 × 10⁻⁹ (Q1). Over all the questions, there were 226 scenario choices made by 38 staff members (56% response rate). The BAU scenarios were chosen 8% of the time, while the PCE, ACE and TCE scenarios were chosen 31%, 35% and 27% of the time, respectively, with a p-value of 1.24 × 10⁻¹⁹. Combining results for BAU + PCE and ACE + TCE showed preferences of 39% and 61%, respectively, with a p-value of 7.09 × 10⁻⁸. Each p-value indicates strong scenario preference that deviates from what would be expected under equal preference.
Additional comments made on the survey showed a level of ambiguity in determining the difference between essential and non-essential travel as well as the need for policy to have very clear definitions. Likewise, comments suggested a need for strict definition of what qualifies as exceptional cases or circumstances. Another common theme in the additional comments related to a need to compare differences in travel options in terms of the length of travel time, with ground transport often having practical challenges in this regard. A final theme in the comments was a suggestion to measure the potential benefit of the trip in terms of its carbon handprint potential or to compare benefits of physical vs remote participation.
5. Discussion
The business travel-related emissions of the LUT University Department of Sustainability Science in 2023 were approximately 16 tons of CO2e and represented lower proportional emissions than the university. In two important categories, SuSci staff demonstrated even lower proportional emissions: plane travel and private vehicle use. This challenges the earlier observation that there may be a knowledge-action gap for green academics (Wynes et al., 2019). At the same time, the original study compared green and non-green academic travel, while this study widens the scope to include non-academic staff at a university level. SuSci staff were also seen to use low carbon forms of public transport, such as train, at a higher frequency than their colleagues, and have a higher proportional use of domestic accommodation. Combined with survey comments that show a heightened sense of pro-climate decision making, it appears that the knowledge-action gap has been reduced.
Plane travel dominates the SuSci travel emission profile, accounting for 96% of all GHG emissions. As pointed out by Ahonen and Rask (2024), Finland is somewhat geographically isolated and alternative forms of ground travel are impractical when travelling abroad, even when there is a wish to make a shift. The persistence of air travel emissions aligns with findings from other European and international contexts (Tseng et al., 2022), underscoring the challenge of decarbonizing academic mobility in geographically remote settings. Therefore, at least some of the knowledge-action gap can be explained. In addition, this study also indicates that there are differences between who is travelling, with more senior academic staff travelling by air roughly twice as frequently as junior academic staff. This may be a reflection of the perceived pressure to travel also reported by Ahonen and Rask (2024) for similar positions. It is also possible that time pressures to complete dissertations may limit the urgency to travel for some junior academic staff. In addition, Wynes et al. (2019) reports a correlation between increased air travel emissions and more senior academic positions. A possible reason for this is also offered by Glover et al. (2019), who claim air travel is perceived to offer the benefit of overcoming remoteness and advancing one’s career. These benefits appear to be more available to more senior staff, who have a better ability to take advantage of travel opportunities, while others remain ‘stuck on the ground’.
Despite this, there is also evidence that the status quo is being challenged, and that the knowledge-action gap is decreasing. SuSci staff travelled on average 0.6 times per year by air at an average distance of 4,406 km per trip and average emissions of 311 kg of CO2e per trip. This compares to values reported by Wynes et al. (2019) that show green academics travelled 4.4 times per year by air at an average distance of 717 km per trip and emissions of 144 kg of CO2e per trip. The higher average distance and emissions of SuSci staff can be explained by Finnish geographical remoteness. However, the much lower number of times per year that Susci staff travel by air is a possible indication of much lower pressure to travel by air or increased awareness of the impacts of air travel being put into action.
To this end, there may be evidence of an approaching tipping point for SuSci staff. Jacobson et al. (2020) argue that behavioural change is preceded by awareness that evokes negative emotions, and the awareness of the climate impacts of air travel may be higher among these green academics. Despite existing struggles that may exist between personal values and perceived need to fly, the fear of not flying appears relatively low in SuSci, perhaps more so for junior academics. At the same time, changes to the cultural norms of academia that promote travel will be needed to achieve greater decarbonization. Developing a broader culture of slower academia (Glind and Gomez‐Baggethun, 2023) could enable this.
The Susci travel footprint indicates several ways that these green academics differ from their colleagues. They have lower proportional emissions related to air travel, private vehicle use and accommodation. And they have proportionately higher emissions related to train travel. A lack of reporting on the university level related to taxi use and public transport does not allow comparison in these categories. However, now that a methodology has been established to calculate these emissions (by SuSci researchers), it should now be easier to improve data collection and comparison at a university level. The methods used in this study result in improved accuracy and completeness, thereby allowing more appropriate climate actions to be determined.
The COVID-19 pandemic has highlighted possibilities for change in academic travel behaviour, through normalizing online meetings and conferences (Jack and Glover, 2021). This disruption questioned the necessity and value of physical travel for academic work, with several studies highlighting the benefits and the challenges of reduced mobility (Glind and Gomez‐Baggethun, 2023; Kreil, 2021). As universities transition into a post-pandemic era, there is a renegotiation between returning to pre-pandemic travel practices and embedding new, more sustainable norms. The findings of this study suggest that SuSci staff show a willingness to maintain or even accelerate the adoption of low-carbon travel practices established during the pandemic.
Furthermore, results indicate that SuSci staff appear to have little inclination to remain in a Business As Usual scenario but would prefer further action to reduce travel-related emissions, with only 8% of responses allocated to a BAU scenario. At the same time, there is some reluctance to adopt the more aggressive actions of the Trailblazing Climate Efforts scenario (27% of responses). Progressive and Accelerated Climate Effort scenarios were more reliably chosen, with 31% and 35% of responses, respectively. Taken together, there appears to be a tendency towards more accelerated climate actions, but this can differ by category notably. Progressive effort is preferred in the categories of air travel and online meetings. This is an interesting observation considering the perceived link to career advancement already discussed and a general preference shown for fine tuning travel plans shown in Eriksson et al. (2020). Accelerated effort is preferred in the categories of train travel, public transportation and overnight accommodation. Trailblazing effort is preferred in the category of private vehicle use.
Given that the scenarios described represented increasing climate actions that would include the actions described in a less aggressive scenario, another possible analysis could be made. In all but the category of online meetings and conferences, at least half of responses were for either ACE or TCE scenarios. Free comments indicate that personal connections are perceived as essential in some cases, especially at the beginning of collaborative projects involving multiple universities and other organizations. There were also worries that online communication may not always be as clear or effective. This is also seen as a concern in other studies (Ahonen and Rask, 2024; Eriksson et al., 2020; Glind and Gomez‐Baggethun, 2023; Kreil, 2021), and one of the main obstacles to overcome. A main conclusion can be made that within the context of LUT University, green academics not only have relatively low travel-related footprint, but they are prepared for more accelerated climate action. In this regard, perhaps they are prepared to lead the way.
LUT University is one of 1237 educational institutes involved in the Race To Zero target (The Alliance for Sustainability Leadership in Education, 2025), and commitments include achieving climate neutrality before 2030 and net zero emissions by the middle of the century at the latest. Given such ambitious goals, accelerated climate action related to business travel is essential as it represented the second highest source of emissions for the university in 2023 at 26%, second to staff and student commuting at 29% (Ottelin, 2024).
Recommendations to be considered to achieve stated targets include those from scientific literature and new findings. Department and individual emissions quotas should be implemented, with annual reductions and possible emissions trading within the university (Tseng et al., 2022; Wynes et al., 2019). Eligibility for project funding should be linked to GHG emissions of proposed travel, thereby incentivizing low-carbon research collaboration (Glover et al., 2019). Business travel should be better fine-tuned to promote multiple meeting opportunities in a single trip (Eriksson et al., 2020) or prioritize ground transport for regional travel (Glind and Gomez‐Baggethun, 2023).
To enhance the accuracy and completeness of travel emissions data, the creation of a digital platform or mobile app that enables staff to photograph and upload receipts for all travel modes should be considered. Optical character recognition (OCR) technology can automate data handling, thereby reducing manual workload and errors. Gamification elements, such as awarding points for timely and complete data submission, can further motivate participation. Points adherence to quotas could be traded for benefits or used to offset penalties for exceeding quotas. Points could also be linked to academic career progression or to monetary benefits for non-academic staff. These measures would facilitate more robust emissions tracking while incentivizing and assisting in the planning of low carbon travel.
While this study provides insights into business travel-related GHG emissions, there are limitations that can be acknowledged. Because the data collection process involved manual extraction of information from individual expense reports, there is a possibility of both human error and inconsistency despite the best attempts to avoid this problem. Furthermore, the exclusion of some data related to public transport and accommodation due to a lack of available data limits the completeness of the emissions analysis. Next, data collection and analysis were more comprehensive at the department level than it was for the university for certain business travel categories, so the diversity of travel behaviours and emissions across the entire university has not been fully captured. Finally, a survey response rate of 56% is quite high, but extending the views and practices of SuSci (5% of university staff) begs the question of whether that can be representative of the views and practices of all the entire university. However, it is a main conclusion of this study that a smaller number of green academics might be in a better position to determine future business travel behaviour with carbon footprint in mind. It remains entirely possible that a different subset of the LUT University population could offer even better views or practices.
The limitation above related to exclusions limiting data completeness was a point of some contention during this study. In a study that aims to improve data collection methods by increasing the completeness of data, greater efforts could certainly have been made to make crude estimations related to both public transport and accommodation. However, such estimations would inherently lead to a decrease in accuracy, which was another main driver of the current study. In these cases of exclusion, there was no way to have both increased completeness and accuracy, which justified the exclusion. At the same time, it could be argued that obtaining completeness with limited accuracy is preferrable. In the end, the consideration of whether estimations would be inaccurate or have limited accuracy was less important than determining ways to remove the potential trade-off altogether. In the case of public transport exclusions, behavioural change in reporting practice within the university can lead to improvements in completeness and accuracy. At the same time, it must be kept in mind that emissions related to public transport represented less than 0.2% of total SuSci emissions. However, accommodation exclusions can only be reduced by either a decision within the university to restrict stays to accommodation that has available data on emissions or by efforts made by the hospitality industry to expand reporting standards and requirements, especially including such stakeholders as Airbnb and long-term rental properties. The category of accommodation, at 20% of total SuSci business travel emissions, enhances the completeness of reporting despite the level of exclusion in this study.
6. Conclusion
This study examined the business travel-related GHG emissions of the Department of Sustainability Science at LUT University, a geographically remote Finnish institution committed to climate leadership. Using a detailed, trip-by-trip data collection method, the study achieved improved accuracy and completeness in emissions reporting across multiple travel modes and accommodation types. The findings revealed that although SuSci staff represent 5% of the university workforce, their travel emissions accounted for only 3% of the total, with notably lower reliance on air travel and private vehicles, and higher use of low-carbon transport options. There is also indication of a strong willingness among these green academics to adopt progressive and accelerated climate actions. These insights have practical implications for institutional policy development, particularly in aligning travel behaviour with climate neutrality goals. This is particularly relevant as the current world of academia sees significant misalignment. However, limitations include incomplete data for some travel categories and the challenge of generalizing departmental findings to the broader university context. Future research should expand the scope to include commuting and student travel, refine emissions data collection systems, and explore behavioural interventions that support sustainable travel choices across diverse university populations. This includes other geographical and cultural contexts. In doing so, there is also opportunity to enhance survey quality and incorporating lessons from obtained results.