


This study examines the role of green innovation strategy (GIS) and green innovation readiness (GIR), particularly technology readiness (TR), organizational readiness (OR), and environmental readiness (ER), in facilitating the implementation of green innovation (GI) and its subsequent impact on sustainable performance (SP). These readiness factors help organizations prepare for effective GI adoption and sustainability transition.
A quantitative research approach was employed to test two structural models using data from 286 respondents representing SMEs in tourist areas within the Yogyakarta Special Region. Structural Equation Modeling (SEM) was used to examine the effects of readiness factors on GI and sustainability performance.
The first model confirms that both GIS and GIR positively and significantly affect GI, which, in turn, has a significant positive impact on SP. The second model further demonstrates that TR, OR, and ER each have positive and significant effects on GI, which subsequently enhances environmental, economic, and social sustainability outcomes.
This study advances the literature by offering an integrated framework that simultaneously investigates GIS, GIR, GI, and SP within a single model. By focusing on tourism-based SMEs in a developing country context, this study provides new empirical insights into how strategic and readiness-based factors interact to support green innovation.
1. Introduction
Innovation drives industrial growth and economic development across countries (Lin, Wang, & Wu, 2022). However, rapid industrialization has also intensified environmental degradation, including pollution, resource depletion, and climate change (Hysa, Kruja, Rehman, & Laurenti, 2020; Sinha, Sengupta, & Alvarado, 2020). This has led to the increasing recognition of the need for more sustainable practices, with a particular focus on green innovation as a critical solution to balance economic growth and environmental protection. In recent years, industries have faced tremendous pressure to lower their carbon footprint and reduce their negative environmental impacts, such as the stock exchange and construction industries in China (Li, Su, Ding, Tian, & Wu, 2024; Yang, Zhang, Yang, Qin, & Wang, 2024), the automotive industry in the USA (Hasan et al., 2024), and agriculture in Malaysia (Raihan and Tuspekova, 2022). This phenomenon encourages organizations to focus on economic growth and take greater responsibility in terms of sustainability. Many organizations strive to improve economic performance, reduce environmental impacts, and positively contribute to society, which is called sustainability performance (Zhang, Sun, Yang, & Wang, 2020; Dalimunthe, Valeriani, Hartini, & Wardhani, 2020). Sustainability performance includes three main dimensions: environmental, social, and economic, known as the triple bottom line (Achmad, Prambudia, & Rumanti, 2023). To improve sustainability performance, companies in various industries have begun to adopt green innovation that combines environmentally friendly technologies with operational strategies to reduce negative environmental impacts while maintaining productivity and profits (Zhang, Sun, Yang, & Wang, 2020; Fernando, Jabbour, & Wah, 2019).
Green innovation has emerged as an essential approach to reducing negative environmental impacts while promoting sustainable growth (Zhang et al., 2020; Song & Yu, 2018; Ge et al., 2018). This concept refers to the development and implementation of environmentally friendly products, services, or processes that aim to reduce environmental damage and improve operational efficiency and long-term economic resilience. As described by Asadi et al. (2020) and Zhang (2020), green innovation is a systematic effort to apply technologies and strategies to reduce negative environmental impacts while strengthening corporate competitiveness and improving operational efficiency. Green innovation offers great potential to transform natural resource management and reduce environmental impacts, promoting sustainable economic growth (Asadi et al., 2020).
The tourism industry is a key sector that contributes significantly to global and national economies by generating revenue, creating employment opportunities, and driving infrastructure development (Croes, Ridderstaat, Bąk, & Zientara, 2021). However, tourism also exerts considerable environmental pressure, including increased carbon emissions, waste generation, and high energy consumption (Achmad, Prambudia, & Rumanti, 2023). Recognizing this, countries worldwide, including Indonesia, have prioritized sustainable tourism development. The tourism industry contributes significantly to economic growth but also generates environmental challenges such as carbon emissions, waste, and resource depletion (Achmad et al., 2023). Indonesia has prioritized sustainable tourism development due to its rich cultural and natural tourism potential (World Economic Forum, 2024). Yogyakarta, as one of Indonesia's major tourism destinations, plays an important role in supporting sustainable tourism initiatives through the Regional Tourism Development Master Plan (Government of Special Region of Yogyakarta, 2012). However, the rapid growth of tourism activities continues to create sustainability challenges, highlighting the need for effective green innovation implementation.
However, despite these promising prospects, effective and sustainable implementation of green innovations faces various complex challenges, especially in sectors with significant environmental impacts, such as the tourism industry (Lin et al., 2019; El-Kassar & Singh, 2019; Gürlek and Koseoglu, 2021). Implementing green innovation in the tourism sector represents an important strategy for addressing ongoing sustainability challenges (Abbas & Sağsan, 2019; Asadi et al., 2020). This involves adopting a green innovation strategy and ensuring readiness in three key areas: environmental, technological, and organizational (Zhang et al., 2020). Environmental readiness encompasses understanding and managing natural resources at tourist destinations (Zhang et al., 2020; Ramos, Ruiz-Pérez, & Alorda, 2021). Technological readiness involves incorporating eco-friendly technologies in tourism operations, such as renewable energy and energy-efficient solutions (Zhang et al., 2020; Kim, Lee, & Preis, 2020). Organizational readiness pertains to the willingness of tourism entities to embrace green innovation in their culture and processes, including changing business models and investing in training (Zhang et al., 2020; Dalimunthe et al., 2020). Green innovation readiness, including technological, organizational, and environmental dimensions, is essential for effective green innovation adoption and long-term sustainability (Zhang et al., 2020). By systematically evaluating these dimensions, organizations can proactively address gaps, enhance their innovation capacity, and maximize the benefits of green innovation for long-term sustainability (Song & Yu, 2018; Soewarno, Tjahjadi, & Fithrianti, 2019; Ramos et al., 2021).
This research brings significant novelty compared to previous studies that explored the topic of green innovation. Research from Asadi et al. (2020), Zhang et al. (2020), and Wang (2019) measures green innovation for sustainable business performance but not from readiness factors and green innovation strategy. Seeing the gap in research from several previous studies, this research explores green innovation strategy and the concept of green innovation readiness as critical factors that influence the successful implementation of green innovation, ultimately shaping sustainable performance in the tourism industry. While previous studies have examined the role of green innovation, there remains a limited understanding of how readiness factors—technology readiness, organizational readiness, and environmental readiness—act as enablers or barriers in the adoption process of green innovation.
This study examines how green innovation strategy and green innovation readiness contribute to green innovation implementation and sustainable performance. By integrating technological, organizational, and environmental readiness, the study explains how organizational preparedness shapes green innovation adoption and strengthens sustainability outcomes. The findings extend the green innovation literature by showing that successful implementation depends not only on external pressures and strategic initiatives but also on organizations' readiness to support sustainability practices. Focusing on the tourism sector, this study provides a holistic perspective on the role of readiness factors in enhancing or constraining green innovation effectiveness. The study also offers practical insights for businesses and policymakers in designing readiness-driven sustainability strategies to support long-term growth and resilience.
2. Theoretical and hypothesis development
2.1 Green innovation
Green innovation refers to the development and implementation of environmentally friendly products, processes, and practices that reduce environmental impacts while improving organizational performance and sustainability (El-Kassar & Singh, 2019; Khan, Kaur, Jabeen, & Dhir, 2021; Achmad and Wiratmadj, 2025). It includes initiatives such as energy efficiency, waste reduction, eco-friendly materials, and low-carbon technologies (Jermsittiparsert, Somjai, & Toopgajank, 2020). In the tourism sector, green innovation is increasingly important due to the industry's environmental impacts, including emissions, waste generation, and energy consumption. Prior studies suggest that successful green innovation implementation depends on organizational readiness and strategic orientation toward sustainability (Padilla-Lozano and Collazzo, 2022).
2.2 Green innovation strategy
Green innovation strategy focuses on the deliberate planning and policy formulation aimed at embedding green innovation into business operations. Green innovation strategy provides a structured approach for organizations to integrate sustainability objectives into their innovation processes, ensuring a proactive rather than reactive stance toward environmental challenges (Soewarno et al., 2019; Song & Yu, 2018). This strategy involves setting strategic sustainability goals, such as reducing carbon footprints, minimizing waste, and increasing energy efficiency. Additionally, green innovation strategy includes allocating resources for green research and development (R&D) by investing in eco-friendly technologies and sustainable production methods (Achmad, Zulkarnain, Rumanti, Wiratmadja, & Shuhidan, 2025).
2.3 Green innovation readiness
Green innovation readiness refers to an organization's preparedness to adopt and implement green innovation by ensuring that essential conditions, resources, and capabilities are in place (Asadi et al., 2020). According to Zhang et al. (2020), readiness is defined as the “preparation and sufficient conditions” required for successful innovation adoption. Green innovation readiness consists of three key dimensions: technology readiness, organizational readiness, and environmental readiness. Technology readiness refers to the availability and access to sustainable technologies, such as renewable energy systems, eco-friendly production processes, and digital tools that facilitate innovation (Zhang et al., 2020). Organizational readiness represents an organization's internal capacity to embrace innovation, including leadership commitment, employee competencies, operational flexibility, and a sustainability-driven corporate culture (Zhang et al., 2020). Environmental readiness encompasses external factors that support green innovation, such as government policies, regulatory frameworks, consumer demand for sustainability, and financial incentives (Zhang et al., 2020). Organizations with high green innovation readiness are better positioned to implement green innovation effectively, as they have both internal and external conditions conducive to sustainability-driven transformation.
2.4 Green innovation readiness and green innovation
Industries can optimize green innovation benefits through comprehensive readiness, which Zhang et al. (2020) define as the preparation and sufficient conditions required for an organization to successfully implement innovation. Readiness ensures that businesses possess the necessary resources, capabilities, and external support to facilitate green innovation adoption (Albort-Morant, Leal-Millán, & Cepeda-Carrión, 2016; Li, Huang, & Tong, 2021). Evaluating readiness before and during implementation is crucial, as it enables rapid business model development, enhances resource allocation, and strengthens core competencies (Xue, Boadu, & Xie, 2019; Tjahjadi, Agastya, Soewarno, & Adyantari, 2022). In the tourism industry, where sustainability challenges are particularly pressing, a structured approach to green innovation adoption is essential (Tjahjadi et al., 2022). Zhang et al. (2020) highlight that readiness consists of three interdependent dimensions: technology readiness, organizational readiness, and environmental readiness. Technology readiness ensures that businesses have access to sustainable technologies, such as renewable energy and eco-friendly transportation. Organizational readiness reflects an organization's ability to adapt its operational processes, corporate culture, and management practices to effectively integrate green innovation. Environmental readiness, on the other hand, refers to external enablers such as pro-environment regulations, consumer demand for sustainable practices, and market incentives that drive the adoption of green products and services. A high level of readiness across these dimensions creates the necessary conditions for industries, including tourism, to seamlessly and effectively embrace green innovation.
Lin et al. (2022) emphasize that environmental investment and technology readiness are key factors influencing the success of green innovation, as adequate financial and technological support significantly enhances an organization's ability to implement sustainability-driven innovations. Additionally, Zhang et al. (2020) examined how these readiness dimensions shape green innovation performance, finding that technological, organizational, and environmental readiness collectively influence a company's innovation capabilities. Beyond these factors, organizational learning plays a critical role in green innovation success, as it strengthens firms' ability to absorb and implement environmentally sustainable practices (Tu & Wu, 2021; Zhang, Sun, Yang, & Li, 2018). Tu and Wu (2021) further argue that green innovation fosters competitive advantage, particularly when organizations integrate it with continuous learning and adaptation strategies. Therefore, understanding and strengthening readiness factors is crucial for ensuring the effective implementation of green innovation and achieving long-term sustainability. Based on previous thoughts, the following hypothesis is proposed:
Green innovation readiness (GIR) positively affects green innovation (GI).
Technology readiness (TR) positively affects green innovation (GI).
Organization readiness (OR) positively affects green innovation (GI).
Environment readiness (ER) positively affects green innovation (GI).
2.5 Green innovation strategy and green innovation
Modern industries, facing environmental challenges and pressures, recognize the importance of environmentally friendly innovation for sustainable development and competitive advantages (Sun and Sun, 2021; Rui & Lu, 2021). A focus on a green innovation strategy enhances resources for eco-friendly products or processes, promoting green innovation within industries (Soewarno et al., 2019). This strategy integrates environmental, sustainability, and efficiency aspects into innovation processes (Lin, Cheah, Azali, Ho, & Yip, 2019; Zhang et al., 2020), aiming to develop environmentally friendly products, services, or processes that improve sustainability performance and reduce negative environmental impacts (Zhang et al., 2020). Green innovation strategies support both business interests and environmental goals, such as reducing carbon emissions, saving resources, and preserving ecosystems (Asadi et al., 2020; Song & Yu, 2018; Ge et al., 2018). Acting as a catalyst, these strategies enable organizations to proactively foster eco-friendly innovations, creating a conducive environment and alleviating government-imposed regulatory pressures (Wang, 2019; Cao & Chen, 2019; Albort-Morant et al., 2016).
Song and Yu (2018) states that a green innovation strategy positively influences an organization's environmental image and creativity in addressing environmental issues. The research establishes a positive relationship between the environmental image of an organization and creativity, with this creativity positively impacting sustainable innovation development. Soewarno et al. (2019) findings suggest that organizations adopting green innovation strategies proactively have enhanced opportunities for developing eco-friendly products and services. These strategies encourage the pursuit of sustainable and efficient solutions in operations, fostering a culture of innovation and motivating professionals to create greener products. Effective implementation of green innovation strategies in industries, as concluded by Asadi et al. (2020), tends to reduce the environmental impact of production processes. This reduction is achieved through prioritizing energy efficiency, sustainable use of raw materials, and improved waste management (Asadi et al., 2020; Song & Yu, 2018), leading to decreased carbon emissions and other negative environmental impacts. Based on previous thoughts, the following hypothesis is proposed:
Green innovation strategy (GIS) positively affects green innovation (GI).
2.6 Green innovation and sustainable performance
Innovation in organizations supporting business goals and strategic competitiveness is very important. Likewise, environmentally friendly innovation is likely to positively impact company performance and comprehensive benefits derived from developing environmentally friendly products, increasing operational efficiency, and increasing managerial effectiveness (Sobaih, Hasanein, & Elshaer, 2020). In addition, environmentally friendly processes and product innovation not only minimize the negative impact of business on the environment but also improve organizations' social and financial performance by minimizing costs and waste (Weng, Chen, & Chen, 2015). Moreover, green innovation is considered a key tool for the successful performance of their businesses (Khalid, Ahmad, Ramayah, Hwang, & Kim, 2019; El-Kassar & Singh, 2019) to achieve their green goals. There is empirical evidence that green innovation has a positive effect on sustainable performance (Asadi et al., 2020; Wang & Juo, 2021; Kraus, Rehman, & García, 2020). Research from Kraus et al. (2020) shows that green innovation can positively improve environmental performance and significantly mediate between corporate social responsibility and environmental performance. Weng et al. (2015) emphasized that innovation and technology transfer can sometimes reduce environmental impact. Research from Asadi et al. (2020) stated the importance and potential of environmentally friendly innovation in driving sustainable performance in the hotel industry. Abbas & Sağsan's (2019) research found that companies that actively implemented green innovation experienced reduced operational costs, increasing their profitability. Green innovation often involves energy efficiency, better waste management, and more sustainable raw materials. This leads to reduced operational costs, an essential factor in sustainable performance. Based on previous thoughts, the following hypothesis is proposed:
Green innovation (GI) positively affects sustainable performance (SP)
Green innovation (GI) positively affects environment sustainability (ENS)
Green innovation (GI) positively affects economic sustainability (ECS)
Green innovation (GI) positively affects social sustainability (SOS)
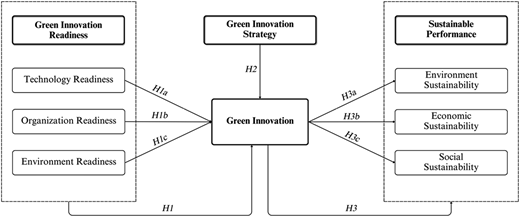
Based on the hypothetical explanation in the paragraph above, which explains the role of green innovation strategy and readiness in the tourism industry and how green innovation will influence sustainable performance. So, the entire formulation of the hypothesis in this research can be seen in Figure 1.
3. Methodology
3.1 Sample and data collection
Quantitative research methods are the optimal choice when the primary goal of the research is to recognize significant relationships between the variables involved. Data were collected using a structured questionnaire. The target population for this research consists of SMEs located around tourist areas. The sampling process focused on SMEs operating in the tourism sector, which were selected based on their direct involvement in providing products and services to tourists. Since the total population of SMEs engaged in tourism-related activities in Yogyakarta is unknown, this study employed non-probability sampling, specifically purposive sampling. According to Purwono, Ulya, Purnasari, and Juniatmoko (2019), purposive sampling is appropriate when the exact population size is unavailable, allowing researchers to select respondents based on specific characteristics relevant to the study. This study specifically targeted SMEs directly involved in tourism-related activities, ensuring that the collected data was contextually relevant and representative of the tourism sector's adoption of green innovation. Random sampling, in contrast, may have included SMEs that are not directly relevant to tourism, reducing data validity for hypothesis testing (Slater & Hasson, 2025). SMEs were chosen for their pivotal role in supporting the tourism ecosystem through various activities, including accommodation, transportation, food services, and cultural or entertainment experiences. These SMEs contribute significantly to the overall value chain of tourism by offering localized and diversified services that enhance the tourist experience (Achmad et al., 2023). The process of reaching respondents involved collaboration with local SME associations and the Department of Tourism, which provided access to SMEs around tourism areas. Yogyakarta, located in Indonesia on the island of Java, is a Special Region known for its rich cultural heritage and significant tourism potential. It is one of the major tourist destinations in Indonesia, attracting both domestic and international visitors. Yogyakarta offers a range of tourism experiences, including cultural, natural, and religious tourism, making it a key area for studying the impact of tourism on sustainability. Its unique geographical location and the diversity of its attractions make it an ideal setting for exploring how green innovation affects sustainable performance in the tourism industry.
Data were collected from February to November 2023 using online and offline questionnaires distributed to tourism SMEs. Of 286 questionnaires, 283 valid responses were obtained, yielding a 98.95% response rate. The high response rate in this survey was achieved through an effective questionnaire distribution strategy and a structured follow-up approach. The questionnaire was distributed online via digital platforms, email, and offline via direct communication with SME owners and managers in collaboration with local tourism business associations. This approach increased the study's credibility and encouraged the participation of respondents who felt the topic was relevant to their industry. In addition, a sufficient data collection period and a systematic follow-up strategy, such as reminders via email, phone calls, and in-person visits, ensured that participants who initially did not respond were encouraged to participate. This personalized approach significantly reduced the non-response rate and increased the overall survey completion rate. A sample size of 283 respondents was deemed appropriate following Hair, Risher, Sarstedt, and Ringle (2019) recommendation of ten times the highest number of structural paths in the model.
The questionnaire was distributed to SMEs leaders using a 6-point Likert scale or even numbers, with the number 1 being “strongly disagree” and 6 being “strongly agree” (Hair et al., 2019). Researchers avoid odd questionnaires to avoid biased answers with neutral categories (Hair et al., 2019). Complete details regarding the target and sample SMEs, as well as characteristics of respondents, are presented in Table 1. In determining the sample size, this research followed the guidelines suggested by Hair et al. (2019), using ten times the highest number of structural paths leading to a specific latent construct in the structural model.
Characteristic of respondent
| Characteristic | Number of respondents (n = 283) | (%) |
|---|---|---|
| Type of SMEs | ||
| Food and beverage | 87 | 30.74% |
| Transportation and accommodation | 45 | 15.90% |
| Craft | 53 | 18.73% |
| Fashion clothing | 53 | 18.73% |
| Market for antique | 8 | 2.83% |
| Art and performing | 37 | 13.07% |
| Gender | ||
| Male | 204 | 72.08% |
| Female | 79 | 27.92% |
| Age of SMEs | ||
| 1–10 years | 56 | 19.79% |
| 11–20 years | 129 | 45.58% |
| 21–30 years | 44 | 15.55% |
| 31–40 years | 35 | 12.37% |
| ≥40 years | 19 | 6.71% |
| Respondent's Age | ||
| <20 years | 9 | 3.18% |
| 20–25 years | 42 | 14.84% |
| 26–30 years | 69 | 24.38% |
| 31–35 years | 44 | 15.55% |
| 36–40 years | 56 | 19.79% |
| ≥40 years | 63 | 22.26% |
| Number of Workers | ||
| <5 workers | 23 | 8.13% |
| 6–10 workers | 42 | 14.84% |
| 11–15 workers | 66 | 23.32% |
| 16–20 workers | 122 | 43.11% |
| 21–25 workers | 21 | 7.42% |
| ≥25 workers | 9 | 3.18% |
| Product sales region | ||
| Nasional | 235 | 83.04% |
| Global | 48 | 16.96% |
3.2 Instrument development
This research develops the model presented in Figure 1. Each construct and its operationalization are clearly defined, with details on how each item was measured and incorporated into the structural model. Two models will be tested in this research. The first model measures the impact of GIR and all its dimensions (TR, OR, and ER) and GIS on GI. Furthermore, this research also describes the impact of GI on SP and all its dimensions (ENS, ECS, and SOS). In addition, a second model of each dimension of each construct was also examined. In this research, the data used is based on the results of distributing and filling out qualitative questionnaires. The statement items in the questionnaire were selected based on careful elaboration and literature review. The research instrument has previously been tested by academics with expertise in the tourism sector, SME coordinators, and tourism coordinators. The main goal is to remove imprecise wording and simplify the administration of the instrument.
The independent variables include GIR and GIS. GIS is assessed with 6 question items focusing on organizations' use of green innovation strategies in operational processes (Asadi et al., 2020; Soewarno et al., 2019). GIS, also with three dimensions (TR, OR, ER), comprises 16 question items (Zhang et al., 2020; Jun, Ali, Bhutto, Hussain, & Khan, 2021). Dependent variable, GI is assessed with 7 question items (Asadi et al., 2020; Soewarno et al., 2019). SP, measured through three dimensions (ENS, ECS, SOS), evaluates sustainable tourism performance. ENS assesses the environmental impact with 5 statement items, ECS gauges economic impact with 5 statement items, and SOS evaluates social impacts with 5 statement items (Shahzad et al., 2021). This holistic approach covers environmental, economic, and social aspects in measuring sustainability integration into tourism performance. The measurement items are provided in Appendix A.
4. Result
This research employs Partial Least Squares Structural Equation Modeling (PLS-SEM) to assess the model. PLS-SEM was employed due to its suitability for exploratory models, non-normal data, and complex structural relationships (Hair et al., 2019). PLS-SEM involves two critical stages: the measurement model stage and the structural model stage, both requiring thorough evaluation to ensure analysis validity and reliability (Hair et al., 2019).
4.1 Assessment of the measurement model
The measurement model serves as an intermediary stage that illustrates the connection between indicators and constructs (Hair et al., 2019). The assessment of the measurement model in the initial form of a reflective model involves four key stages: namely internal consistency evaluation, indicator reliability evaluation, convergent validity evaluation, and discriminant validity evaluation.
Internal Consistency Evaluation in this study, assessed through Cronbach's Alpha and Composite Reliability, confirms satisfactory consistency within the measurement model (Hair et al., 2019). For reliability indicators, outer loading values below 0.4 warrant exclusion, while values equal to or exceeding 0.7 are considered outstanding. The assessment in this study adheres to these criteria (Hair et al., 2019). The subsequent evaluation is convergent validity, where the instrument is deemed valid if the Average Variance Extracted (AVE) result is > 0.5 (Hair et al., 2019). Discriminant validity evaluation is the next stage, utilizing cross-loading values and the Fornell-Larcker criterion, both of which demonstrate that all constructs meet the criteria. All criteria are met properly (Hair et al., 2019). The results of the measurement model assessment are detailed in Tables 2–3.
Constructs' reliability and convergent validity
| Latent construct | Item | Outer loading | Cronbach's alpha | Composite reliability | AVE |
|---|---|---|---|---|---|
| Green innovation readiness (GIR) | |||||
| Technology Readiness (TR) | TR1 | 0.729 | 0.821 | 0.864 | 0.516 |
| TR2 | 0.790 | ||||
| TR3 | 0.691 | ||||
| TR4 | 0.613 | ||||
| TR5 | 0.782 | ||||
| TR6 | 0.690 | ||||
| Organization Readiness (OR) | OR1 | 0.850 | 0.835 | 0.744 | 0.503 |
| OR2 | 0.937 | ||||
| OR3 | 0.420 | ||||
| Environment Readiness (ER) | ER1 | 0.842 | 0.873 | 0.907 | 0.662 |
| ER2 | 0.746 | ||||
| ER3 | 0.887 | ||||
| ER4 | 0.841 | ||||
| ER5 | 0.741 | ||||
| Green Innovation Strategy (GIS) | GIS1 | 0.789 | 0.732 | 0.816 | 0.505 |
| GIS2 | 0.701 | ||||
| GIS3 | 0.583 | ||||
| GIS4 | 0.755 | ||||
| GIS5 | 0.590 | ||||
| Green Innovation (GI) | GI3 | 0.561 | 0.755 | 0.838 | 0.514 |
| GI4 | 0.606 | ||||
| GI5 | 0.776 | ||||
| GI6 | 0.844 | ||||
| GI7 | 0.757 | ||||
| Sustainable Performance (SP) | |||||
| Environment Sustainability (ENS) | ENS1 | 0.674 | 0.780 | 0.849 | 0.531 |
| ENS2 | 0.727 | ||||
| ENS3 | 0.806 | ||||
| ENS4 | 0.785 | ||||
| ENS5 | 0.639 | ||||
| Economic Sustainability (ECS) | ECS1 | 0.791 | 0.810 | 0.869 | 0.573 |
| ECS2 | 0.839 | ||||
| ECS3 | 0.809 | ||||
| ECS4 | 0.720 | ||||
| ECS5 | 0.599 | ||||
| Social Sustainability (SOS) | SOS2 | 0.781 | 0.723 | 0.825 | 0.542 |
| SOS3 | 0.726 | ||||
| SOS4 | 0.664 | ||||
| SOS5 | 0.769 | ||||
4.2 Assessment of the structural model
Path coefficients from PLS-SEM results, with associated p-values and t-statistics, undergo testing for the research hypothesis using a two-tailed bias-corrected Accelerated Bootstrap method, with a predetermined significance level of 0.05. Accelerated bootstrapping, employing 5,000 subsamples, quickly generates samples to estimate the sampling distribution of model parameters (Hair et al., 2019). Hypothesis validation depends on a t-value exceeding 1.96 and a p-value below 0.05; otherwise, it is rejected (Hair et al., 2019). Table 4 presents the outcomes of the structural model, where statistically significant path coefficients between dependent and independent variables indicate hypothesis validation.
Hypotheses results
| Hypotheses | Model 1 | Model 2 | p value | Result | |||
|---|---|---|---|---|---|---|---|
| β value | T-values | β value | T-values | ||||
| H1 | GIR → GI | 0.257 | 4.024 | – | – | 0.000 | Accepted |
| H1a | TR → GI | – | – | 0.141 | 2.066 | 0.047 | Accepted |
| H1b | OR → GI | – | – | 0.178 | 2.502 | 0.030 | Accepted |
| H1c | ER → GI | – | – | 0.148 | 2.120 | 0.034 | Accepted |
| H2 | GIS → GI | 0.519 | 8.802 | 0.546 | 10.302 | 0.000 | Accepted |
| H3 | GI → SP | 0.473 | 7.466 | – | – | 0.000 | Accepted |
| H3a | GI → ENS | – | – | 0.355 | 5.295 | 0.000 | Accepted |
| H3b | GI → ECS | – | – | 0.276 | 4.099 | 0.000 | Accepted |
| H3c | GI → SOS | – | – | 0.341 | 5.247 | 0.000 | Accepted |
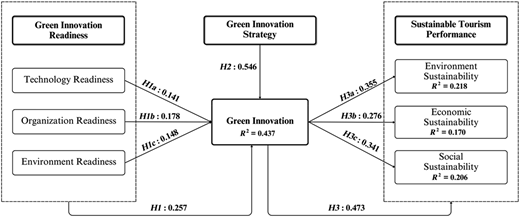
Model 1 shows that all hypotheses (H1, H2, and H3) proposed in this research are supported. GIR has a positive effect on GI (β = 0.257, t-value = 4.024, p < 0.05). Besides that, GIS also positively affects GI (β = 0.519, t-value = 8.802, p < 0.05). Conversely, GI positively and significantly influenced SP (β = 0.473, t-value = 7.466, p < 0.05). Model 2 shows that H1a, H1b, and H1c are accepted. TR has a significantly positive effect on GI (β = 0.141, t-value = 2.066, p < 0.05), OR has a significantly positive effect on GI (β = 0.178, t-value = 2.502, p < 0.05), and ER has a significant positive effect on GI (β = 0.148, t-value = 2.120, p < 0.05). H2 is also proven and accepted that GIS has a positive effect on GI. In the end, GI was significantly and positively related to ENS (β = 0.355, t-value = 5.295, p < 0.05), ECS (β = 0.276, t-value = 4.099, p < 0.05), and SOS (β = 0.341, t -value = 5.247, p < 0.05). Thus, model 2 in this research is supported by H3a, H3b, and H3c.
Model quality was evaluated using VIF, R2, and Q2 values. First, the VIF of the latent variable is acceptable because it is less than 5, thus indicating the absence of multicollinearity. Therefore, the measurement model is satisfactory (Hair et al., 2019)—second, R2 adjustment. GI (43.7%), STD (26.5%), and SOS (29.6%) have R2 values ≥ 0.50. These values indicate acceptable explanatory power (Hair et al., 2019). Meanwhile, ENS (21.8%) and ECS (17.0%) have an R2 value < 0.25. Therefore, it is considered weak in explaining the variability of endogenous variables. Third, a Q2 value above 0 indicates prediction accuracy (Hair et al., 2019). The results of testing the quality of the model are presented in Table 5, and Figure 2 presents the research model, which describes the structural relationship between all hypotheses that have a significant relationship with the dependent and independent variables.
5. Discussion
This research investigates the relationship between GIS and GIR in the context of applying GI, also exploring the impact of GI on SP in the tourism industry. The findings indicate a positive influence of GIR on GI, with each GIR dimension (TR, OR, and ER) contributing positively to GI (β values: 0.141, 0.178, and 0.148). These results support Hypothesis 1 (p < 0.05), consistent with previous studies by Zhang et al. (2020) and Jun et al. (2021), and emphasize the importance of multidimensional readiness in facilitating green transformation in SMEs. From a theoretical perspective, this study reinforces the conceptual framework that a high level of GIR, which encompasses technological, organizational, and environmental components, significantly contributes to GI implementation. The results (β = 0.257, t = 4.024, p < 0.05) validate the notion that when SMEs are better prepared internally and externally, they can adopt GI more effectively, supporting the views of Pigosso, Schmiegelow, and Andersen (2018) and Fridgeirsson, Ingason, and Onjala (2023). Each readiness dimension was also tested individually (H1a, H1b, H1c), showing positive and significant relationships: TR (β = 0.141, t = 2.066), OR (β = 0.178, t = 2.502), and ER (β = 0.148, t = 2.120). These findings highlight that readiness is not a singular construct but an integrated system that enables strategic innovation adoption. In terms of practical implications, these findings suggest that policymakers and practitioners in the tourism sector should invest in the technological infrastructure, build internal capabilities, and strengthen external support systems to accelerate the adoption of green innovation. For example, OR reflects the organization's internal environment, including culture and management, which must support innovation (Zhang et al., 2020; Jun et al., 2021). ER is especially critical in Yogyakarta, where tourism depends on environmental and cultural preservation, such as waste management programs, eco-friendly transportation, and sustainable resource use. This finding reinforces the importance of ER in fostering green innovation in regions where tourism relies heavily on environmental preservation.
H2 proposes a positive relationship between GIS and GI, which is empirically supported (β = 0.519, t-value = 8.802, p < 0.05) and consistent with Ge et al. (2018), indicating that GIS implementation promotes green practices. The high β and t-values demonstrate that a well-formulated green innovation strategy significantly enhances green innovation adoption and supports the alignment of strategic initiatives with sustainability goals. Gao, Sun, Yuan, Xue, and Sheng (2021) and Soewarno et al. (2019) also highlight capital investment and technology as important drivers of environmentally friendly practices among SMEs. The findings confirm that strategic planning for green innovation strengthens organizations' ability to integrate sustainable practices. Practically, a formalized GIS through policies, resource allocation, and sustainability-oriented R&D enables tourism SMEs in Yogyakarta to adopt eco-friendly practices such as waste management, renewable energy use, and sustainable accommodations. These findings emphasize the important role of GIS in supporting both business performance and environmental sustainability in the tourism industry.
H3 proposes that GI is positively related to SP. Based on hypothesis testing, H3 in this research is supported and shows a positive relationship between GI and SP (β = 0.473, t-value = 7.466, p < 0.05). This statistically significant relationship (p < 0.05) illustrates that green innovation enhances sustainability performance across environmental, economic, and social dimensions. Organizations that prioritize environmentally oriented innovation are more likely to design and utilize resources for sustainable processes and products, aligning with previous findings by Asadi et al. (2020). In the context of tourism, such practices include improving energy efficiency, managing waste responsibly, and integrating renewable resources. These not only reduce environmental impact but also attract environmentally conscious tourists, reinforcing earlier research by Wang, Wang, and Chang (2022) on the economic advantages of green practices. The validation of Hypothesis 3 is further supported through sub-hypotheses H3a, H3b, and H3c. H3a confirms a positive relationship between GI and ENS (β = 0.355, t = 5.295, p < 0.05), with GI practices such as recycling, pollution control, and energy efficiency proving integral to environmental performance (Cherrafi et al., 2018; Shahzad et al., 2021). This affirms that adopting green innovation is not only a reactive response to regulations but a proactive strategy for reducing ecological footprints and improving long-term ecological resilience. H3b establishes that GI positively affects ECS (β = 0.276, t = 4.099, p < 0.05), as it leads to cost savings, improved resource utilization, product differentiation, and enhanced competitiveness (Aguilera-Caracuel & Ortiz-de-Mandojana, 2013; Zhang & Ma, 2021; Vasileiou, Georgantzis, Attanasi, & Llerena, 2022). These findings are particularly important for SMEs in the tourism sector, where innovation-driven differentiation and efficiency can significantly improve operational margins and customer value. H3c confirms the link between GI and SOS (β = 0.341, t = 5.247, p < 0.05), with GI fostering social benefits such as community engagement, support for local livelihoods, and inclusive participation in sustainability efforts (Shahzad et al., 2021; Razzaq, Fatima, & Murshed, 2023). Theoretically, this study contributes to the body of knowledge by empirically validating the multidimensional impact of GI on sustainability, offering robust evidence that GI serves as a central construct in achieving holistic sustainable development within SMEs, particularly in tourism. It highlights the role of innovation readiness and strategic intent as key enablers that amplify the impact of GI on environmental, economic, and social goals. Practically, the findings suggest that tourism-based SMEs should not view GI merely as an environmental obligation, but as a strategic investment that can drive long-term performance. Through initiatives like eco-tourism, sustainable operations, and green certification, SMEs can reduce costs, gain competitive advantages, and contribute meaningfully to community welfare and destination resilience. These implications are particularly relevant in regions like Yogyakarta, where tourism is closely linked with ecological and cultural preservation.
6. Conclusion
The tourism industry, crucial for global economic growth, often brings negative environmental impacts. This study investigates the role of GIR and GIS in driving the adoption of GI and its impact on SP in the tourism sector. By refining the research objective, this study specifically examines how different dimensions of readiness—technological, organizational, and environmental—interact to shape green innovation adoption and sustainability outcomes. The study confirms the hypotheses, showing that both GIS and GIR positively influence the adoption of GI, which in turn enhances Sustainable Performance SP in the tourism sector. The results highlight the positive and significant impact of green innovation strategy and readiness, particularly in technological, organizational, and environmental aspects. These findings highlight the significant contribution of green innovation in promoting sustainability within the tourism industry, particularly through the integration of environmentally friendly practices by SMEs.
Theoretical contributions of this research enhance understanding of the relationship between green innovation readiness and green innovation, confirming that readiness and strategy are key drivers of GI in the tourism sector. The study demonstrates how technological, organizational, and environmental readiness facilitate or hinder green innovation adoption and highlights the positive impact of GI on sustainable tourism performance. Practically, the findings emphasize the importance of readiness and strategic initiatives in implementing green innovation within Yogyakarta's tourism sector. SMEs can improve operational efficiency and reduce environmental impacts through green technologies such as renewable energy and efficient water systems. The study also provides implications for policymakers by encouraging sustainable tourism policies, fiscal incentives, technical guidance, and support programs that promote green innovation adoption. For SMEs, assessing technological, organizational, and environmental readiness can support the gradual integration of sustainable practices, including energy efficiency, waste reduction, and sustainable resource use. Through phased green innovation adoption, SMEs can reduce operational costs, strengthen competitiveness, and attract environmentally conscious tourists while supporting regional sustainability goals.
Despite its contributions, this study has several limitations. First, the research is limited to the Yogyakarta Special Region, which may restrict the generalizability of the findings to other tourism destinations with different conditions. Second, the cross-sectional design limits the ability to establish causal relationships between green innovation readiness, strategy, and sustainable performance. Future studies should adopt longitudinal or experimental approaches to examine these relationships over time. Finally, this study does not investigate the long-term consequences of green innovation adoption. Future research is encouraged to explore its long-term impact on competitiveness, financial performance, and organizational resilience in the tourism sector.
The supplementary material for this article can be found online.

