This study examines the association between the presence of a sustainability committee and corporate social responsibility (CSR) performance. It further investigates whether sustainability-linked CEO compensation contracts, firm-level stakeholder engagement, and sustainability reporting quality mediate this relationship. In addition, the study explores how sustainability committee characteristics influence CSR performance.
Using a novel dataset of 27,966 US firm-year observations, this study employs ordinary least squares regression and mediation analysis to estimate the research models. The study also applies robustness checks to address potential endogeneity concerns.
The results indicate that firms with a sustainability committee exhibit superior CSR performance. Moreover, our findings are consistent with sustainability-linked CEO compensation, firm-level stakeholder engagement, and sustainability reporting quality serving as important pathways through which sustainability committees are associated with CSR performance. We also find that sustainability committee effectiveness varies with committee composition and characteristics. Specifically, larger committees, greater female representation, longer member tenure, stronger educational qualifications, and overlap with the audit committee are associated with higher CSR performance, whereas higher average member age is associated with lower CSR performance. These findings highlight the importance of a sustainability committee, associated CSR-focused governance mechanisms, and the composition of the committee in shaping firms’ CSR performance.
The findings provide insights for regulators, investors, and corporate governance practitioners, emphasizing the need to consider CSR-focused governance channels and sustainability committee structures when evaluating corporate social responsibility efforts.
This study contributes to the growing literature on corporate sustainability governance by providing empirical evidence on how a sustainability committee and its characteristics influence CSR performance, offering practical implications for firms seeking to enhance sustainability oversight.
1. Introduction
This study investigates whether the presence of a sustainability committee influences corporate social responsibility (CSR) performance and explores the corporate governance (CG) mechanisms through which such an effect may occur. It further examines whether specific attributes of a sustainability committee are associated with variations in CSR performance. Although prior research has explored the link between the presence of a sustainability committee and CSR-related outcomes, the existing literature exhibits several shortcomings. First, earlier studies report mixed findings regarding the effectiveness of a sustainability committee in enhancing CSR performance (e.g. Burke et al., 2019; Dixon-Fowler et al., 2017; Driss et al., 2024; Rodrigue et al., 2013). Despite this lack of consensus, the voluntary adoption of a sustainability committee has increased substantially over time. For instance, Spencer Stuart (2018) reported that 18% of S&P 500 firms had a sustainability committee, whereas Paine (2014) noted that 10% of US public firms had one [1]. Moreover, much of the prior US-based literature has not adequately addressed endogeneity concerns, largely documenting correlations rather than establishing causal relationships between a sustainability committee presence and CSR outcomes (Burke et al., 2019; Dixon-Fowler et al., 2017; Walls et al., 2012). These inconsistent findings and methodological shortcomings highlight the need for a re-examination of this relationship using a large-scale longitudinal dataset that allows for more rigorous treatment of endogeneity and stronger causal inference.
Second, prior research has rarely investigated the mechanisms through which a sustainability committee influences CSR-related outcomes. Recent CG scholars maintain that an individual CG element is ineffective in solitude and requires the deployment of associated mechanisms to affect the desired outcome variable (e.g. Post and Byron, 2015; Walls et al., 2012). Thus, there is a need for a theoretically informed understanding of the CG mechanisms that enable a sustainability committee to fulfill its strategic, monitoring, and resource-provision roles more effectively. To this end, we focus on three mechanisms: the inclusion of sustainability targets in CEO compensation contracts, the presence of active firm-level stakeholder engagement programs, and the quality of sustainability reporting as these mechanisms are categorized as CSR-focused CG elements (Abweny et al., 2025). Previous studies also have separately documented the influence of a sustainability committee on the adoption of these mechanisms (e.g. Al-Shaer and Zaman, 2019; Paine, 2014; Roy, 2009; Saha et al., 2025) and the effects of these mechanisms on CSR-related outcomes (e.g. Derchi et al., 2023; Mahmoudian et al., 2021; Qian and Schaltegger, 2017). However, empirical evidence remains limited regarding whether a sustainability committee utilizes these mechanisms to enhance its effectiveness and, in turn, improve CSR performance.
Finally, despite the growing literature on sustainability committees, relatively few studies, particularly in the US context, have examined how sustainability committee member characteristics influence CSR performance (e.g. Javeed et al., 2022; Kuzey et al., 2021; Rodrigue et al., 2013; Walls et al., 2012). Committee member characteristics shape the human capital, expertise, and decision-making dynamics of the committee, which in turn affect its effectiveness (Kolev et al., 2019). Consequently, a more comprehensive examination of sustainability committee characteristics is needed to enhance our understanding of how these attributes contribute to CSR performance.
We based our prediction on stakeholder (Donaldson and Preston, 1995; Freeman et al., 2010), agency (Jensen and Meckling, 1976) and resource dependence (Pfeffer and Salancik, 2003) theories as a single theory cannot accommodate the multi-dimensional roles played by a sustainability committee (Aguilera et al., 2007; Hussain et al., 2018; Peters and Romi, 2014). These theories together suggest that a sustainability committee, both directly and indirectly—through CSR-focused governance mechanisms and the human capital of its members—strives to enhance CSR performance by balancing the divergent interests of multiple stakeholders through its advisory, monitoring, and resource-provision roles.
Using a sample of 27,966 US firm-year observations from 2001–2018, we find that firms with a sustainability committee have higher CSR performance. We also document evidence consistent with CSR-focused governance mechanisms—the inclusion of sustainability-related targets in CEO compensation contracts, the presence of active firm-level stakeholder engagement programs and sustainability reporting quality—acting as mediating pathways in the positive association between the presence of a sustainability committee and CSR performance. These results suggest that it is through these mechanisms that a sustainability committee contributes to the improvement of CSR performance. Furthermore, we show that committee size, the proportion of female committee members, committee members’ tenure and qualifications, and sustainability committee members holding audit committee positions are positively associated with CSR performance, while the age of committee members is negatively associated with CSR performance. We apply a lead–lag approach in all our regression specifications. Our results are robust after employing the propensity score matching (PSM) technique and Heckman's (1979) two-stage analysis to address endogeneity arising from observable and unobservable selection bias; two-stage instrumental variable analysis to address endogeneity concerns arising from reverse causality; and alternative measures of CSR performance.
Our study's contributions to sustainability governance literature are mainly threefold. First, we extend US-based research examining the relationship between a sustainability committee and CSR outcomes (e.g. Burke et al., 2019; Dixon-Fowler et al., 2017; Rupley et al., 2012; Walls et al., 2012) by providing more rigorous evidence drawn from a large longitudinal dataset. Prior studies have yielded mixed findings, with some reporting no significant association (Rupley et al., 2012) and others documenting positive relationships (Burke et al., 2019; Dixon-Fowler et al., 2017; Walls et al., 2012). However, these studies were largely confined to samples of large firms (e.g. S&P 500 firms) (Dixon-Fowler et al., 2017; Walls et al., 2012) and did not adequately address endogeneity concerns (Burke et al., 2019; Dixon-Fowler et al., 2017; Walls et al., 2012). Consequently, prior research established correlations rather than causal relationships. In contrast, the breadth of our dataset enables the use of a lead–lag research design and the application of Heckman's (1979) two-step procedure and propensity score matching (PSM) to address endogeneity, thereby providing stronger evidence consistent with a causal interpretation.
Secondly, our study extends the literature examining the association between sustainability committees and CSR-related outcomes by providing evidence consistent with the mediating roles of three CSR-focused governance mechanisms: the inclusion of sustainability targets in CEO compensation contracts, the presence of active firm-level stakeholder engagement programs, and the quality of sustainability reporting (Abweny et al., 2025). Prior studies have separately examined the association between sustainability committees and the adoption of these mechanisms (e.g. Al-Shaer and Zaman, 2019; Paine, 2014; Roy, 2009; Saha et al., 2025), as well as the association between these mechanisms and CSR-related outcomes (e.g. Derchi et al., 2023; Mahmoudian et al., 2021; Qian and Schaltegger, 2017). However, limited evidence exists on whether these mechanisms serve as pathways through which sustainability committees are associated with CSR performance. By explicitly examining these governance mechanisms within a unified empirical framework, our study provides new insights into the potential channels through which sustainability committees may be linked to enhanced CSR performance.
Third, we contribute to the growing body of literature on the impact of sustainability committee characteristics on CSR-related outcomes (e.g. Gull et al., 2024; Jarboui et al., 2022) by leveraging a large longitudinal US dataset and examining the effects of a broader range of sustainability committee characteristics—such as members’ age—on CSR performance. Beyond its theoretical contributions, our study offers practical implications for regulators, policymakers, managers, boards of directors, and non-governmental organizations by informing the design and implementation of a more effective sustainability committee and related governance mechanisms to shape CSR performance.
The remainder of the paper is organized as follows. Section 2 delves into the theoretical framework, literature review and development of hypotheses. Section 3 provides a detailed description of the research methodology employed in our study, while Section 4 discusses empirical findings. Section 5 presents the results of the additional analyses and robustness checks. The final section, Section 6, concludes the paper.
2. Theoretical framework, literature review and hypotheses development
2.1 Theoretical framework
Existing empirical studies investigating the association between the presence of a sustainability committee and CSR-related outcomes have employed a multi-theoretical framework (e.g. Dixon-Fowler et al., 2017; Hussain et al., 2018; Peters and Romi, 2014). Peters and Romi (2014) and Hussain et al. (2018), in arguing that a multi-theoretical framework is more appropriate, state that one theory may not fully explain the interrelationships between the presence of a sustainability committee and CSR disclosures. These researchers used stakeholder (Freeman, 2010), agency (Jensen and Meckling, 1976) and resource dependence (Pfeffer and Salancik, 2003) theories together to inform their hypotheses. Following this literature, the current study uses these three overlapping and complementary theories to inform its hypotheses.
Stakeholder theory conceptualizes corporate governance (CG) as a mechanism for strategically managing the often-divergent interests of multiple stakeholders (Cornell and Shapiro, 1987; Freeman, 2010). Within this framework, a sustainability committee plays a pivotal role in facilitating stakeholder engagement, allowing firms to identify and address CSR-related concerns and expectations (Peters and Romi, 2014). This engagement, in turn, can enhance CSR performance by ensuring that corporate initiatives align with stakeholder priorities. Agency theory, which has been dominant in prior research on board committees (Kolev et al., 2019), frames a sustainability committee primarily as an instrument to support the development of CSR strategies and monitor their implementation (Berrone and Gomez-Mejia, 2009). By overseeing CSR activities, this committee helps align managerial decisions with both shareholder and broader stakeholder interests, thereby potentially improving CSR outcomes (Hillman and Dalziel, 2003). Finally, resource dependence theory offers a complementary perspective by highlighting the advisory and resource-provision roles of CG (Hillman and Dalziel, 2003; Pfeffer and Salancik, 2003). From this viewpoint, sustainability committee members are essential conduits for valuable resources and information and serve as strategic advisors to executive management (Peters and Romi, 2014). By leveraging these roles, committee members can support management in the design and implementation of CSR strategies, facilitate collaboration with diverse stakeholders, and ultimately contribute to improved CSR performance (de Villiers et al., 2011).
2.2 Literature review and hypotheses development
2.2.1 Sustainability committee and CSR performance
Stakeholder, agency and resource dependence theories in common predict that the presence of a board sustainability committee enhances CSR performance. Prior research into a sustainability committee finds support consistent with this prediction. Roy (2009) finds that most sustainability committee charters address key CSR areas, including environmental protection, government relations, community involvement, employment practices, philanthropy, and ethics. Paine (2014) further documents that the sustainability committee actively monitors sustainability performance, proposes alternatives, and advises boards on emerging CSR issues and innovation opportunities. Prior quantitative studies, with few exceptions (e.g. Burke et al., 2019; Rodrigue et al., 2013; Rupley et al., 2012), also evidence a significant positive association between the presence of a sustainability committee and CSR-related outcomes (e.g. Dixon-Fowler et al., 2017; Hussain et al., 2018; Orazalin, 2020; Peters and Romi, 2014). For example, Dixon-Fowler et al. (2017) find a positive relationship between the presence of a sustainability committee and corporate environmental performance (CEP) strengths in a sample of S&P 500 firms. Similarly, Driss et al. (2024) report that the presence of a sustainability committee is positively associated with corporate environmental disclosures in a global sample. Collectively, these findings suggest that a sustainability committee strengthens CSR performance. Accordingly, we propose the following hypothesis:
The presence of a sustainability committee is positively associated with CSR performance.
2.2.2 Sustainability committee and CSR performance: mediating role of inclusion of sustainability targets in CEO compensation contracts, the presence of active firm-level stakeholder engagement programs and the quality of sustainability reporting
A sustainability committee plays critical strategic, resource provision and performance monitoring roles for improving firms’ CSR performance. However, individual corporate governance mechanisms tend to be more effective when bundled with complementary mechanisms (Post and Byron, 2015)—and the same applies to a sustainability committee (Orazalin, 2020). In the following paragraphs, we develop our hypotheses on the mediating roles of the inclusion of sustainability targets in CEO compensation contracts, the presence of active firm-level stakeholder engagement programs and the improved quality of sustainability reporting in the association between the presence of a sustainability committee and CSR performance.
2.2.2.1 Sustainability committee, the inclusion of sustainability targets in CEO compensation contracts and CSR performance
While a sustainability committee designs CSR strategies and reviews performance, successful implementation ultimately depends on CEO commitment and action (Berrone and Gomez-Mejia, 2009; Derchi et al., 2023). From an agency theory perspective, linking CEO compensation to sustainability performance aligns managerial incentives with CSR objectives and motivates greater effort (Berrone and Gomez-Mejia, 2009; Flammer, 2015), while also facilitating a sustainability committee's monitoring by providing observable performance signals. From a stakeholder theory standpoint, CSR-linked pay further helps align managerial interests with those of stakeholders (Coombs and Gilley, 2005; Ikram et al., 2023). Accordingly, a sustainability committee is more likely to influence compensation committee to include CSR targets in CEO compensation packages—either directly or through the board—to improve CSR outcomes. Consistent with this view, prior evidence indicates that firms with a sustainability committee are more likely to adopt sustainability-based executive compensation (Al-Shaer and Zaman, 2019).
Prior research grounded in agency and stakeholder theory also shows that CSR-linked CEO compensation is positively associated with CSR performance (Derchi et al., 2023; Flammer, 2015; Ikram et al., 2023) and negatively associated with CSR decoupling (Abweny et al., 2025). For example, Flammer (2015) find that firms adopting CSR-linked pay experience increased social and environmental initiatives, lower emissions, and greater green innovation. These findings suggest that a sustainability committee may use CSR-linked compensation as a monitoring and incentive mechanism to motivate CEOs to improve CSR outcomes. Building on this evidence, we propose that the presence of a sustainability committee enhances CSR performance by encouraging the adoption of sustainability-based CEO compensation. We, therefore, propose the following hypothesis:
The inclusion of sustainability targets in CEO compensation contracts positively mediates the positive association between the presence of a sustainability committee and CSR performance.
2.2.2.2 Sustainability committee, the presence of active firm-level stakeholder engagement programs and CSR performance
Stakeholder theorists emphasize the centrality of stakeholder engagement in the development of strategic plans for CSR, the formulation of associated key performance indicators, and the assessment of CSR performance (Saha et al., 2025). As the sustainability committee is responsible for developing CSR strategies and monitoring progress toward their achievement (de Villiers et al., 2011), it is likely that such a committee actively engages with stakeholders to better understand their evolving CSR expectations and concerns. This engagement enables a sustainability committee to design more informed CSR strategies and strengthens its ability to perform monitoring roles by comparing strategic targets with actual performance (de Villiers et al., 2011; Saha et al., 2025).
Unsurprisingly, prior research shows that a sustainability committee frequently interacts with a wide spectrum of stakeholders to identify critical concerns, and subsequently uses this knowledge to design and implement sustainability strategies that address those concerns (Paine, 2014; Roy, 2009). For instance, Paine (2014) documents that Nike's sustainability committee frequently visited factories and engaged with labor unions to understand critical environmental conditions, which informed its investment in a waterless dyeing process for polyester, thereby eliminating both water usage and chemical discharge into local water systems. Moreover, stakeholder engagement has been found to positively influence CSR performance (Herremans et al., 2016; Mahmoudian et al., 2021). For example, Mahmoudian et al. (2021) demonstrate that active engagement with inter- and intra-organizational stakeholders positively affects firm carbon performance.
In sum, the evidence suggests that a sustainability committee actively engages with stakeholders to design better informed CSR strategies and targets, thereby strengthening their monitoring functions and ultimately improving CSR performance. Hence, we propose the following hypothesis:
The presence of active firm-level stakeholder engagement programs positively mediates the positive association between the presence of a sustainability committee and CSR performance.
2.2.2.3 Sustainability committee, quality of sustainability reporting and CSR performance
An effective sustainability reporting system enables firms to capture, process, and analyze CSR-related information (Bebbington and Larrinaga, 2014; Henri and Journeault, 2010). From an agency theory perspective, credible information allows a sustainability committee to exercise effective monitoring and strategic oversight, while stakeholder theory suggests that internal reporting facilitates transparent communication of CSR practices to external audiences (Javeed et al., 2022). Accordingly, firms with a sustainability committee are more likely to establish robust reporting systems to document and disclose CSR activities. Prior empirical evidence substantiates this argument, showing that firms with a sustainability committee are more likely to issue standalone sustainability reports voluntarily (Kend, 2015), better align their CSR disclosures with GRI standards (Fuente et al., 2017), voluntarily disclose CSR information (Peters and Romi, 2014), and produce higher-quality CSR disclosures (Hussain et al., 2018).
High-quality sustainability reporting enables a sustainability committee to evaluate performance, hold managers accountable, and communicate outcomes to stakeholders. Furthermore, transparent reporting of CSR performance triggers stakeholder reactions—particularly when performance lags behind that of peers—thereby compelling managers to adjust real activities and enhance CSR outcomes (Saha et al., 2025). In sum, the presence of a sustainability committee increases a firm's likelihood of implementing high-quality sustainability reporting, which enables both the committee and stakeholders to monitor CSR performance and drive continuous improvement. Hence, the following hypothesis is proposed:
The presence of quality sustainability reporting positively mediates the positive association between the presence of a sustainability committee and CSR performance.
2.2.3 Sustainability committee characteristics and CSR performance
Kolev et al. (2019) argue that member characteristics shaping human capital, and committee dynamics affect board committee effectiveness. CG theories and codes likewise prescribe desirable member traits for this reason. However, research on sustainability committee characteristics, particularly in the context of USA, remains limited (Kolev et al., 2019). Drawing on studies of other board-level committees (DeFond et al., 2005; Goh, 2009), we examine how committee size, members’ gender, age, tenure, qualifications, and overlap with audit committee members influence CSR performance.
2.2.3.1 Size of sustainability committee
Research grounded in stakeholder theory suggests that a larger board committee represents more diverse interests (Hillman and Keim, 2001) and are more likely to include members with firsthand experience of CSR issues and enabling better stakeholder management. From an agency theory perspective, a larger board committee holds greater organizational status and power (Kalbers and Fogarty, 1993), enhancing control and monitoring (DeFond et al., 2005). Moreover, greater size implies more resources and expertise (Pfeffer and Salancik, 2003), particularly in areas like CSR. Aside from a few studies that argue large committee size may lead to process loss or diffusion of responsibilities (e.g. Bédard et al., 2004; Gull et al., 2024), prior research generally finds that a larger committee is positively associated with desirable outcomes (Goh, 2009; Jarboui et al., 2022; Peters and Romi, 2015). We, therefore, propose the following hypothesis:
The size of a sustainability committee is positively associated with CSR performance.
2.2.3.2 Gender diversity of sustainability committee
Recent meta-analyses by Post and Byron (2015) and Byron and Post (2016) indicate that female directors are more effective than their male counterparts in monitoring and advisory roles, consistent with agency theory. Moreover, Harjoto et al. (2020) report that female leadership exhibits stronger commitment to CSR reporting, aligning with stakeholder theory by reflecting female directors’ greater attentiveness to the interests of broader stakeholder groups. At the committee level, most studies report positive effects of gender diversity (e.g. Alkalbani et al., 2019; Gull et al., 2024; Zalata et al., 2018). For instance, female presence is associated with improved audit quality (Zalata et al., 2018) and lower levels of earnings management and financial restatements (Alkalbani et al., 2019). Accordingly, the presence of women on a sustainability committee is expected to strengthen ethical oversight, monitoring and advisory functions of the committee and thereby, improve CSR performance. Our hypothesis is, therefore, stated as follows:
Greater female representation on a sustainability committee is positively associated with CSR performance.
2.2.3.3 Age of sustainability committee members
Drawing on agency and stakeholder theory, directors’ age is shown to shape the effectiveness of governance (Core et al., 1999; Grove et al., 2011). Older directors possess greater managerial experience and firm-specific knowledge (Grove et al., 2011). From an agency theory perspective, these experience and knowledge may enhance oversight and strategic guidance of older members of sustainability committee to enhance CSR performance (Eberhardt-Toth, 2017). However, age-related declines in cognitive functioning may impair decision quality and monitoring effectiveness (Grove et al., 2011), with prior research linking senior board members to weaker governance outcomes (Core et al., 1999). Empirical evidence also suggests that older individuals tend to exhibit lower environmental concern, weaker CSR-related knowledge, and more permissive ethical judgment (Diamantopoulos et al., 2003; Vitell et al., 2007), which may reduce sensitivity to stakeholder expectations. Moreover, older directors are generally more resistant to strategic change (Ahn and Walker, 2007), less inclined to invest in innovation (Serfling, 2014), and slower to promote CSR-related initiatives (Berrone and Gomez-Mejia, 2009). Consistent with these latter arguments and supporting empirical evidence, a sustainability committee with younger members is, therefore, expected to exhibit stronger CSR orientation, greater openness to strategic change, and more effective monitoring of CSR performance.
This leads to our hypothesis as follows:
The average age of sustainability committee members is negatively associated with CSR performance.
2.2.3.4 Tenure of sustainability committee members
From an agency perspective, longer tenure enhances board committee members’ firm-specific expertise and understanding of internal processes (Kor and Sundaramurthy, 2009; Vafeas, 2005), thereby strengthening their ability to monitor management and exercise control effectively (Beck and Mauldin, 2014; Li and Wahid, 2018; Yang and Krishnan, 2005). For example, empirical evidence shows that longer tenure on an audit committee is associated with higher audit quality, lower earnings management and fewer financial restatements, as well as more restrained CEO compensation (Beck and Mauldin, 2014; Li and Wahid, 2018; Yang and Krishnan, 2005). Moreover, extended tenure facilitates deeper integration within stakeholder networks (Pfeffer and Salancik, 2003), enabling committee members to better represent stakeholder interests and pursue social objectives (Simsek, 2007), which is consistent with stakeholder theory. Although prolonged tenure may sometimes increase the risk of entrenchment and reduced independence (Sharma and Iselin, 2012), this concern is likely attenuated for a sustainability committee, which is relatively recently introduced governance mechanisms (Kolev et al., 2019). Accordingly, longer-tenured sustainability committee members are expected to be better positioned to promote stronger CSR performance. We, therefore, propose the following hypothesis:
The longer tenure of sustainability committee members is positively associated with CSR performance.
2.2.3.5 Qualifications of sustainability committee members
Board members with higher academic attainment typically possess stronger cognitive abilities that enhance their capacity to process, analyze, and evaluate complex information, thereby enabling them to discharge their monitoring and oversight responsibilities more effectively (Wang et al., 2017). Consistent with this view, several studies grounded in agency theory report that directors with higher levels of education are associated with improved firm financial performance (Khanna et al., 2014; Wang et al., 2017)
Moreover, better-educated directors and managers tend to exhibit stronger ethical orientations which have been shown to increase sustainability disclosure quality (Yu, 2025) and reduce earnings management (Bilal et al., 2023). Advanced educational attainment has also been linked to greater openness to change and innovation (Dalziel et al., 2011). This openness is particularly important for CSR, which is a rapidly evolving phenomenon, shaped by the expectations and pressures of a wide range of internal and external stakeholders (Aguilera et al., 2007). Maximizing CSR performance also requires technological and organizational innovations (Berrone and Gomez-Mejia, 2009), which better-educated directors may be more willing and able to pursue (Dalziel et al., 2011). Accordingly, sustainability committee members with higher educational attainment—owing to their enhanced information-processing capabilities, stronger ethical reasoning, and greater openness to adopting new technological and organizational innovations—are expected to be more effective in advancing CSR performance. We therefore propose the following hypothesis:
Higher educational qualifications of sustainability committee members are positively associated with CSR performance.
2.2.3.6 Membership overlaps between the sustainability committee and audit committee
Serving on multiple board committees enhances directors’ knowledge of the firm, thereby improving their monitoring, advisory, and resource-provision capabilities (Pfeffer and Salancik, 2003; Vafeas, 2005). Overlapping committee memberships also facilitate the transfer of information and tacit knowledge across committees, strengthening overall oversight and advisory functions (Brandes et al., 2016). Empirical studies support these benefits (Chandar et al., 2012; Tao and Hutchinson, 2013); for instance, dual membership on audit and compensation committees reduces compensation incentivized earnings management (Chandar et al., 2012). Through overlapping memberships, audit committee members’ expertise in compliance and risk assessment can spill over to a sustainability committee (Peters and Romi, 2014; Vafeas, 2005), improving regulatory compliance and sustainability risk management, and thereby enhancing CSR performance. We, therefore, propose the following hypothesis:
The overlap of sustainability committee members with members of the audit committee is positively associated with CSR performance.
3. Research methodology
3.1 Sample and data
Our study's sample comprises firms included in the MSCI ESG KLD STATS database, formerly known as the Kinder, Lyndenberg and Domini [KLD] Research and Analytics Inc. Database. Financial data for these firms is sourced from Compustat, while CSR performance data is obtained from the MSCI ESG KLD STATS database. Information regarding the presence of a sustainability committee and its characteristics is gathered from the BoardEx database. Additionally, we collect data on sustainability-linked CEO compensation, stakeholder engagement, and sustainability reporting quality from the Refinitiv ESG database [2]. The timeframe for our sampling is constrained by the data availability in the MSCI ESG KLD STATS databases. BoardEx began collecting data in 2000, while MSCI ESG KLD STATS provides CSR performance data up until 2018. Our analysis also involves a lead–lag model, necessitating the exclusion of one year of CSR performance data. After removing missing firm-year observations in the aforementioned databases, our initial sample includes 4,045 unique firms, resulting in 27,966 firm-year observations for the sustainability committee model. For the models focusing on sustainability-linked compensation, stakeholder engagement, and sustainability reporting quality, the sample comprises 2,150 unique firms with 11,684 firm-year observations. Lastly, for the sustainability committee characteristics models, we have a sample of 316 unique firms, yielding 1,974 firm-year observations.
Table 1 reports the industry- and year-wise distribution of our final sample. Table 1, Panel A shows that firms dominating our sample for CSR performance information are from the computer industry (15.23%), followed by services (8.74%); and financial (7.52%) industries; while industries deemed as “others” (0.55%) accounted for the lowest percentage of firms. Our sample of firms with a sustainability committee is shown to be dominated by those from the following industries: utilities (14.79%), followed by chemicals (11.14%) and extractive (10.33%). Furthermore, Table 1, Panel B shows the year-wise distribution of our sample firms. The largest proportion of sample firms (6.90%) is in 2011, while 2001 has the lowest proportion of firms (1.55%), and no single year accounts for more than 10% of the total observations. Furthermore, the number of firms with a sustainability committee increased over time, other than in 2015, highlighting the increasing importance of the sustainability committee.
3.2 Measure of CSR performance
We obtain CSR performance data from the MSCI ESG KLD STATS database, which constructs a firm's CSR performance using various sources and documents (Kim et al., 2014). This database is extensively used in prior studies (Bose et al., 2022a; Dhaliwal et al., 2011; Kim et al., 2014; Kim et al., 2012) to measure firms’ CSR performance. The MSCI ESG KLD STATS database rates a firm's CSR performance across seven dimensions: community, diversity, employee relations, environment, human rights, products, and CG. Each dimension is rated as either positive or negative (i.e. strengths or concerns) based on a predetermined set of criteria. Our CSR performance measure derives from the aggregate CSR score, reflecting firm-level CSR activities across six categories: community, diversity, employee relations, the environment, human rights and products. The number of indicators in the MSCI ESG KLD STATS database has evolved over time (Du and Yu, 2020), making direct year-over-year CSR performance comparisons challenging. However, such comparisons are crucial for our study, which examines both time-series and cross-sectional dimensions of CSR performance. To address this, we first calculate the total net CSR score by summing all CSR strengths and concerns. We then develop a weighted CSR performance measure to enable comparison across years and industries. This measure, ranging from 0 to 1, follows methodologies used in prior studies (Bose et al., 2022a; Kim et al., 2014). Thus, CSR_PERF is measured as the ratio of the difference between the net CSR score and the sample's minimum of year–industry-adjusted CSR score to the difference between the sample's maximum and minimum of year–industry-adjusted CSR scores (Bose et al., 2022a; Kim et al., 2014) [3].
3.3 Measure of sustainability committee, its characteristics and mediating mechanisms
We collect data on the presence of a sustainability committee and its characteristics from the BoardEx database. This database provides information not only on whether a firm has a sustainability committee, but it also provides detailed data on all directors. The variables for our sustainability committee characteristics comprise committee size; committee members’ gender, tenure and age; qualifications of committee members; and overlap between members of the sustainability and audit committees. We obtain sustainability-linked CEO compensation, stakeholder engagement and sustainability reporting quality data from the Refinitiv ESG database. We measure sustainability-linked CEO compensation contracts (SUSTPAY) as an indicator variable if the firm linked its CEO's compensation to sustainability targets, and 0 otherwise following (Saha et al., 2025). Furthermore, we measure STAKE as a dummy variable, with this coded 1 if a firm has the presence of active firm-level stakeholder engagement programs, and 0 otherwise. Finally, following Cohen and Simnett (2015), we measure SUSTQUAL as an indicator variable that equals 1 if the firm adopts the Global Reporting Initiative (GRI) as a sustainability reporting framework, and 0 otherwise. Appendix provides the list of variables and their detailed measurements.
3.4 Control variables
We control for several variables that have been shown to affect CSR performance in prior studies. Firms of larger size (FSIZE) are more likely to recognize a social issue as a distinct priority and to allocate more resources to manage it effectively (Clarkson et al., 2008; de Villiers et al., 2011). Debtholders (LEV) are more likely to have an interest in CSR performance as it reveals a firm's downside risk (Dhaliwal et al., 2014). Following de Villiers et al. (2011), we assume that firms with higher growth opportunities (MB) are more likely to extract greater future returns from CSR activities. Dixon-Fowler et al. (2017) argue that more profitable firms (ROA) are more likely to have more financial resources to invest in social activities. Prior research finds that firms which raise capital (FIN) in debt and equity markets are more likely to have better CSR performance (Clarkson et al., 2008), as firms are operating in highly competitive industries (COMPET) as they seek to obtain a competitive advantage (Dhaliwal et al., 2011). Dhaliwal et al. (2011) also maintain that firms operating in the international market (GLOBAL) face greater pressure to commit to social performance.
Bose et al. (2022a) argue that firms’ CSR performance is influenced by stock liquidity (LIQUID). Firms at higher risk of litigation (LITG) are found to be more likely to have better CSR performance as a way of preempting potential lawsuits (Dhaliwal et al., 2011). Firms of long standing in the market (FAGE) are more likely to have succeeded in sustainable development, thus motivating these firms to maintain higher levels of CSR performance (Dhaliwal et al., 2014). Firms with higher sustained capital expenditure (CAPEX) are expected to have the latest and cleanest technologies to facilitate higher levels of environmental performance (Clarkson et al., 2008). Kim et al. (2012) report a negative relationship between earnings management and the level of social performance. We control for earnings management (EM), with this measured as the absolute value of discretionary accruals from the modified Jones (1991) model. Finally, we control for other CG performance scores as a proxy for CG (CGOV), in line with prior research which documents a significant relationship between firm-level CG and CSR performance (de Villiers et al., 2011) [4]. We use year and industry fixed effects in all our regression models and estimate the models using robust standard errors clustered at the firm level to address heteroscedasticity and autocorrelation.
3.5 Empirical models
3.5.1 Sustainability committee model
To test the association between the presence of a sustainability committee and CSR performance, we estimate the following lead–lag ordinary least squares (OLS) regression models:
where CSR_PERF is CSR performance and SUSTCOM is sustainability committee, our research variable. A significant positive coefficient of SUSTCOM in Equation (1) would support our first hypothesis (H1). Appendix provides the list of all variables and their detailed measurements.
3.5.2 Mediation model
Hypotheses H1a–H1c test the mediation effect of sustainability-linked CEO compensation (H1a)/stakeholder engagement (H1b)/sustainability reporting quality (H1c) on the relationship between the presence of a sustainability committee and CSR performance. Following prior studies (e.g. Bose and Hossain, 2024; Bose et al., 2025b; Cook et al., 2019; Daradkeh et al., 2023), we develop the following set of equations to conduct our mediation tests:
where SUSTPAY is the presence of sustainability targets in CEO compensation contracts; STAKE is firm-level stakeholder engagement; and SUSTQUAL is the quality of sustainability reporting. All variables are defined in Appendix.
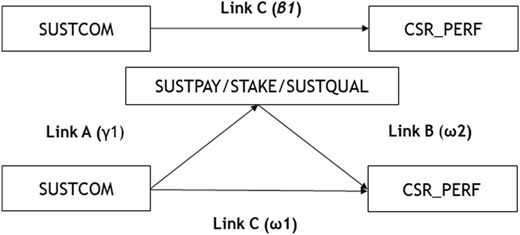
To investigate the overall effect of the presence of a sustainability committee (SUSTCOM) on CSR performance, we start with Equation (2.1), where the effect is denoted by the coefficient β1. In Equation (2.2), the influence of SUSTCOM on sustainability-linked compensation (SUSTPAY), stakeholder engagement (STAKE), or sustainability reporting quality (SUSTQUAL) is represented by the coefficient γ1. Subsequently, Equation (2.3) is used to determine the direct effect of SUSTCOM on CSR performance, denoted by ω1, after accounting for the mediator variable, which could be either SUSTPAY, STAKE, or SUSTQUAL. To establish these variables as mediators, we follow the criteria set forth by Baron and Kenny (1986) and Wen and Ye (2014) [5]. Specifically, we consider SUSTPAY/STAKE/SUSTQUAL as a mediator if: (a) SUSTCOM is significantly related to CSR_PERF (β1≠0) as per Equation (2.1), (b) SUSTCOM has a significant relationship with SUSTPAY/STAKE/SUSTQUAL (γ1≠0) in Equation (2.2), and (c) SUSTPAY/STAKE/SUSTQUAL shows a significant relationship with CSR_PERF, controlling for SUSTCOM (ω2≠0), in the subsequent equation. Upon establishing these relationships, we proceed to test the statistical significance of the average causal mediation effect. For this purpose, we employ the bootstrapped Sobel–Goodman test, as recommended by Preacher and Hayes (2004). This test is particularly suitable for our analysis, as it allows us to simultaneously assess the potential interrelationships among SUSTCOM, SUSTPAY/STAKE/SUSTQUAL, and CSR performance, as outlined in Equations (2.1) to (2.3). We present the procedure for the mediation test in Figure 1.
3.5.3 Sustainability committee characteristics model
To test our hypotheses H2a–H2f, we estimate the following lead–lag ordinary least squares (OLS) regression models:
where CSR_PERF is CSR performance and our research variable comprises the following characteristics of the sustainability committee: committee size (COMSIZE); percentage of female members on the committee (GENDER); average age of committee members (AGE); committee members’ tenure (COMTEN); committee members’ educational qualifications (QUAL) [6]; and the overlap of sustainability committee members with those on the audit committee (OVLP). A significant coefficient for COMSIZE, GENDER, AGE, COMTEN, QUAL and OVLP would support hypotheses H2a–H2f. All variables are defined in Appendix.
4. Empirical results
4.1 Descriptive statistics and correlations
Table 2 reports the descriptive statistics of the dependent and explanatory variables used in this study. The mean of CSR performance (CSR_PERF) is 0.342, with this being lower than the mean of CSR performance of 0.404 reported by Kim et al. (2014). This difference is related to the specific sample [7]. About 7.10% of firms in our sample have a sustainability committee (SUSTCOM). Moreover, about 18.10% of firms have linked their sustainability targets with CEO compensation contracts (SUSTPAY), while 30.80% of firms have engaged stakeholders (STAKE) in their decision making and 19.40% of firms have followed Global Reporting Initiative (GRI) guidelines (SUSTQUAL) in preparing their sustainability reports.
The average committee size (COMSIZE) is 5.015 members. The average percentage of female sustainability committee members (GENDER) is 21.40%. The average tenure (COMTEN) of sustainability committee members is 6.821 years. The average number of qualifications of sustainability committee members (QUAL) is 2.382 [8]. The natural logarithm of the average age (AGE) of sustainability committee members is 4.292, implying an average age of 61.85 years. Around 73.20% of firms exhibit overlap between their sustainability and audit committees (OVLP).
The average (median) size (FSIZE) of firms in our sample, measured by the natural logarithm of market value, is 7.440 (7.278), implying an average total market value of US$6,142.09 million [9]. The mean leverage ratio (LEV) is 0.236, suggesting that firms in our sample are not highly leveraged. The average market-to-book (MB) ratio is 2.139, suggesting that shares of firms in our sample trade well above their book value, thus indicating higher growth opportunities. The mean profitability (ROA) of firms in our sample is 2.60%. The external financing average (FIN) is 0.046, indicating that firms in the sample raise external finance from either the capital market or the debt market. The mean of industry competition (COMPET) is 0.522, suggesting that firms in our sample have a moderate level of industry competition. About 46.50% of firms in our sample have foreign operations (GLOBAL), while about 30.30% are from litigated industries (LITG). The mean of liquidity (LIQUID) is 2.359. The natural logarithm of firm age (FAGE) is 2.966, indicating an average firm age of 23.99 years. The average capital expenditure (CAPEX) ratio is 0.115, while the average earnings management (EM) is 0.086. The average governance performance score (CGOV) of 0.564 is close to the governance performance score of 0.555 reported by Kim et al. (2014).
Table 3, Panels A and B present Pearson's correlation coefficients for variables used in our sustainability committee and its characteristics model as stated in Equations (1) and (3). As shown in the table, the correlation coefficients for variables used in Equations (1) and (3) are less than 0.80, suggesting that our models do not suffer from the problem of multicollinearity (Gujarati and Porter, 2009). Furthermore, the average variance inflation factor (VIF) value is 1.37, with the highest VIF value being 2.74 and the lowest VIF value being 1.05, all of which are less than the threshold of 10.00, as suggested by Gujarati and Porter (2009).
4.2 Multivariate analysis
4.2.1 Regression analysis for Hypothesis 1 (H1)
Our first hypothesis (H1) predicts that the presence of a sustainability committee is positively associated with CSR performance. We present the results for H1 in Table 4. Model (1) reports the association between the presence of a sustainability committee (SUSTCOM) and CSR performance (CSR_PERF) without any firm-level control variables, while Model (3) shows the association between the presence of a sustainability committee (SUSTCOM) and CSR performance (CSR_PERF) with firm-level control variables. The coefficients of SUSTCOM in Models (1) and (3) are positive and statistically significant (β = 0.091, p < 0.01; β = 0.037, p < 0.01), suggesting that the presence of a sustainability committee is positively associated with CSR performance. Thus, the current study's H1 is supported. This finding implies that firms with a sustainability committee are more likely to have higher levels of CSR performance. This finding is consistent with prior evidence of positive association between the presence of a sustainability committee and CSR-related outcomes (e.g. Dixon-Fowler et al., 2017; Driss et al., 2024; Hussain et al., 2018; Orazalin, 2020; Peters and Romi, 2014). However, our study differs from their work as our outcome variable of interest is CSR performance, rather than CSR-related disclosures (Driss et al., 2024; Hussain et al., 2018; Peters and Romi, 2014) or environmental performance (Dixon-Fowler et al., 2017).
The R-squared (R2) value for Model (3) is 0.296, suggesting that independent variables explain 29.60% of the variation in CSR performance. Furthermore, we test the incremental contribution of SUSTCOM to the explanatory power of the regression analyses, following Gujarati (2003). We rerun Equation (1), excluding the variable SUSTCOM, with Table 4, Model (2) reporting the regression results and the R-squared value. To test the null hypothesis that the inclusion of SUSTCOM does not change the R-squared value of our regression analysis, we test the F-statistic as reported in Model (2). The value for Gujarati (2003) F-statistic is 106.16, with this being statistically significant at 1% as shown in Model (3), indicating that SUSTCOM significantly increases the explanatory power of the regression analyses. Thus, the presence of a sustainability committee is shown to be incrementally informative for enhancing a firm's CSR performance.
Regarding the control variables, we find that the coefficients for FSIZE, MB, COMPET, GLOBAL, LITG, FAGE, CAPEX and CGOV are generally positive and statistically significant, consistent with the prior literature. This suggests that firms that are larger, have greater growth opportunities, operate in more competitive environments, engage in foreign operations, face higher litigation risk, have a longer market presence, exhibit greater capital intensity, and demonstrate stronger governance performance tend to achieve higher future CSR performance. However, the coefficient for earnings management (EM) is negative and statistically significant, indicating that firms with a higher level of earnings management have lower CSR performance.
Although Equation (1) controls for a comprehensive set of firm-specific variables that may jointly influence the presence of a sustainability committee and CSR performance, and includes industry, and year fixed effects, the estimates may still be subject to bias arising from unobserved, time-invariant firm characteristics. To address this concern, we employ firm fixed-effects regressions, which absorb all time-invariant heterogeneity at the firm level that could otherwise induce a spurious association between the sustainability committee and CSR performance (Saha et al., 2025). The results reported in Table 4, Model (4) show that the coefficient on SUSTCOM remains positive and statistically significant, suggesting that the main findings are unlikely to be driven by time-invariant omitted variables.
4.2.2 Regression analysis for hypotheses H1a–H1c
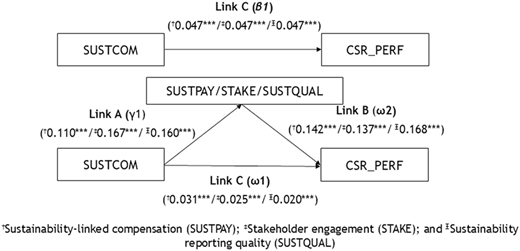
Table 5, Panel A, Models (1)–(3) present the regression results of the mediation effects of sustainability-linked compensation on the relationship between SUSTCOM and CSR_PERF. Specifically, Model (1) shows the total effect of SUSTCOM on CSR_PERF; Model (2) reports the effect of SUSTCOM on SUSTPAY; and Model (3) identifies the direct effect of SUSTCOM on CSR_PERF after controlling for SUSTPAY. The coefficient of SUSTCOM is statistically significant and positive (β = 0.047, p < 0.01) in Model (1), suggesting that the presence of a sustainability committee is positively associated with CSR performance. Furthermore, the coefficient of SUSTCOM is positive and statistically significant (β = 0.110, p < 0.01) in Model (2), suggesting that SUSTCOM is positively associated with the mediator variable, SUSTPAY. In Model (3), the coefficient of SUSTPAY is positive and statistically significant (β = 0.142, p < 0.01), while the coefficient of SUSTCOM is positive and statistically significant (β = 0.031, p < 0.01). However, the size of the coefficient of SUSTCOM has reduced compared to the coefficient of SUSTCOM in Model (1). Furthermore, the coefficient of SUSTCOM is still significant after controlling for the mediator in Model (3), with this indicating partial mediation. Overall, these findings suggest the partial mediating role of sustainability-linked CEO compensation on the relationship between the presence of a sustainability committee and CSR performance. We then test the statistical significance of the mediation test. The mediation-related statistics are shown at the end of Table 5, Panel A, suggesting that the direct and total effects of SUSTCOM on CSR performance are 0.031 and 0.047, respectively. The indirect effect is positive and statistically significant (Indirect effect = 0.016, p < 0.01), implying that the mediated portion of SUSTPAY attributed to SUSTCOM is 32.94% of the total effect. Figure 2 presents these results graphically. Overall, the mediation analysis provides evidence consistent with sustainability-linked CEO compensation serving as a pathway through which the presence of a sustainability committee is associated with higher CSR performance.
In Table 5, Panel B, Models (1)–(3), we test whether firm-level stakeholder engagement serves as a mediator between the presence of a sustainability committee and CSR performance. First, we find that the coefficient of SUSTCOM is significantly positive (β = 0.047, p < 0.01) in Model (1), confirming the total effects of SUSTCOM on CSR performance. Furthermore, the coefficient of SUSTCOM is positive and statistically significant (β = 0.167, p < 0.01) in Model (2), suggesting that SUSTCOM is positively associated with the mediator variable, STAKE. In Model (3), the coefficient of STAKE is positive and statistically significant (β = 0.137, p < 0.01), while the coefficient of SUSTCOM is positive and statistically significant (β = 0.025, p < 0.01). However, the size of the coefficient of SUSTCOM has reduced compared to the coefficient of SUSTCOM in Model (1). Furthermore, the coefficient of SUSTCOM is still significant after controlling for the mediator variable, STAKE, in Model (3). Thus, the three-step test indicates a partial mediation effect and further reveals that firm-level stakeholder engagement mediates 48.10% of the total effect of SUSTCOM. The results are consistent with active stakeholder engagement serving as a pathway through which sustainability committees are associated with higher CSR performance.
We next present the regression results on whether sustainability reporting quality serves as a mediator between the presence of a sustainability committee and CSR performance in Panel C, Table 5. First, we find that the coefficient of SUSTCOM is significantly positive (β = 0.047, p < 0.01) in Model (1), confirming the total effects of SUSTCOM on CSR performance. Furthermore, the coefficient of SUSTCOM is positive and statistically significant (β = 0.160, p < 0.01) in Model (2), suggesting that SUSTCOM is positively associated with the mediator variable, SUSTQUAL. In Model (3), the coefficient of SUSTQUAL is positive and statistically significant (β = 0.168, p < 0.01), while the coefficient of SUSTCOM is positive and statistically significant (β = 0.020, p < 0.01). However, the size of the coefficient of SUSTCOM has reduced compared to the coefficient of SUSTCOM in Model (1). Furthermore, the coefficient of SUSTCOM is still significant after controlling for the mediator variable, SUSTQUAL, in Model (3). Thus, the three-step test indicates a partial mediation effect and further reveals that the quality of sustainability reporting, SUSTQUAL, mediates 57.01% of the total effect of SUSTCOM. The results are consistent with the quality of sustainability reporting serving as a pathway through which sustainability committees are associated with higher CSR performance.
4.2.3 Regression analysis for hypotheses H2a–H2f
We report the regression results for the remaining hypotheses (H2a–H2f) in Table 6. The explanatory power (R-squared [R2]) values of the regression models vary from 0.241 to 0.263, suggesting that the independent variables explain the dependent variable well. Table 6, Model (1) reports the regression results for H2a. The coefficient of COMSIZE is positive and significant (β = 0.057, p < 0.05), suggesting that firms with a larger sustainability committee (COMSIZE) have higher CSR performance; hence, H2a is supported. This finding supports the empirical evidence provided by Peters and Romi (2014) and Jarboui et al. (2022) but contradicts the findings of Gull et al. (2024), who maintained that a larger sustainability committee increases environmental decoupling.
The results for H2b are presented in Table 6, Model (2). The coefficient of GENDER is positive and significant (β = 0.157, p < 0.01), thus supporting the study's H2b. This finding indicates that firms with more female members on their sustainability committee have higher CSR performance, thus supporting prior evidence that gender diversity of a board committee is positively associated with achievement of its desired outcomes (Alkalbani et al., 2019).
The result for H2c (β = −0.475, p < 0.01), as reported in Table 6, Model (3), suggests that the age of committee members is negatively associated with the firm's level of CSR performance. The result supports this study's H2c, possibly indicating that younger members on the sustainability committee initiate more CSR-related strategic change and innovation, while exercising stricter ethical judgments compared to their counterparts and, therefore, help the firm to achieve better CSR performance.
The results relating to H2d are presented in Table 6, Model (4). The coefficient of COMTEN is positive and statistically significant (β = 0.003, p < 0.10); hence, H2d is supported. This finding suggests that it is helpful for sustainability committee members to have a relatively long tenure in order to understand key stakeholders’ demands and to inform themselves about the firm's CSR issues. In H2e, the study asserts that the number of educational qualifications of sustainability committee members is positively associated with the level of CSR performance. The coefficient for QUAL is positive and significant (β = 0.080, p < 0.10) as shown in Table 6, Model (5). This finding indicates that sustainability committee members with a higher number of qualifications are encouraged to incorporate CSR issues into their firms which enhance CSR performance.
In H2f, the study predicts that the overlap between members of the audit committee and those of the sustainability committee is positively associated with the level of CSR performance. The results for this hypothesis are presented in Table 6, Model (6). The coefficient for OVLP is positive and significant (β = 0.022, p < 0.05); therefore, H2f is supported. This finding suggests that firms with overlapping members between the audit committee and sustainability committee are better able to deal with CSR-related regulations and risks.
When we include all characteristics of the sustainability committee in a model (Table 6, Model [7]), the coefficients for COMSIZE, GENDER, AGE, COMTEN, QUAL and OVLP maintain their signs and levels of significance. Hence, our study documents that sustainability committee size, and committee members’ gender, tenure, qualifications and overlap with members of the audit committee are all positively associated with CSR performance. In contrast, sustainability committee members’ age is negatively associated with CSR performance. In the next section, we provide additional analyses and perform robustness checks of our main findings.
5. Additional analyses and robustness checks
5.1 Endogeneity analysis
Endogeneity arises when the variable of interest is correlated with the error term, leading to potentially incorrect inferences. In our study, the relationship between the presence of a sustainability committee and a firm's CSR performance may be susceptible to endogeneity. This could arise from the possibility that firms with a sustainability committee inherently differ from those without one. To investigate this, we conducted mean and median tests for all variables used in Equation (1). While we do not present these results for the sake of brevity, it is important to note that they were all statistically significant. These significant differences highlight the presence of observable self-selection bias, adding another layer of potential endogeneity that could influence our results. To tackle the issue of endogeneity stemming from observable selection bias, we employed Propensity Score Matching (PSM). PSM not only addresses this specific type of bias but also reduces bias due to potential misspecification of the functional form, which is another source of endogeneity (Shipman et al., 2017). In addition to PSM, we also run Heckman's (1979) two-stage analysis to address endogeneity arising from unobservable selection bias following Bose et al. (2026). Additionally, we run instrumental variable analysis to address endogeneity arising from reverse causality [10].
5.1.1 Propensity score matching (PSM) analysis
To address endogeneity due to observable selection bias, we employ the propensity score matching (PSM) approach. PSM aims to achieve covariate balance between treatment and control groups. The process begins with a logistic regression in the first stage, using a dummy variable as the dependent variable. In this stage, we match each firm-year observation with SUSTCOM equal to 1 (a treatment observation) to another firm-year observation with SUSTCOM equal to 0 (a control observation), based on their predicted propensity scores from the logistic regression. Following the basic principles of PSM, we consistently use the same control variables in both the first and second stages. This ensures accurate matching between treatment and control observations in the matched sample (Shipman et al., 2017). For matching, we adopt the caliper matching method, matching within a caliper of 3%. The caliper represents the allowable difference in predicted probabilities between treatment and control observations. Furthermore, the covariate equilibrium is achieved when variables used in the first stage are comparable between the two groups (SUSTCOM = 1 or SUSTCOM = 0).
Table 7, Panel A reports the results of the first-stage logistic regression. Panel B shows the balancing of covariates between treatment and control groups, indicating no statistically significant difference between them. The final test samples for CSR performance (CSR_PERF) total 3,908 firm-year observations. After determining the matched observations, we run the regression using Equation (1) to address any remaining bias after conducting propensity score matching (PSM). The results of the second-stage regression are presented in Table 7, Panel C. The results suggest that our findings are qualitatively similar to those reported in Table 4, indicating that our findings are not affected by observable selection bias.
5.1.2 Heckman's (1979) two-stage analysis
While observable selection bias is addressed by PSM analysis between those firms with a sustainability committee and those without, some unobservable factors could differ between these two groups of firms. Thus, the self-selection bias problem associated with firms with a sustainability committee may not be completely solved. To address unobservable self-selection bias, we employ Heckman's (1979) two-stage approach. In the first stage, we run a probit regression model of determinants for appointing a sustainability committee and we generate the inverse Mills ratio (IMR) from that first stage. We include the proportion of firms in an industry that appoint a sustainability committee (PROPCOM) as an exclusion restriction in the first-stage probit model. The rationale behind including PROPCOM is that it captures industry pressure. If more firms in a given industry appoint a sustainability committee, then non-appointing firms are under greater pressure to appoint a sustainability committee to minimize stakeholders’ negative perceptions. We also use several variables as predictors of having a sustainability committee in addition to the PROPCOM [11].
In the second stage, we introduce the IMR as a control variable in Equation (1) to account for selection bias. The results of the first stage, detailed in Table 8, Panel A, show that the coefficient on PROPCOM is positive and statistically significant (β = 10.472, p < 0.01), confirming its suitability as an exclusion restriction. The second-stage regression results, presented in Panel B of Table 8, reveal a positive and significant relationship between the presence of a sustainability committee (SUSTCOM) and CSR performance (β = 0.037, p < 0.01). Additionally, the significant IMR coefficient indicates that self-selection bias is a potential issue in this context. Nevertheless, the consistency of the SUSTCOM coefficients before and after adjusting for self-selection bias confirms the robustness of our main findings, as initially reported in Table 4. Overall, the application of Heckman's (1979) two-stage model strengthens our conclusion that our findings are robust and not significantly influenced by self-selection bias.
5.1.3 Instrumental variable analysis
The association of the presence of a sustainability committee and its characteristics with CSR performance can be endogenous for some firms. To address the endogeneity issue, we apply the instrumental variables approach. We estimate all regression models using two-stage least squares (2SLS) except SUSTCOM and OVLP models [12]. In our study's setting, identifying suitable instruments proved challenging because prior studies have not suggested instrumental variables for sustainability committee or their characteristics. Thus, we use the one-year lag and the industry mean of that specific variable as an instrumental variable of that variable. For example, we use a one-year lag of the sustainability committee and the industry–year mean of the sustainability committee, excluding the focal firm, as an instrument of the sustainability committee variable. The results are not reported here for reasons of brevity. However, the unreported results show that the findings (the coefficients of SUSTCOM [β = 0.041, p < 0.01]; COMSIZE [β = 0.106, p < 0.10]; GENDER [β = 0.134, p < 0.01]; AGE [β = −0.495, p < 0.01]; COMTEN [β = 0.089, p < 0.10]; and QUAL [β = 0.103, p < 0.10]) remain qualitatively similar except for OVLP [13]. These results indicate that our findings are robust after controlling for endogeneity.
5.2 Alternative specifications for mediation analysis
In Section 3.5.2, we estimate Equations (2.1)–(2.3), where CSR performance and the mediating variables (SUSTPAY, STAKE, and SUSTQUAL) are measured at time t+1, while the sustainability committee (SUSTCOM) is measured at time t. To further examine the robustness of our mediation findings, we re-estimate the mediation models using a more conservative temporal specification. Specifically, we measure the presence of a sustainability committee at year t−1, the mediating variables (SUSTPAY, STAKE, and SUSTQUAL) at year t, and CSR performance at year t+1. This specification strengthens the temporal ordering of the proposed relationships by ensuring that the governance mechanism precedes the mediators and subsequent CSR outcomes, thereby reducing concerns regarding simultaneity and reverse causality. The results, reported in Table 9, show that the indirect effects remain positive and statistically significant across all three mediating pathways. These findings provide additional evidence consistent with the proposed mediating roles of sustainability-linked CEO compensation, stakeholder engagement, and sustainability reporting quality in the association between sustainability committees and CSR performance.
While all three mediating pathways exhibit evidence consistent with partial mediation, the magnitude of the mediated effect differs across mechanisms. Sustainability reporting quality accounts for the largest proportion of the total effect (45.52%), followed by stakeholder engagement (41.73%) and sustainability-linked CEO compensation (24.63%). Importantly, the direct association between the presence of a sustainability committee and CSR performance remains positive and statistically significant after including each mediator (β = 0.043, p < 0.01 for SUSTPAY; β = 0.033, p < 0.01 for STAKE; β = 0.031, p < 0.01 for SUSTQUAL), indicating partial rather than full mediation. Nevertheless, sustainability reporting quality emerges as the strongest mediating channel, suggesting that improvements in sustainability reporting systems, disclosure quality, and related accountability mechanisms constitute an important pathway through which sustainability committees are associated with enhanced CSR performance. Furthermore, the relatively large mediated effects of sustainability reporting quality and stakeholder engagement indicate that information transparency and stakeholder responsiveness are particularly important mechanisms linking sustainability committees to superior CSR outcomes.
5.3 Alternative proxy for CSR performance
In our study, we measure CSR performance using a transformation of the CSR strengths and concerns performance score to compute an aggregate measure of CSR performance, following Kim et al. (2014). We test the robustness of our findings using the CSR net score by summing the raw scores for CSR strengths and concerns, following Kim et al. (2014) and Bose et al. (2022a). These results are not reported here for reasons of brevity. However, the unreported results show that the tenor of the findings remains the same when using this alternative CSR performance score.
5.4 CSR strengths and concerns performance
We compute our study's CSR performance proxy as overall CSR strengths minus overall CSR concerns. We next rerun our regression models by separating overall CSR performance into CSR strengths and CSR concerns. We do not report the regression results for the sake of brevity. However, the unreported results suggest a distinct relationship: the presence of a sustainability committee is positively associated with CSR strengths and negatively associated with CSR concerns.
Further analysis of the sustainability committee's characteristics reveals several interesting associations. Specifically, the gender and qualifications of committee members, as well as their overlap with the audit committee, show a positive association with CSR strengths performance. Conversely, the age of committee members is negatively associated with CSR strengths performance. This suggests that younger committee members may contribute more effectively to CSR strengths. In addition, our results indicate that a larger sustainability committee and one with greater gender diversity (indicated by the negative coefficients of COMSIZE and GENDER) tend to have reduced CSR concerns. On the other hand, the positive association between committee members’ age and qualifications with CSR concerns implies that a committee composed of older members and one with more qualifications is likely to exhibit higher CSR concerns. These findings offer nuanced insights into how different aspects of sustainability committee composition can influence a firm's CSR performance, both in terms of strengths and concerns.
5.5 Additional corporate governance variables
We also rerun our regression models to include several CG variables to evaluate the robustness of our study's findings. More specifically, we include board independence, board size and audit committee size as additional control variables. The un-tabulated results show that our findings remain qualitatively similar to the findings reported in Tables 4 and 6
5.6 Use of different sampling methods
Our sample encompasses firms from a diverse range of industries. However, firms in the financial and utilities industries possess distinct assets and liability structures that differ from those in other industries, which could potentially influence our results. To address these concerns, we rerun our baseline regression models excluding firms from the financial and utilities industries. While we do not report these regression results for brevity, the unreported results suggest that our results are qualitatively similar, thus corroborating our main findings.
Moreover, our sample period covers the Global Financial Crisis (GFC) of 2008–2009, a significant economic event with worldwide impact. Recognizing that the GFC could potentially affect our results, we conduct separate estimations of our regression models for two distinct periods: pre-GFC (2001–2007) and post-GFC (2010–2018). This approach allows us to assess the influence, if any, of the GFC on our study's outcomes. The findings from these period-specific analyses, although unreported here for conciseness, indicate consistency across both time frames. This suggests that our results are robust and unaffected by the economic disruptions caused by the GFC.
6. Conclusion
In this study, we examine the association between the presence of a sustainability committee and CSR performance. We further examine three potential underlying mechanisms that positively mediate the association between the presence of a sustainability committee and CSR performance. Finally, we investigate the association between a set of characteristics of a sustainability committee and CSR performance. We document that the presence of a sustainability committee is positively associated with CSR performance based on 27,966 firm-year observations from 2001–2018. Furthermore, we document that inclusion of sustainability targets in CEO compensation contracts, the presence of active firm-level stakeholder engagement programs and the quality of sustainability reporting serve as mediating pathways in the association between sustainability committees and CSR performance. Finally, we demonstrate that sustainability committee size, committee members’ gender, tenure and qualifications, and the overlap of sustainability committee members with audit committee members are all positively associated with CSR performance, while committee members’ age is negatively associated with CSR performance. Our findings are robust to the use of alternative proxies for CSR performance and remain consistent after employing several approaches to mitigate endogeneity concerns, including Heckman (1979) two-stage model to address potential selection bias and propensity score matching (PSM) to reduce observable differences between firms with and without a sustainability committee.
The findings of this study have important theoretical and practical implications. The existing limited number of US-based studies on a sustainability committee and firm-level CSR-related outcomes (e.g. Burke et al., 2019; Dixon-Fowler et al., 2017; Rodrigue et al., 2013) rarely examined the mechanisms that the sustainability committee employed to improve CSR-related outcomes. From a theoretical perspective, understanding the roles of these mechanisms is critically important as an individual CG element is ineffective in solitude (e.g. Post and Byron, 2015; Walls et al., 2012). Hence, several researchers call for further research on these mechanisms (e.g. Dixon-Fowler et al., 2017; Orazalin, 2020). Our study documents the mediating role played in the association between the presence of a sustainability committee and CSR performance by the following mechanisms: the inclusion of sustainability targets in CEO compensation contracts, the presence of active firm-level stakeholder engagement programs and the quality of sustainability reports. Hence, our study took the research on the presence of a sustainability committee and CSR performance a step forward.
Moreover, we extend prior works (e.g. Rodrigue et al., 2013; Walls et al., 2012) that studied the mere presence of sustainability committee as a “black box” by exploring the impact of sustainability committee member characteristics on CSR performance. Kolev et al. (2019), in their recent review of board committee literature, maintain that member characteristics affect their human capital and the committee dynamics that influence its effectiveness. In a similar vein, Endrikat et al. (2021) ask to focus on committee characteristics for a more nuanced understanding of the actions and CSR performance outcome of the presence of a sustainability committee. Hence, our study's findings make critical contributions by enhancing the understanding of the roles of sustainability committee characteristics in improving CSR performance.
Furthermore, by demonstrating the mediating roles of various mechanisms employed by a sustainability committee to boost CSR performance, this study's findings help companies understand the interaction of a sustainability committee and these mechanisms that can result in better CSR performance. Also, this study's findings that the six attributes of a sustainability committee have significant associations with CSR performance provide valuable insights for boards of directors and managers when deciding on the optimal configuration of a sustainability committee to achieve their social and environmental objectives. Finally, while the existing CG guidelines recommended ideal characteristics for audit, nominations and remuneration committees, such policy guidelines are rare for a board-level sustainability committee. The policymakers can consider the three CG mechanisms and six sustainability committee characteristics highlighted in this study and propose comprehensive guidelines and policies for shaping the sustainability committee's role in driving CSR performance.
Our study is subject to some limitations. Firstly, although we include several control variables in our regression models, we cannot rule out the possible omission of some important factors that may concurrently affect the presence of a sustainability committee, its characteristics and CSR performance. In such a case, our analyses may suffer from omitted variables bias. Secondly, our results may not necessarily be generalized to countries where the appointment of sustainability committee members is mandatory (e.g. India) or to countries with poor CSR orientation (e.g. emerging economies). Thirdly, although it is difficult to rule out the possibility of reverse causality, we have tried to address this possibility by using two-stage least squares (2SLS) instrumental variables approach. Notwithstanding these potential limitations, our study contributes to the limited existing empirical evidence on the roles of associated mechanisms that a sustainability committee employs and the committee characteristics on CSR performance. Future studies may attempt to address the limitations of this study and can develop a composite index of the strengths of a sustainability committee to extend our study.
Appendix
Notes
Spencer Stuart (2018) reported that 9% of S&P 500 firms have public policy/social and corporate responsibility committees, while 9% of firms have environment, health and safety committees. We computed 18% by adding together the percentages of these two committees as sustainability committees include both social and corporate responsibility, as well as the responsibilities of environment, health and safety committees.
The Refinitiv ESG (previously, Thomson Reuters ASSET4) database started its coverage from 2002.
We exclude the CG dimension from our CSR score as it is considered a separate construct (Kim et al., 2012, 2014). We include the CG dimension as a control variable in our research models. Moreover, we do not include exclusionary screens (i.e. alcohol, gambling, firearms, military, nuclear power and tobacco) in constructing our CSR performance measure as these factors do not pertain to a firm's discretionary activities (Bose et al., 2022a; Kim et al., 2012, 2014).
We also control for the individual corporate governance variable (CGOV) instead of the corporate governance performance score. For example, we control for board size, board independence and audit committee size. This analysis is discussed in the additional analyses section.
We acknowledge that the Baron and Kenny (1986) mediation framework has several well-documented limitations, particularly its inability to fully address unobserved confounding between the mediator and outcome variables and its reliance on a series of significance tests rather than a formal causal identification strategy. Accordingly, our mediation results should be interpreted as evidence consistent with the proposed mediating pathways rather than definitive evidence of causal mediation. To strengthen inference, we complement the Baron and Kenny approach with bootstrapped Sobel–Goodman tests and employ a lead–lag research design, although these procedures do not completely eliminate the possibility of omitted variable bias in the mediation relationships.
We measure QUAL as the natural logarithm of the average number of qualifications (e.g. Bachelor's degree, Master's degree, MBA, CPA or PhD) held by sustainability committee members. We count the total number of educational qualifications held by each member of the sustainability committee, and then average this across the total number of members.
Kim et al. (2014) computed the mean of CSR performance using data from 1994–2008.
For the regression analyses, COMSIZE, COMTEN, and QUAL are measured using their natural logarithms to reduce skewness. However, for ease of interpretation, Table 2 reports descriptive statistics based on the underlying raw measures.
We compute US$6,142.09 million using the mean of the raw value of the market capitalization.
We also run a generalized method of moments (GMM) analysis for Equation (1). For brevity, the regression results from this analysis are not reported. However, the unreported results are consistent with our main findings.
We control for firm size (FSIZE) because large firms attract more public attention and are under higher pressure to monitor CSR issues better (Bose et al., 2025b; Waddock and Graves, 1997). Existing empirical evidence (e.g. Bose et al., 2025a; Clarkson et al., 2008) suggests that debtholders (LEV) pressurize firms to monitor CSR issues better to avoid potential future liabilities. Firms with higher growth opportunities (MB) suffer from financial constraints to invest resources in monitoring and advising on CSR activities (Dhaliwal et al., 2011). While more profitable (ROA) firms have additional financial resources to invest in CSR monitoring (Dhaliwal et al., 2011), these firms may feel reduced pressures to monitor and advise managers by forming a specialized governance committee (Premuroso and Bhattacharya, 2007). Recent literature also argues and finds support that CG elements (e.g. the board size, independence, CEO duality, board meetings) either complement or substitute board-level committees (Lee, 2020). Clarkson et al. (2008) maintain that firms which raise capital (FIN) in debt and equity markets are more likely to have incentives to demonstrate better monitoring of CSR activities. Managers of firms operating in highly competitive industries (COMPET) may need better advice on CSR issues to maintain a competitive position (Flammer, 2015). Dhaliwal et al. (2011) argue that firms operating in the international market (GLOBAL) face higher pressure to monitor and advise managers on CSR issues. Firms with more liquidity (LIQUID) have a higher proportion of activist shareholders who put increased pressure on firms to monitor ethical issues more strongly (Bose et al., 2022b). High industry litigation risk (LITG) reduces the socially irresponsible behavior of firms (Bose et al., 2022b). Finally, Lee (2020) argues that older firms (FAGE) are more complicated and have a higher need to monitor and advise managers. In support of this argument, he also finds that older firms have more board committees (Lee, 2020).
We estimate SUSTCOM and OVLP model using the etregress Stata program because both SUSTCOM and OVLP are endogenous binary treatment variables.
For OVLP, our study finds the coefficient to be statistically insignificant.