


This study examines the association between investment opportunities and private firms’ performance. While the existing literature predominantly focuses on public firms, mainly from advanced economies, our study delves into private firms in developing countries worldwide. Furthermore, we explore the moderating effects of both female ownership and concentrated ownership, aiming to uncover the role of investment opportunities on firm performance in the relatively understudied context of developing countries and private firms.
We use 36,185 observations from firms in 114 countries across the world, sourced from the World Bank Enterprise Surveys (WBES) from 2006 to 2018. We estimate the regression models using ordinary least squares (OLS) regression method. We also employ an advanced supervised machine learning approach to provide additional insights into the role of investment opportunities in predicting private firms’ performance.
We find a positive association between private firms’ investment opportunities and their performance. Furthermore, our study demonstrates that female ownership positively, while concentrated ownership negatively, moderates this association.
Our study’s findings provide critical insights for the literature investigating the dynamics of the relationship with, and the impact of, investment opportunities on private firms’ performance. The roles of female ownership and concentrated ownership in moderating this relationship have important policy implications for enhancing private firms’ performance.
1. Introduction
The Resource-Based View (RBV) framework contends that a firm’s sustained competitive advantage depends on leveraging resources and capabilities that are valuable, rare, inimitable, and organised (Barney, 1991). While public firms often have more opportunities to exploit such resources, leading to superior performance (Hutchinson and Gul, 2004; Lin and Wu, 2014), private firms typically lack comparable resources and capabilities. Consequently, much of the existing research focuses on public firms, documenting positive impacts of investment opportunities on various performance metrics, including equity offerings (Corby and Stohs, 1998); compensation and performance (Baber et al., 1996); stock liquidity (Becker-Blease and Paul, 2006); secured debt financing (Chang et al., 2007); goodwill impairment write-offs (Godfrey and Koh, 2009); Big 5 auditor engagement (Lai, 2009); and audit report delays (Azami and Salehi, 2017).
However, scholarly attention on private firms’ investment opportunities and their ability to leverage scarce resources and capabilities for performance enhancement has been limited (Bar-Yosef et al., 2019). This research gap is critical to address for several reasons. Firstly, private firms are key contributors to global GDP and generate two-thirds of total employment, dominating economies worldwide, including the United States (US) and European Union (EU) (Asker et al., 2015; Eurostat, 2018; Bar-Yosef et al., 2019). Secondly, private firms possess unique characteristics, such as concentrated ownership and higher managerial ownership, which influence agency dynamics. Unlike public firms that face principal-agent conflicts, private firms often encounter principal-principal conflicts between controlling and minority shareholders (Morck et al., 1988; Dharwadkar et al., 2000). Additionally, private firms’ limited access to capital markets compels them to rely on internal financing, making the efficient exploitation of investment opportunities even more critical to their performance (Chen et al., 2011). Furthermore, governance mechanisms differ substantially; while public firms face stringent regulatory scrutiny and disclosure requirements, private firms operate with less transparency, impacting their decision-making and strategic choices (Hope et al., 2011). Despite these distinctions, no studies to date examine the impact of private firms’ investment opportunities [1] on performance, particularly using evidence from private firms in developing countries. This study addresses this gap by exploring the association between investment opportunities and firm performance in private firms and investigating how female ownership and concentrated ownership moderate this relationship.
We argue that a firm’s survival and sustained growth in competitive markets depend significantly on its ability to effectively utilise productive capacity in a constantly evolving environment. The Dynamic Capability View (DCV), an extension of the Resource-Based View (RBV), examines the influence of dynamic markets on firm performance (Helfat and Peteraf, 2003). Teece et al. (1997) introduced DCV to highlight the critical role of a firm’s capabilities in building, integrating, and reconfiguring resources to adapt to the ever-changing business landscape. The underlying premise of DCV is that firms must leverage their competencies not only for short-term competitive gains but also to establish long-term advantages. Following the accounting, finance, and economics literature, we conceptualize investment opportunities as a firm’s ability to allocate scarce resources productively, positioning them as a dynamic capability. Firms that effectively leverage investment opportunities can attract and retain talent, foster innovation, and strengthen distribution networks, all of which drive superior performance and ensure long-term survival and growth.
We measure private firms’ investment opportunities using capacity utilisation rates, following Ayyagari et al. (2011), a measure commonly employed by business analysts. Baumohl (2012) argues that capacity utilisation rates quantify economic slack and serve as leading indicators of business investment expenditure. Firms operating near full capacity are more likely to invest in additional capital and expand their workforce to increase production levels (Lane and Rosewall, 2016). To meet the constant challenges of evolving market expectations, firms must continuously enhance their processes and strategically allocate resources to develop innovative products and services. Increasing evidence indicates that a firm’s performance heavily depends on its ability to integrate, build, and reconfigure scarce resources and capabilities, ensuring survival and sustained growth in a dynamic market environment.
We further argue that a private firm’s ability to leverage its investment opportunities to enhance performance is influenced by factors such as gender diversity among owners and ownership concentration. Therefore, we investigate the moderating roles of female ownership and concentrated ownership in the relationship between investment opportunities and private firms’ performance. Prior research argues that women bring diverse knowledge, values, norms, and perspectives to a firm, which can enhance team dynamics and organizational outcomes (Ruigrok et al., 2007), strengthen management capabilities (Krishnan and Park, 2005), and drive profitability and higher stock returns (Krishnan and Parsons, 2008). Accordingly, we test whether female ownership moderates the association between investment opportunities and firm performance. Additionally, research highlights that private firms often have high ownership concentration, with shareholders frequently holding managerial positions that can result in the expropriation of minority shareholders. Chen et al. (2011) suggest that private firm shareholders are less motivated to engage in high-quality corporate disclosures or earnings management since they do not typically seek capital from public markets. The literature offers mixed evidence on the impact of concentrated ownership on firm performance: while some studies find a positive effect (Gorton and Schmid, 2000; Mitton, 2002; Kim and Lu, 2011), others report a negative or insignificant association (Demsetz and Lehn, 1985; McConnell and Servaes, 1990; Leech and Leahy, 1991; Demsetz and Villalonga, 2001; Chen et al., 2005). Thus, we examine whether concentrated ownership is likely to moderate the association between investment opportunities and firm performance.
Using 36,185 observations from 2006–2018 across 114 countries, we examine the association between private firms’ investment opportunities and their performance, and the moderating role of female ownership and concentrated ownership in this association. Our findings indicate that private firms’ investment opportunities are positively associated with their performance, suggesting that firms with greater investment opportunities achieve higher performance. Additionally, we find that female ownership strengthens this positive relationship, as female owners contribute unique resources, such as creativity and innovation, which enhance firm performance. Conversely, concentrated ownership weakens the positive association, likely due to increased agency costs and information asymmetries that hinder investment opportunities and, in turn, firm performance. To address potential endogeneity arising from both observable and unobservable selection bias, we employ the Heckman (1979) two-stage model and propensity score matching (PSM) analysis. Furthermore, we utilize an advanced supervised machine learning approach to provide deeper insights into how investment opportunities predict private firms’ performance. Additionally, we employ alternative proxies for firm performance and investment opportunities to evaluate the robustness of our findings.
The current study contributes to the literature in several ways. Firstly, to the best of the authors’ knowledge, it is the first to examine the impact of investment opportunities on firm performance using data from private firms worldwide. Prior studies highlight the scarcity of research on private firms (Chen et al., 2011; Badertscher et al., 2013; Asker et al., 2015); thus, our findings contribute to the emerging literature on private firms. Secondly, the study’s findings contribute to the dynamic capability view extended the RBV framework, as we document a significant positive association between investment opportunities and firm performance. This indicates that private firms utilising a higher capacity level achieve higher firm performance. Thus, support is found for the dynamic capability concept’s basic assumption that dynamic firms utilising their resources may generate higher firm performance to ensure their survival and continued growth. Finally, while managers have a choice to tap into investment opportunities to enhance private firms’ performance, we consider the influences of female ownership and concentrated ownership in this link. We document that private firms with a higher proportion of female ownership can achieve higher performance than private firms lacking this attribute. The positive association between investment opportunities and private firms’ performance is found to be attenuated by concentrated ownership. Overall, these findings contribute to the corporate governance and firm ownership literature regarding the implications of female ownership and concentrated ownership in private firms.
The remainder of the paper is structured as follows: Section 2 discusses the literature review, theoretical framework, and hypotheses development, while Section 3 outlines the methodology. Section 4 reports the empirical results, including the tests dealing with endogeneity concerns. Section 5 shows the sensitivity analyses and robustness checks. The conclusion is presented in Section 6.
2. Literature review, theoretical framework, and hypotheses
2.1 Investment opportunities and firm performance
In this study, with the underpinning of the DCV, we argue that investment opportunities represent a critical aspect of a firm’s dynamic capabilities that can have multiple implications for the firm’s performance. Chow et al. (2012) find that investment opportunities shape a firm’s ability to formulate its organisational business policies. Extant research demonstrates that investment opportunities assist firms in securing finance, providing dividends, and deciding compensation policies (Smith and Watts, 1992). Furthermore, investment opportunities show that, if firms have higher growth opportunities, they have a smaller amount of debt, distribute less dividends, provide a higher amount of executive compensation, and depend on additional stock option plans to motivate employees. These findings are similar to those of Gaver and Gaver (1993), who report that high growth firms have lower debt-to-equity ratios, lower dividend yields, provide higher compensation to their executives, and have higher stock option plans compared to non-growth firms.
Most of these studies, however, focus on the empirical effects of investment opportunities in the context of public firms. Limited attention has been given to exploring investment opportunities in private firms (Chen et al., 2011; Badertscher et al., 2013; Asker et al., 2015). Private firms differ in significant ways from public firms. Allee et al. (2020) present evidence from a sample of US firms showing that private firms experience lower changes in future profitability than public firms. However, the efficacy of investment opportunities is not universally guaranteed; investments may not always align with a firm’s core competencies or market demands, leading to inefficiencies (Ranasinghe and Habib, 2023). Moreover, private firms often face unique challenges, such as limited access to capital markets (Chen et al., 2011), which constrain their ability to capitalize on opportunities. External factors, such as economic downturns, regulatory changes, and shifting consumer preferences, may also negate the benefits of investments (Schwark, 2009; Bialowolski and Weziak-Bialowolska, 2014). These perspectives suggest that the impact of investment opportunities on private firms’ performance warrants further exploration in a global context.
We posit that private firms’ investment opportunities and firm performance are likely to be positively associated for several reasons. Firstly, the agency cost of private firms is relatively low compared to public firms due to concentrated ownership and control (Jensen and Meckling, 1976). This close monitoring by private firm owners is likely to enhance the firm’s value, as management strives to utilize growth opportunities effectively to improve overall performance. Secondly, dynamic capability refers to a firm’s ability to purposefully create, extend, or modify its resource base to gain a competitive advantage (Helfat et al., 2009). Firms typically prioritize resource allocation toward investment opportunities to achieve productive outcomes, such as offering innovative products, increasing market share, and expanding their customer base. Coelli et al. (2002) find a positive association between capacity utilization and profitability, attributing underperformance to unused capacity. Their study on 28 international airline companies reveals that 70% of the expected profit gap is due to unutilized capacity. Applying these insights, we argue that firms operating in volatile environments can largely attribute their performance to efficiently utilizing their investment opportunities. However, internal constraints, including managerial capacity, organizational structure, and culture, can impede effective utilization of investments, diminishing their potential to translate into enhanced performance (Park et al., 2015; García-Sánchez and García-Meca, 2018). Additionally, the phenomenon of diminishing returns suggests that beyond a certain point, additional investments yield progressively smaller increments in performance, particularly in saturated markets. Despite these challenges, we contend that when private firms effectively leverage their dynamic capabilities to utilize investment opportunities, they can significantly enhance their performance. Thus, we formulate the following hypothesis:
Investment opportunities are positively associated with private firms’ performance.
2.2 Investment opportunities and firm performance: moderating role of female ownership
One of the significant differences between public and private firms lies in their ownership and leadership structure. In public firms, ownership is entirely separated from business operations. In contrast, owners of private firms are required to leave their personal mark on strategic and day-to-day operational decisions (Amore et al., 2014). Owners’ continuous support of a private firm, through their tangible and intangible resources, results in higher firm performance, thus ensuring its survival (Kamasak, 2017). Prior research suggests that female owners tend to be more risk-averse than their male counterparts (Welch et al., 2008; Ferrary, 2009; Gallucci et al., 2015), favouring strategies that ensure long-term sustainability over short-term gains. Our hypothesis builds on this by suggesting that female owners, due to their risk-averse nature, are likely to strategically utilize investment opportunities to enhance firm performance in a sustainable manner. This does not necessarily mean they will avoid high levels of capacity utilization altogether. Rather, they will pursue such opportunities in a way that aligns with their controlled growth strategy (Cliff, 1998). It means that when they decide to utilize high levels of capacity, they do so with thorough planning and consideration of long-term implications. This strategic approach can reduce future risks by ensuring that investments are well-managed and resources are efficiently allocated. Female owners’ focus on sustainable practices and innovation can lead to improved firm performance, as research shows that female leadership is often associated with enhanced team dynamics, better conflict resolution (Krishnan and Park, 2005), and higher levels of creativity and innovation (McMahan et al., 1998). Their risk-averse nature also means they are more likely to implement robust risk management practices, carefully evaluating and strategically leveraging investment opportunities to mitigate potential risks. While female owners may seek controlled and manageable growth (Cliff, 1998), this does not preclude them from effectively utilizing high levels of capacity utilization when such opportunities arise. Instead, their strategic and risk-averse approach can lead to more efficient and effective use of resources, thereby enhancing firm performance and reducing future risks. Therefore, we argue that female ownership moderates the positive association between investment opportunities and firm performance, formulated as the following hypothesis:
Female ownership positively moderates the association between investment opportunities and firm performance.
2.3 Investment opportunities and firm performance: moderating role of concentrated ownership
Although ownership concentration can minimise principal–agent conflict, it can create another principal–principal agency problem, particularly by tunnelling resources to provide more significant benefits for majority shareholders (Dharwadkar et al., 2000). Several studies (Chen and Steiner, 1999; Vafeas, 1999) examining firms with concentrated ownership and a higher level of family dominance have found that these firms can create multilevel conflicts between the principal and agent, as well as between majority shareholders and minority shareholders, with these conflicts cascading down between these parties. These multilevel conflicts adversely affect firm performance (Courteau et al., 2017). Prior research shows that when conflict arises between owners and managers due to the misalignment of their mutual goals, if ownership is concentrated, owners can use their majority voting rights and means to discipline managers by threatening their positions (Courteau et al., 2017). This dynamic can create organisational chaos and restrain managers from making independent professional decisions, potentially disrupting firm operations. For instance, managers may prioritise their job security by colluding with concentrated ownership’s shareholders, potentially leading to resource misallocation and lower firm performance. In the long run, this can lead to corrupt practices with the firm’s resources used for private benefits, thus contributing to the firm’s lower performance. A few studies document a positive association between concentrated ownership and firm performance (Gorton and Schmid, 2000; Mitton, 2002; Kim and Lu, 2011). However, Demsetz and Villalonga (2001)) find no statistically significant relationship between ownership structure and firm performance. Furthermore, Chen et al. (2005) find no relationship between family ownership and firm performance. Similarly, Leech and Leahy (1991) find a negative and significant relationship between firms’ ownership concentration and their value and profitability. Nevertheless, Morck et al. (1988) and Thomsen and Pedersen (2000) report a curvilinear relationship between concentrated ownership and firm performance.
In summary, we argue that concentrated owners may overly engage themselves in key critical managerial decisions to reduce agency costs in our sample’s small and medium-sized enterprises (SMEs). Over-monitoring of day-to-day business affairs by concentrated owners can dissuade a firm’s management from tapping into new investment opportunities (i.e. capital utilisation), although it has a positive association with firm performance. This excessive involvement may hinder managerial autonomy, constrain strategic flexibility, and stifle innovation, thereby negatively impacting the firm’s ability to capitalise on investment opportunities. As a result, we anticipate that concentrated ownership is likely to weaken the positive relationship between investment opportunities and firm performance. Thus, we propose the following hypothesis:
Concentrated ownership negatively moderates the association between private firms’ investment opportunities and their performance.
3. Methodology
3.1 Sample and data
This study’s sample comprises all private firms covered by the World Bank Enterprise Surveys (WBES) from 2006–2018 across 114 countries worldwide [2]. The WBES are undertaken by the World Bank and its partners, covering small, medium, and large firms across all geographic regions worldwide. Each firm appears only once in the WBES, making the number of observations equivalent to the number of unique firms (Chen et al., 2011). Prior studies widely use WBES data for research on private firms (for example, Francis et al., 2008; Ayyagari et al., 2011; Chen et al., 2011; Francis et al., 2011; Ayyagari et al., 2013, 2014). The WBES include a wide range of quantitative and qualitative data, gathered through face-to-face interviews with firm managers and owners. The data cover several areas, including infrastructure, trade, finance, regulations, taxes and business licensing, corruption, crime and informality (i.e. the informal sector), innovation, labour, and perceptions of managers and owners about the constraints they face in owning or operating the business [3].
Table 1, Panel A presents the sample selection procedures. Our initial sample selection began with 139,054 observations. We omitted 70,722 observations due to insufficient data on investment opportunities and then omitted a further 14,600 observations due to a lack of availability of firm performance data. Finally, we excluded 17,547 observations due to insufficient data for control variables. Our final sample comprises 36,185 observations from 2006–2018, covering 114 countries.
Sample selection
| Panel A: sample | Observations |
|---|---|
| Over the years 2006–2018 | 139,054 |
| Less: non-availability of investment opportunity data | (70,722) |
| Less: non-availability of firm performance data | (14,600) |
| Less: non-availability of control variables | (17,547) |
| Final sample | 36,185 |
| Panel B: industry distribution | Observations | % |
|---|---|---|
| Basic metals | 1,085 | 3.00 |
| Chemicals and chemical products | 3,096 | 8.56 |
| Construction | 81 | 0.22 |
| Electricity, gas, and water | 2 | 0.01 |
| Electronics | 1,295 | 3.58 |
| Fabricated metal products | 2,963 | 8.19 |
| Food | 6,905 | 19.08 |
| Furniture | 1,877 | 5.19 |
| Garments | 4,303 | 11.89 |
| Hotels and restaurants | 18 | 0.05 |
| Information technology | 12 | 0.03 |
| Leather | 969 | 2.68 |
| Machinery and equipment | 2,096 | 5.79 |
| Mining and quarrying | 11 | 0.03 |
| Motor vehicles | 724 | 2.00 |
| Non-metallic mineral products | 2,411 | 6.66 |
| Other services | 4 | 0.01 |
| Paper | 525 | 1.45 |
| Publishing | 1,111 | 3.07 |
| Recycling | 84 | 0.23 |
| Refined petroleum | 77 | 0.21 |
| Retail | 117 | 0.32 |
| Rubber and plastics products | 2,329 | 6.44 |
| Textiles | 2,734 | 7.56 |
| Tobacco | 138 | 0.38 |
| Transport | 19 | 0.05 |
| Transport equipment | 96 | 0.27 |
| Wholesale | 110 | 0.30 |
| Wood | 993 | 2.74 |
| Total | 36,185 | 100 |
| Panel C: year-wise distribution | ||
|---|---|---|
| 2006 | 4,601 | 12.72 |
| 2007 | 4,001 | 11.06 |
| 2008 | 620 | 1.71 |
| 2009 | 1,857 | 5.13 |
| 2010 | 4,251 | 11.75 |
| 2011 | 1,181 | 3.26 |
| 2012 | 3,031 | 8.38 |
| 2013 | 4,659 | 12.88 |
| 2014 | 5,965 | 16.48 |
| 2015 | 1,839 | 5.08 |
| 2016 | 2,126 | 5.88 |
| 2017 | 1,765 | 4.88 |
| 2018 | 289 | 0.80 |
| Total | 36,185 | 100 |
| Panel D: country-wise distribution | ||||||||
|---|---|---|---|---|---|---|---|---|
| Country | N | % | Country | N | % | Country | N | % |
| Afghanistan | 64 | 0.18 | Hungary | 25 | 0.07 | Philippines | 825 | 2.28 |
| Angola | 124 | 0.34 | Indonesia | 1,435 | 3.97 | Papua New Guinea | 21 | 0.06 |
| Albania | 46 | 0.13 | India | 5,241 | 14.48 | Poland | 81 | 0.22 |
| Argentina | 1,086 | 3.00 | Iraq | 314 | 0.87 | Paraguay | 199 | 0.55 |
| Armenia | 62 | 0.17 | Israel | 158 | 0.44 | Palestine | 62 | 0.17 |
| Azerbaijan | 36 | 0.10 | Jamaica | 29 | 0.08 | Romania | 106 | 0.29 |
| Burundi | 126 | 0.35 | Jordan | 207 | 0.57 | Russia | 553 | 1.53 |
| Benin | 55 | 0.15 | Kazakhstan | 69 | 0.19 | Rwanda | 43 | 0.12 |
| Bangladesh | 1,677 | 4.63 | Kenya | 617 | 1.71 | Sudan | 14 | 0.04 |
| Bulgaria | 391 | 1.08 | Kyrgyzstan | 48 | 0.13 | Senegal | 323 | 0.89 |
| Bosnia and Herzegovina | 85 | 0.23 | Cambodia | 79 | 0.22 | Slovenia | 13 | 0.04 |
| Belarus | 65 | 0.18 | Lao PDR | 79 | 0.22 | Sierra Leone | 53 | 0.15 |
| Bolivia | 256 | 0.71 | Lebanon | 120 | 0.33 | El Salvador | 568 | 1.57 |
| Brazil | 620 | 1.71 | Liberia | 59 | 0.16 | Serbia | 56 | 0.15 |
| Bhutan | 60 | 0.17 | Sri Lanka | 249 | 0.69 | South Sudan | 31 | 0.09 |
| Botswana | 76 | 0.21 | Lesotho | 45 | 0.12 | Slovakia | 39 | 0.11 |
| Chile | 947 | 2.62 | Lithuania | 54 | 0.15 | Slovenia | 64 | 0.18 |
| China | 1,174 | 3.24 | Latvia | 28 | 0.08 | Swaziland | 76 | 0.21 |
| Côte d'Ivoire | 48 | 0.13 | Morocco | 79 | 0.22 | Chad | 55 | 0.15 |
| Cameroon | 51 | 0.14 | Moldova | 53 | 0.15 | Togo | 33 | 0.09 |
| Congo | 224 | 0.62 | Mexico | 1,566 | 4.33 | Thailand | 417 | 1.15 |
| Colombia | 1,276 | 3.53 | Macedonia | 93 | 0.26 | Tajikistan | 37 | 0.10 |
| Costa Rica | 165 | 0.46 | Mali | 294 | 0.81 | Timor-Leste | 44 | 0.12 |
| Czech Republic | 70 | 0.19 | Myanmar | 511 | 1.41 | Trinidad and Tobago | 84 | 0.23 |
| Djibouti | 6 | 0.02 | Montenegro | 18 | 0.05 | Tunisia | 193 | 0.53 |
| Dominica | 107 | 0.30 | Mongolia | 77 | 0.21 | Turkey | 485 | 1.34 |
| Ecuador | 369 | 1.02 | Mozambique | 289 | 0.8 | Tanzania | 347 | 0.96 |
| Egypt | 1,759 | 4.86 | Mauritania | 76 | 0.21 | Uganda | 328 | 0.91 |
| Estonia | 38 | 0.11 | Malawi | 81 | 0.22 | Ukraine | 37 | 0.10 |
| Ethiopia | 326 | 0.90 | Malaysia | 231 | 0.64 | Kosovo | 41 | 0.11 |
| Georgia | 63 | 0.17 | Namibia | 91 | 0.25 | Uruguay | 311 | 0.86 |
| Ghana | 392 | 1.08 | Niger | 10 | 0.03 | Uzbekistan | 65 | 0.18 |
| Guinea | 108 | 0.30 | Nigeria | 380 | 1.05 | Venezuela | 33 | 0.09 |
| Gambia | 20 | 0.06 | Nicaragua | 397 | 1.10 | Vietnam | 660 | 1.82 |
| Guinea-Bissau | 29 | 0.08 | Nepal | 319 | 0.88 | Yemen | 164 | 0.45 |
| Guatemala | 499 | 1.38 | Pakistan | 697 | 1.93 | South Africa | 595 | 1.64 |
| Honduras | 270 | 0.75 | Panama | 134 | 0.37 | Zambia | 441 | 1.22 |
| Croatia | 265 | 0.73 | Peru | 1,139 | 3.15 | Zimbabwe | 262 | 0.72 |
| Total | 36,185 | 100 | ||||||
Source(s): Authors’ own work
Table 1, Panel B shows the industry distribution of observations in our study’s sample. Our sample is dominated by food industry firms that cover 19.08% of our observations, followed by the garments industry, which accounts for 11.89%, while the electricity, gas, and water industry (0.01%) has the lowest observations. Table 1, Panel C reports the year distribution of firms in our sample. Of the observations in our sample, 2014 accounts for 16.48%, followed by 2013, which accounts for 12.88%, and 2016, which accounts for 12.72%, while 2018 accounts for only 0.80% of observations.
Furthermore, Table 1, Panel D presents the country-wise distribution of firms in our sample. The sample is dominated by firms from India (14.48%), followed by Egypt (4.86%) and Bangladesh (4.63%), while Djibouti (0.02%) represents the lowest share. This distribution highlights the regional concentration of firms in certain countries.
3.2 Measures of investment opportunities
We measure investment opportunities as a private firm’s capacity utilisation rate, following Ayyagari et al. (2011). Prior literature in economics uses industry capacity utilisation rates to measure industry investment opportunities (e.g. Ghosal and Loungani, 1996). Additionally, business analysts support capacity utilisation as an indicator measure for investment opportunities. Baumohl (2012) argues that capacity utilisation rates measure the amount of slack in an economy and are used as leading indicators of business investment expenditure. Firms that operate closer to their full capacity are more likely to have a greater propensity to invest in additional capital and to employ more employees, to increase their production (Lane and Rosewall, 2016). A higher capacity utilisation rate indicates that a firm needs to hire more employees and invest in capital stock (Lane and Rosewall, 2016) [4].
Prior research mainly studies investment opportunities using the share prices of publicly listed firms. However, studies on private firms are lacking as they are not listed on stock exchanges. Therefore, we use firm-level capacity utilisation rates as a close proxy for private firms’ investment opportunities. The WBES define capacity utilisation as the amount of current output in proportion to the maximum possible output level that can be produced by a firm using its available machinery, equipment, and regular shifts (Ayyagari et al., 2011). To measure investment opportunities, we rely on responses to the WBES question: “What was this establishment’s output produced as a proportion of the maximum output possible if using all the resources available (capacity utilisation)?” For investment opportunities, we also use the purchase of any new or used fixed assets as an alternative proxy to the WBES survey responses. Firms with a higher capacity utilisation rate are more likely to invest additional capital. Therefore, firms can hire more employees and invest in fixed assets to maximize their production level. This proxy is based on responses to the WBES question: “Did this establishment purchase any new or fixed assets, such as machinery, vehicles, equipment, land, or buildings?” The response to this question is converted into a dummy variable that takes a value of 1 if a firm invests in fixed assets; 0 otherwise.
3.3 Measures of firm performance
We use actual annual sales growth as a measure of firm performance (PERF1), computed as the percentage change in annual sales between the current fiscal year and three fiscal years ago, following prior studies (Ayyagari et al., 2014; D'Souza et al., 2017). This measure of firm performance is provided by the WBES, which deflates all sales data to 2009 using each country’s gross domestic product (GDP). All sales data are converted into 2009 US dollars (US$) by the WBES for global comparability. In addition, we use annual employment growth (PERF2) as an alternative proxy for firm performance, computed as the percentage change in full-time employment between the current year and the previous fiscal periods, following D'Souza et al. (2017), with WBES also providing these data.
3.4 Empirical models
To examine the associations between our variables of interest and investment opportunities, we estimate the following ordinary least squares (OLS) regression model:
where the dependent variable, PERF, is measured as the actual annual sales growth. Our variable of interest, INVOP, is measured as a private firm’s capacity utilisation rate, as discussed in Section 3.2. We measure FEMOWN in Equation (2) as an indicator variable that takes a value of 1 if the firm has a female owner among its owners, and 0 otherwise. The variable CONTROL in Equation (3) is measured as an indicator variable that takes a value of 1 if the largest shareholder owns more than 50% of the firm, and 0 otherwise, following Hope et al. (2011).
We also control for several variables in Equations (1)-(3), following prior studies (Beck et al., 2005; Ayyagari et al., 2011; D'Souza et al., 2017). Larger firms have a lower level of various firm-level obstacles (e.g. financing, accessing legal systems, or dealing with corruption) compared to smaller firms (Beck et al., 2005). Therefore, we control for firm size (SIZE). Beck et al. (2006) document that older firms are more likely to face less growth constraints. D'Souza et al. (2017) find that firm age is negatively associated with private firms’ performance. Therefore, we control for firm age (FAGE). Boubakri et al. (2005) contend that foreign investors bring both monitoring and expertise to the firm, resulting in better operating firm performance. Thus, we control for foreign ownership (FOROWN). We also control for financial credibility (FINCRED), which brings transparency (Hope et al., 2011) and enhancing firm performance.
Export-oriented firms are more exposed to foreign markets, technology, and managerial expertise than firms that only operate domestically (D'Souza et al., 2017). Beck et al. (2005) document that export-oriented firms outperform their counterparts in terms of growth and firm performance. D'Souza et al. (2017) find that exporting firms are positively associated with private firms’ performance; our study, therefore, controls for export status (EXPORT). Firms with limited liability corporation status (CORP) may have a higher propensity than their counterparts to obtain external finance through banks, possibly leading to better firm performance. Therefore, we control for a firm’s limited liability corporation status (CORP). In addition, Beck et al. (2005) find that financing obstacles and corruption negatively affect a firm’s growth. Thus, we control for firm-level financing constraints (FINCONS) and business risk (BUSRISK). Furthermore, firms with greater dependence on external finance may have lower firm performance; thus, our study controls for external finance (EXTDEP). We also control for firm-level innovation (INNOV) as innovation may lead to better firm performance. Appendix provides descriptions of the variables.
Furthermore, we include industry, year, and country fixed effects in our regression models to capture unobserved heterogeneity in relation to industry, year, and country. The variance inflation factor (VIF) is used to evaluate the potential for multicollinearity in our regression models. To support our first hypothesis (H1), a significant positive coefficient (β1) of INVOP in Equation (1) is expected. Similarly, a significant positive coefficient (β2) of INVOP × FEMOWN in Equation (2) and a significant negative coefficient (β2) of INVOP × CONTROL in Equation (3) are expected in support of our second and third hypotheses (H2 and H3), respectively.
4. Empirical results
4.1 Descriptive statistics and correlation analysis
Table 2, Panel A reports the descriptive statistics of the variables used in Equations (1)-(3). The average (median) firm performance, measured by actual sales growth, is 0.010 (0.000), indicating that the average actual sales growth for firms in our sample is 1%. This amount of sales growth can be explained based on the first-quartile, median, and third-quartile amounts of sales growth. The first quartile of sales growth is −8.4%, while the median sales growth is −0.0%, and the third quartile sales growth is 9.90%. The average investment opportunities, as measured by capacity utilisation, are 75.00%, close to the 78.80% reported by Ayyagari et al. (2014).
Descriptive statistics
| Panel A: descriptive statistics | ||||||
|---|---|---|---|---|---|---|
| N | Mean | Std. dev | Median | 1st quartile | 3rd quartile | |
| PERF1 | 36,185 | 0.010 | 0.242 | 0.000 | −0.084 | 0.099 |
| PERF2 | 35,155 | 0.038 | 0.153 | 0.000 | 0.000 | 0.111 |
| INVOP | 36,185 | 0.750 | 0.209 | 0.800 | 0.600 | 0.900 |
| SIZE | ||||||
| Small | 13,734 | 0.380 | 0.000 | 1.000 | 1.000 | 1.000 |
| Medium | 13,611 | 0.376 | 0.000 | 1.000 | 1.000 | 1.000 |
| Large | 8,840 | 0.244 | 0.000 | 1.000 | 1.000 | 1.000 |
| FAGE | 36,185 | 2.880 | 0.669 | 2.890 | 2.398 | 3.332 |
| FEMOWN | 36,185 | 0.307 | 0.461 | 0.000 | 0.000 | 1.000 |
| CONTROL | 36,185 | 0.720 | 0.449 | 1.000 | 0.000 | 1.000 |
| FOROWN | 36,185 | 0.068 | 0.234 | 0.000 | 0.000 | 0.000 |
| FINCRED | 36,185 | 0.556 | 0.497 | 1.000 | 0.000 | 1.000 |
| EXPORT | 36,185 | 0.097 | 0.247 | 0.000 | 0.000 | 0.000 |
| FINCONS | 36,185 | 1.473 | 1.312 | 1.000 | 0.000 | 2.000 |
| BUSRISK | 36,185 | 0.011 | 0.310 | 0.000 | 0.000 | 0.000 |
| CORP | 36,185 | 0.430 | 0.495 | 0.000 | 0.000 | 1.000 |
| EXTDEP | 36,185 | 0.323 | 0.345 | 0.200 | 0.000 | 0.600 |
| INNOV | 36,185 | 1.594 | 1.220 | 2.000 | 1.000 | 3.000 |
| Panel B: mean and median tests | ||||||
|---|---|---|---|---|---|---|
| HIGH_INVOP (N = 19,695) | LOW_INVOP (N = 16,490) | Mean test (t-test) | Median test (z-test) | |||
| Mean | Median | Mean | Median | |||
| PERF1 | 0.023 | 0.009 | −0.006 | −0.012 | 11.600*** | 14.848*** |
| PERF2 | 0.050 | 0.023 | 0.025 | 0.000 | 15.150*** | 16.583*** |
| SIZE | 1.946 | 2.000 | 1.768 | 2.000 | 21.900*** | 21.445*** |
| FAGE | 2.857 | 2.833 | 2.906 | 2.890 | −6.946*** | −7.318*** |
| FEMOWN | 0.305 | 0.000 | 0.308 | 0.000 | −0.550 | −0.540 |
| CONTROL | 0.730 | 1.000 | 0.708 | 1.000 | 4.550*** | 4.534*** |
| FOROWN | 0.070 | 0.000 | 0.066 | 0.000 | 1.700* | −0.111 |
| FINCRED | 0.559 | 1.000 | 0.551 | 1.000 | 1.450 | 1.442 |
| EXPORT | 0.112 | 0.000 | 0.081 | 0.000 | 11.800*** | 8.690*** |
| FINCONS | 1.325 | 1.000 | 1.649 | 2.000 | −23.550*** | −22.620*** |
| BUSRISK | 0.011 | 0.000 | 0.011 | 0.000 | −0.050 | −6.832*** |
| CORP | 0.412 | 0.000 | 0.451 | 0.000 | −7.491*** | −7.486*** |
| EXTDEP | 0.300 | 0.200 | 0.350 | 0.300 | −13.700*** | −13.357*** |
| INNOV | 1.688 | 2.000 | 1.482 | 1.000 | 16.100*** | 15.841*** |
Note(s): Superscript ***, **, and * represent statistical significance at the 1, 5, and 10% levels, respectively, two-tailed. Descriptions of variables are provided in Appendix
Source(s): Authors’ own work
We measure firm size (SIZE) using WBES categories: large, medium-sized, and small. Our sample comprises 38% small firms, 37.60% medium-sized firms, and 24.40% large firms, closely aligning with Ayyagari et al. (2014). The average value of the natural logarithm of firm age (FAGE) in our sample is 2.880, corresponding to an average firm age of 21.28 years, which is close to the 20.61 years reported by Hope et al. (2011). About 30.70% of firms in our sample are owned by female entrepreneurs (FEMALE). The average foreign ownership of firms in our sample is 6.80%. About 72% of firms in our sample are controlled by block-owners (CONTROL) that is, those who hold more than 50% of ownership, which is close to 69%, as reported by Hope et al. (2011). Approximately 55.60% of firms in our sample have voluntary assurance services (FINCRED) for their financial statements. The average financial constraints (FINCONS) of firms in our sample is 1.47, which is close to 1.45, as Hope et al. (2011) reported. The average percentage of sales revenue paid by firms in our sample to government officials as bribes (BUSRISK) is 1.10%, which is close to 1.34%, as Ayyagari et al. (2014) reported. About 43% of firms in our sample have corporation (CORP) as their legal status, which is close to 39%, as Ayyagari et al. (2014) reported. On average, firms in our sample obtain 32.30% of their current financing (EXTDEP) from external sources, for example, equity, local commercial banks, and foreign banks. The average innovation measure of firms in our sample is 1.594.
Table 2, Panel B reports the mean and median test results of variables based on a firm’s high and low levels of investment opportunities [5]. The results indicate that firms with higher investment opportunities (HIGH_INVOP) are more likely to have higher firm performance in relation to sales growth (PERF1) and annual employment growth (PERF2); be larger in size (SIZE); have a higher level of concentrated ownership (CONTROL); be exporters (EXPORT); have lower financial constraints (FINCONS); make lower bribe payments (BUSRISK); and be more innovative (INNOV) than firms with lower investment opportunities (LOW_INVOP). Furthermore, firms with higher investment opportunities (HIGH_INVOP) have been in the market for a shorter time (FAGE); have less dependence on external financing (EXTDEP); and are not as likely to be a limited liability corporation (CORP), in comparison to firms with lower investment opportunities (LOW_INVOP).
Table 3 shows Pearson’s correlation matrix between the firm-level variables. As predicted, firm performance (PERF_GROWTH) is positively correlated with investment opportunities (INVOP). Overall, the correlation matrix shows no high correlations between variables except for between FINCRED and INNOV, with a significant positive correlation of 0.615. Furthermore, we examine the variance inflation factor (VIF) values to assess multicollinearity. The mean VIF value of the variables is 1.16, with a VIF value greater than 10 considered high (Gujarati and Porter, 2009). The lowest VIF value is 1.00, while the highest VIF value is 1.55, suggesting that multicollinearity problems are unlikely to be present in our regression models.
Correlation matrix
| PERF1 | PERF2 | INVOP | SIZE | FAGE | FEMOWN | CONTROL | FOROWN | FINCRED | EXPORT | FINCONS | BUSRISK | CORP | EXTDEP | INNOV | |
|---|---|---|---|---|---|---|---|---|---|---|---|---|---|---|---|
| PERF1 | 1.000 | ||||||||||||||
| PERF2 | 0.249*** | 1.000 | |||||||||||||
| INVOP | 0.076*** | 0.095*** | 1.000 | ||||||||||||
| SIZE | 0.040*** | 0.060*** | 0.123*** | 1.000 | |||||||||||
| FAGE | −0.073*** | −0.158*** | −0.041*** | 0.208*** | 1.000 | ||||||||||
| FEMOWN | 0.017*** | −0.006 | −0.019*** | 0.055*** | 0.054*** | 1.000 | |||||||||
| CONTROL | −0.014*** | 0.026*** | 0.023*** | −0.158*** | −0.096*** | −0.150*** | 1.000 | ||||||||
| FOROWN | 0.016*** | 0.001 | 0.007 | 0.193*** | −0.004 | −0.038*** | 0.022*** | 1.000 | |||||||
| FINCRED | 0.010** | 0.005 | 0.020*** | 0.327*** | 0.133*** | 0.017*** | −0.106*** | 0.128*** | 1.000 | ||||||
| EXPORT | 0.023*** | 0.008 | 0.048*** | 0.311*** | 0.023*** | 0.031*** | −0.067*** | 0.213*** | 0.122*** | 1.000 | |||||
| FINCONS | −0.034*** | −0.013** | −0.134*** | −0.133*** | −0.043*** | −0.020*** | 0.027*** | −0.048*** | −0.071*** | −0.065*** | 1.000 | ||||
| BUSRISK | −0.024*** | −0.005 | −0.006 | −0.002 | −0.007 | −0.002 | 0.004 | 0.022*** | −0.001 | −0.002 | 0.012** | 1.000 | |||
| CORP | 0.038*** | −0.013** | −0.049*** | 0.267*** | 0.142*** | 0.167*** | −0.239*** | 0.143*** | 0.082*** | 0.148*** | −0.032*** | −0.006 | 1.000 | ||
| EXTDEP | 0.023*** | 0.012** | −0.084*** | 0.115*** | 0.061*** | 0.078*** | −0.085*** | −0.004 | 0.081*** | 0.072*** | 0.123*** | −0.000 | 0.163*** | 1.000 | |
| INNOV | 0.060*** | 0.026*** | 0.076*** | 0.515*** | 0.179*** | 0.095*** | −0.152*** | 0.173*** | 0.330*** | 0.248*** | −0.141*** | 0.003 | 0.313*** | 0.133*** | 1.000 |
Note(s): Superscript ***, **, and * represent statistical significance at the 1, 5, and 10% levels, respectively, two-tailed. Descriptions of variables are provided in Appendix
Source(s): Authors’ own work
4.2 Regression results
Hypothesis 1 (H1) predicts that private firms with a higher level of investment opportunities are positively associated with enhanced firm performance, while H2 and H3 posit that female ownership positively, and concentrated ownership negatively, moderate the positive association between investment opportunities and firm performance. We report the regression results for Equations (1), (2), and (3) in Table 4, Models (1)–(4). Model (1) only reports the regression results of all control variables, while Model (2) reports the regression results of the association between investment opportunities and firm performance. The coefficient of INVOP in Model (2) is positive and statistically significant (β = 0.084, p < 0.01), indicating that private firms’ investment opportunities are positively associated with their performance. Therefore, our H1 is supported. This finding can be interpreted to mean that private firms with a higher level of investment opportunities have a higher propensity to invest in additional capital and employ more employees, which, in turn, enhances their firms’ performance. In terms of economic significance, the estimated coefficient in Model (2) suggests that, with an increase of one standard deviation in investment opportunities, firm performance increases by 1.756%.
Regression results between investment opportunities and firm performance and the moderating roles of female ownership and concentrated ownership
| Predicted sign | Dependent variable = Firm performance (PERF1) | ||||
|---|---|---|---|---|---|
| Model (1) | Model (2) | Model (3) | Model (4) | ||
| INVOP | + | – | 0.084*** | 0.074*** | 0.120*** |
| (5.296) | (4.705) | (5.153) | |||
| INVOP × FEMOWN | + | – | – | 0.031** | – |
| (2.290) | |||||
| INVOP × CONTROL | – | – | – | – | −0.049** |
| (−2.372) | |||||
| FEMOWN | ? | 0.001 | 0.001 | −0.021* | 0.001 |
| (0.179) | (0.311) | (−1.872) | (0.320) | ||
| CONTROL | – | −0.004 | −0.005 | −0.005 | 0.031** |
| (−1.247) | (−1.573) | (−1.552) | (1.990) | ||
| SIZE | + | 0.011*** | 0.009*** | 0.009*** | 0.009*** |
| (4.212) | (3.404) | (3.404) | (3.340) | ||
| FAGE | ? | −0.037*** | −0.036*** | −0.036*** | −0.036*** |
| (−9.701) | (−9.245) | (−9.261) | (−9.260) | ||
| FOROWN | + | 0.000 | −0.000 | 0.000 | 0.000 |
| (0.007) | (−0.010) | (0.000) | (0.068) | ||
| FINCRED | + | 0.005 | 0.005 | 0.005 | 0.005 |
| (1.191) | (1.320) | (1.273) | (1.315) | ||
| EXPORT | + | −0.005 | −0.006 | −0.006 | −0.006 |
| (−0.628) | (−0.713) | (−0.704) | (−0.773) | ||
| FINCONS | – | −0.003* | −0.002 | −0.002 | −0.002 |
| (−1.919) | (−1.424) | (−1.433) | (−1.425) | ||
| BUSRISK | – | −0.017*** | −0.017*** | −0.017*** | −0.017*** |
| (−10.547) | (−10.975) | (−11.016) | (−11.050) | ||
| CORP | + | −0.010* | −0.009* | −0.009* | −0.009* |
| (−1.808) | (−1.738) | (−1.728) | (−1.717) | ||
| EXTDEP | + | 0.005 | 0.008 | 0.008 | 0.008 |
| (0.722) | (1.157) | (1.152) | (1.136) | ||
| INNOV | + | 0.006*** | 0.005** | 0.005** | 0.005** |
| (2.864) | (2.587) | (2.609) | (2.601) | ||
| CONSTANT | ? | 0.328*** | 0.263*** | 0.270*** | 0.237*** |
| (6.382) | (4.994) | (5.140) | (4.430) | ||
| Year fixed effects | Yes | Yes | Yes | Yes | |
| Industry fixed effects | Yes | Yes | Yes | Yes | |
| Country fixed effects | Yes | Yes | Yes | Yes | |
| Observations | 36,185 | 36,185 | 36,185 | 36,185 | |
| R-squared | 0.087 | 0.091 | 0.092 | 0.092 | |
| Gujarati and Porter (2009), ∆R2-F-statistic (Model 1 vs. Model 2) | 183.585*** | ||||
| Gujarati and Porter (2009), ∆R2-F-statistic (Model 2 vs. Model 3) | 5.91** | ||||
| Gujarati and Porter (2009), ∆R2-F-statistic (Model 2 vs. Model 4) | 14.00*** | ||||
| Test: INVOP + INVOP × FEMOWN = 0 | 16.78*** | ||||
| Test: INVOP + INVOP × CONTROL = 0 | 15.79*** | ||||
Note(s): Superscript ***, **, and * represent statistical significance at the 1, 5, and 10% levels, respectively, two-tailed. Coefficient values (robust t-statistics) are shown with standard errors clustered at the country level. Descriptions of variables are provided in Appendix
Source(s): Authors’ own work
The explanatory power (R-squared [R2]) of the model with investment opportunities (INVOP) is 9.10%, as shown in Table 4, Model (2). We further evaluate the incremental contribution of the INVOP variable to the explanatory power of Model (2). Following Gujarati and Porter (2009), we repeat our main regression model in Table 4 after excluding the INVOP variable, as shown in Model (1). The R-squared value of Model (1) is reduced to 8.70%. Following Gujarati and Porter (2009), using the R-squared values of Models (1) and (2), the F-statistic is then computed. As reported in Table 4, Gujarati and Porter's (2009) F-statistic is 183.585, which is statistically significant at 1%, indicating that the variable, INVOP, provides significant information for predicting private firms’ performance.
Furthermore, we report the regression results for H2 in Table 4, Model (3). In Model (2), the coefficient of the interaction term, INVOP × FEMOWN, suggests the difference in the effects of investment opportunities on firm performance between private firms with female ownership and those without female ownership. The coefficient of INVOP captures the effect of investment opportunities on firm performance of private firms without female ownership. The sum of the coefficients of INVOP and INVOP × FEMOWN captures the effect of investment opportunities on firm performance for private firms with female ownership. The coefficient of INVOP is positive and statistically significant (β = 0.074, p < 0.01), suggesting that, for private firms without female ownership, an increase in their investment opportunities enhances firm performance. Furthermore, the coefficient of INVOP × FEMOWN is positive and statistically significant (β = 0.031, p < 0.05) in Model (3), supporting Hypothesis 2 (H2). This finding suggests that female ownership enhances the positive association between investment opportunities and firm performance. Additionally, the sum of the coefficients of INVOP and the interaction term, INVOP × FEMOWN, in Model (3) is positive and the test of the linear combination of the coefficients of INVOP and INVOP × FEMOWN shows statistical significance (F = 16.78, p < 0.01) [6]. In terms of economic significance, the estimated coefficient of INVOP × FEMOWN in Model (3) indicates that, with an increase of one standard deviation in investment opportunities, firm performance increases by 2.20%.
We next report the regression results for Hypothesis 3 (H3) in Table 4, Model (4). In Model (4), the coefficient of the interaction term, INVOP × CONTROL, suggests the difference in the effects of investment opportunities on firm performance of private firms with concentrated ownership and those without concentrated ownership. The coefficient of INVOP is positive and statistically significant (β = 0.120, p < 0.01), suggesting that higher investment opportunities enhance firm performance for private firms without concentrated ownership. On the other hand, the coefficient of INVOP × CONTROL is negative and statistically significant (β = −0.049, p < 0.05) in Model (4), indicating that the positive impact of investment opportunities on firm performance reduces for private firms with concentrated ownership. This finding suggests that concentrated ownership attenuates the positive association between investment opportunities and firm performance. Additionally, the sum of the coefficients of INVOP and the interaction term, INVOP × CONTROL, in Model (4) is positive, and the test of the linear combination of the coefficients of INVOP and INVOP × CONTROL shows statistical significance (F = 15.79, p < 0.01). In terms of economic significance, the estimated coefficient indicates that, with a one standard deviation increase in investment opportunities, firm performance increases by 2.51% for firms without concentrated ownership, while firm performance decreases by 1.48% for firms with concentrated ownership.
Regarding control variables, our results indicate that private firms that are larger (SIZE) with a higher level of innovation performance (INNOV) have a higher level of firm performance. We also document that private firms of long standing in the market (FAGE), with higher levels of business risk (BUSRISK) and limited liability corporation status (CORP), have lower firm performance. The negative coefficient of firm age (FAGE) is not surprising as younger private firms are more innovative and use technologies to cope with market competition, thus increasing their performance compared to older firms. Furthermore, facing higher business risk (BUSRISK) may reduce the competitiveness of a private firm; consequently, firm performance reduces. Similarly, firms with limited liability corporation status (CORP)have lower firm performance compared to other forms of organisation.
Overall, we document that private firms’ investment opportunities are positively associated with firm performance, and that female ownership positively, and concentrated ownership negatively, moderate the positive association between investment opportunities and firm performance.
4.3 Additional country-level control variables
Our main analysis uses country-fixed effects to account for country-level omitted variables. However, -fixed effects do not show the specific country-level factors contributing to the association between investment opportunities and firm performance. Therefore, we test the robustness of our findings by including additional country-level variables. More specifically, we control for country-level gross domestic product (GDP); financial development (FINDEV); legal tradition (LAW); general financing constraints (GFC); general corruption constraints (GCORR); judicial constraints (JUDC); and legal enforcement (ENFORCE). We measure all these country-level variables (except for GDP, FINDEV, and LAW) using the WBES questionnaire. After concentrated for these additional country-level factors, we document qualitatively similar results. We report the regression results in Table 5.
Regression results between investment opportunities and firm performance and the moderating roles of female ownership and concentrated ownership: controlling for additional country-level variables
| Predicted sign | Dependent variable = Firm performance (PERF1) | |||
|---|---|---|---|---|
| Model (1) | Model (2) | Model (3) | ||
| INVOP | + | 0.083*** | 0.072*** | 0.120*** |
| (4.199) | (3.660) | (4.422) | ||
| INVOP × FEMOWN | + | – | 0.031** | – |
| (2.083) | ||||
| INVOP × CONTROL | – | – | – | −0.054** |
| (−2.262) | ||||
| FEMOWN | ? | −0.004 | −0.027* | −0.004 |
| (−0.570) | (−1.973) | (−0.570) | ||
| CONTROL | – | −0.002 | −0.002 | 0.039** |
| (−0.646) | (−0.630) | (2.068) | ||
| SIZE | + | 0.005 | 0.005 | 0.005 |
| (1.321) | (1.319) | (1.283) | ||
| FAGE | ? | −0.034*** | −0.034*** | −0.034*** |
| (−6.865) | (−6.868) | (−6.872) | ||
| FOROWN | + | −0.012 | −0.012 | −0.011 |
| (−1.396) | (−1.404) | (−1.367) | ||
| FINCRED | + | 0.006 | 0.006 | 0.006 |
| (1.072) | (1.045) | (1.078) | ||
| EXPORT | + | 0.004 | 0.004 | 0.003 |
| (0.387) | (0.393) | (0.327) | ||
| FINCONS | – | −0.002 | −0.002 | −0.002 |
| (−0.919) | (−0.928) | (−0.918) | ||
| BUSRISK | – | −0.017*** | −0.017*** | −0.017*** |
| (−12.356) | (−12.432) | (−12.509) | ||
| CORP | + | −0.003 | −0.003 | −0.003 |
| (−0.508) | (−0.499) | (−0.537) | ||
| EXTDEP | + | 0.013 | 0.013 | 0.012 |
| (1.357) | (1.365) | (1.338) | ||
| INNOV | + | 0.010*** | 0.010*** | 0.010*** |
| (3.127) | (3.160) | (3.167) | ||
| LNGDP | ? | 0.001 | 0.001 | 0.001 |
| (0.107) | (0.128) | (0.110) | ||
| FINDEV | ? | −0.000 | −0.000 | −0.000 |
| (−0.587) | (−0.586) | (−0.585) | ||
| LAW | ? | −0.028 | −0.027 | −0.028 |
| (−1.505) | (−1.486) | (−1.532) | ||
| GFC | ? | −0.031 | −0.030 | −0.030 |
| (−1.448) | (−1.433) | (−1.424) | ||
| GCORR | ? | −0.014 | −0.013 | −0.014 |
| (−0.768) | (−0.742) | (−0.759) | ||
| JUDC | ? | −0.044** | −0.045** | −0.044** |
| (−2.336) | (−2.335) | (−2.320) | ||
| ENFORCE | ? | −0.097*** | −0.097*** | −0.097*** |
| (−3.346) | (−3.325) | (−3.324) | ||
| CONSTANT | ? | 0.388*** | 0.392*** | 0.358*** |
| (3.437) | (3.487) | (3.112) | ||
| Year fixed effects | Yes | Yes | Yes | |
| Industry fixed effects | Yes | Yes | Yes | |
| Country fixed effects | Yes | Yes | Yes | |
| Observations | 26,402 | 26,402 | 26,402 | |
| R-squared | 0.041 | 0.041 | 0.041 | |
| Test: INVOP + INVOP × FEMOWN = 0 | 12.27*** | |||
| Test: INVOP + INVOP × CONTROL = 0 | 10.62*** | |||
Note(s): Superscript ***, **, and * represent statistical significance at the 1, 5, and 10% levels, respectively, two-tailed. Coefficient values (robust t-statistics) are shown with standard errors clustered at the country level. Descriptions of variables are provided in Appendix
Source(s): Authors’ own work
4.4 Endogeneity analyses
4.4.1 Heckman’s (1979) two-stage analysis
Private firms voluntarily decide whether to invest at the highest level of their capacity as they may face financial constraints and lack of pressure as these firms are not public firms. Therefore, self-selection bias may affect our findings. We use Heckman’s (1979) two-stage approach to mitigate self-selection bias. In the first stage, we run a determinant model of a firm’s decision to choose a higher versus a lower level of investment opportunities. The inverse Mills ratio (IMR) is then computed from the first-stage model, with this ratio used in the second-stage model, as shown in Equations (1), (2), and (3). For the first-stage model, we select industry-level investment opportunities (INVOP_IND); firm size (SIZE); firm age (FAGE); foreign ownership (FOROWN); export status (EXPORT); financial constraints (FINCONS); bribes (BUSRISK); legal status (CORP); external dependence (EXTDEP); and innovation (INNOV). Table 6 reports both the first-stage and second-stage regression results. The results suggest that our findings remain the same after controlling for self-selection bias.
Heckman’s (1979) two-stage analysis
| Predicted sign | First stage | Second stage | |||
|---|---|---|---|---|---|
| Dependent variable = INVOP | Dependent variable = Firm performance (PERF1) | ||||
| Model (1) | Model (2) | Model (3) | Model (4) | ||
| INVOP | + | – | 0.083*** | 0.073*** | 0.119*** |
| (5.251) | (4.656) | (5.128) | |||
| INVOP × FEMOWN | + | – | – | 0.031** | – |
| (2.309) | |||||
| INVOP × CONTROL | – | – | – | – | −0.049** |
| (−2.373) | |||||
| FEMOWN | ? | – | 0.001 | −0.022* | 0.001 |
| (0.319) | (−1.888) | (0.328) | |||
| CONTROL | – | – | −0.005 | −0.005 | 0.031** |
| (−1.574) | (−1.553) | (1.992) | |||
| SIZE | + | 0.131*** | 0.007* | 0.007* | 0.007* |
| (6.516) | (1.746) | (1.722) | (1.693) | ||
| FAGE | ? | −0.087*** | −0.034*** | −0.034*** | −0.034*** |
| (−5.913) | (−8.308) | (−8.308) | (−8.314) | ||
| FOROWN | + | 0.003 | −0.000 | −0.000 | 0.000 |
| (0.066) | (−0.021) | (−0.010) | (0.058) | ||
| FINCRED | + | 0.005 | 0.005 | 0.005 | |
| (1.324) | (1.277) | (1.320) | |||
| EXPORT | + | 0.139*** | −0.008 | −0.008 | −0.008 |
| (2.649) | (−1.005) | (−1.009) | (−1.072) | ||
| FINCONS | – | −0.062*** | −0.001 | −0.001 | −0.001 |
| (−7.391) | (−0.587) | (−0.572) | (−0.581) | ||
| BUSRISK | – | −0.001 | −0.017*** | −0.017*** | −0.017*** |
| (−0.070) | (−10.879) | (−10.920) | (−10.955) | ||
| CORP | + | −0.022 | −0.009* | −0.009* | −0.009* |
| (−0.776) | (−1.685) | (−1.673) | (−1.663) | ||
| EXTDEP | + | −0.184*** | 0.011 | 0.011 | 0.011 |
| (−3.017) | (1.371) | (1.381) | (1.359) | ||
| INVOP | + | 0.051* | 0.004** | 0.004** | 0.004* |
| (1.790) | (1.988) | (1.990) | (1.981) | ||
| INVOP_IND | + | 3.148*** | – | – | – |
| (7.039) | |||||
| IMR | ? | – | −0.028 | −0.029 | −0.028 |
| (−0.787) | (−0.820) | (−0.801) | |||
| CONSTANT | ? | −2.021*** | 0.283*** | 0.292*** | 0.258*** |
| (−5.298) | (4.395) | (4.524) | (3.968) | ||
| Year fixed effects | Yes | Yes | Yes | Yes | |
| Industry fixed effects | Yes | Yes | Yes | Yes | |
| Country fixed effects | Yes | Yes | Yes | Yes | |
| Observations | 36,185 | 36,185 | 36,185 | 36,185 | |
| Pseudo R-squared/R-squared | 0.079 | 0.092 | 0.092 | 0.092 | |
| Test: INVOP + INVOP × FEMOWN = 0 | 16.56*** | ||||
| Test: INVOP + INVOP × CONTROL = 0 | 15.56*** | ||||
Note(s): Superscript ***, **, and * represent statistical significance at the 1, 5, and 10% levels, respectively, two-tailed. Coefficient values (robust t-statistics) are shown with standard errors clustered at the country level. Descriptions of variables are provided in Appendix
Source(s): Authors’ own work
The results show that the coefficient of INVOP_IND is positive and statistically significant (β = 3.148, p < 0.01), suggesting that industry-level investment opportunities are an important factor in a private firm’s decision of whether to invest at the highest level of its capacity. Furthermore, we document that firm size (SIZE), firm age (FAGE), export status (EXPORT), and innovation (INNOV) are positively associated with a firm’s decision to utilize its higher-level capacity for investment. Additionally, financial constraints (FINCONS) and external finance (EXTDEP) are negatively associated with a firm’s decision to invest at a higher level of investment opportunities.
4.4.2 Propensity score matching (PSM) analysis
As private firms voluntarily decide whether to invest at their highest level of capacity, they are not randomly assigned to treatment or control groups based on making decisions about higher or lower investment opportunities but self-select into these groups. We apply the propensity score matching technique to control for this self-selection bias following prior studies (Bose et al., 2022a, b), where we run our regression models on a matched-pair sample. Firms with higher and lower investment opportunities are matched based on their propensity score, allowing for multivariate analysis to be conducted like regression is performed on a randomized experiment sample (Guo and Fraser, 2015).
Table 7, Panel A reports the results of the probit regression. As expected, the propensity of a firm to choose higher investment opportunities is positively associated with firm size (SIZE), export status (EXPORT), and innovation (INNOV), while being negatively associated with firm age (FAGE), financial constraints (FINCONS), and dependence on external financing (EXTDEP). We match firms with higher INVOP with those with lower INVOP based on the sample’s median and propensity scores, using both the caliper and nearest neighbour matching methods, within a range of 0.01 (Guo and Fraser (2015). This yields a sample of 27,618 firm-year observations for the caliper matching method and 28,555 for the nearest neighbour matching method. Comparing the covariates between the matched groups (Table 7, Panel B), we find no significant differences between matched firm-year observations using either the caliper matching method or the nearest neighbour matching method.
Propensity score matching analysis
| Panel A: first-stage regression using caliper matching and nearest neighbour matching | |||
|---|---|---|---|
| Predicted sign | First-stage regression | ||
| Dependent variable = INVOP_DUM | |||
| Caliper matching | Nearest neighbour matching | ||
| Model (1) | Model (2) | ||
| SIZE | + | 0.230*** | 0.141*** |
| (12.160) | (12.180) | ||
| FAGE | ? | −0.138*** | −0.084*** |
| (−7.560) | (−7.530) | ||
| FEMOWN | + | −0.043 | −0.025 |
| (−1.610) | (−1.560) | ||
| CONTROL | + | 0.111*** | 0.070*** |
| (4.140) | (4.230) | ||
| FOROWN | + | −0.010 | −0.006 |
| (−0.200) | (−0.020) | ||
| FINCRED | + | −0.089*** | −0.053*** |
| (−3.250) | (−3.150) | ||
| EXPORT | + | 0.248*** | 0.153*** |
| (4.730) | (4.810) | ||
| FINCONS | – | −0.103*** | −0.063*** |
| (−11.170) | (−11.080) | ||
| BUSRISK | – | −0.006 | −0.002 |
| (−0.160) | (−0.100) | ||
| CORP | + | −0.001 | −0.001 |
| (−0.040) | (−0.000) | ||
| EXTDEP | + | −0.291*** | −0.181*** |
| (−8.310) | (−8.420) | ||
| INNOV | + | 0.092*** | 0.055*** |
| (7.140) | (6.980) | ||
| Intercept | ? | 0.133 | 0.094 |
| (0.420) | (0.480) | ||
| Year fixed effects | Yes | Yes | |
| Industry fixed effects | Yes | Yes | |
| Country fixed effects | Yes | Yes | |
| Observations | 36,185 | 36,185 | |
| Pseudo R-squared/R-squared | 0.078 | 0.078 | |
| Panel B: comparison of firm characteristics between treatment and control groups | ||||||
|---|---|---|---|---|---|---|
| Caliper matching | Nearest neighbour matching | |||||
| HIGHER INVOP (treatment) | LOWER INVOP (control) | t-statistic for difference | HIGHER INVOP (treatment) | LOWER INVOP (control) | t-statistic for difference | |
| SIZE | 1.840 | 1.823 | 0.148 | 1.946 | 1.957 | 0.156 |
| FAGE | 2.892 | 2.892 | 0.993 | 2.857 | 2.863 | 0.367 |
| FEMOWN | 0.297 | 0.298 | 0.927 | 0.306 | 0.306 | 0.878 |
| CONTROL | 0.716 | 0.716 | 0.936 | 0.729 | 0.722 | 0.122 |
| FOROWN | 0.069 | 0.068 | 0.739 | 0.070 | 0.072 | 0.424 |
| FINCRED | 0.560 | 0.557 | 0.654 | 0.559 | 0.556 | 0.471 |
| EXPORT | 0.089 | 0.089 | 0.999 | 0.111 | 0.111 | 0.784 |
| FINCONS | 1.481 | 1.518 | 0.020 | 1.326 | 1.312 | 0.306 |
| BUSRISK | 0.008 | 0.011 | 0.000 | 0.011 | 0.009 | 0.523 |
| CORP | 0.451 | 0.452 | 0.828 | 0.412 | 0.410 | 0.609 |
| EXTDEP | 0.334 | 0.338 | 0.360 | 0.300 | 0.300 | 0.965 |
| INNOV | 1.565 | 1.546 | 0.193 | 1.688 | 1.704 | 0.224 |
| Panel C: second-stage regression results using propensity score matched samples | |||||||
|---|---|---|---|---|---|---|---|
| Predicted sign | Dependent variable = Firm performance (PERF1) | ||||||
| Caliper matching | Nearest neighbour matching | ||||||
| Model (1) | Model (2) | Model (3) | Model (4) | Model (5) | Model (6) | ||
| INVOP_DUM | + | 0.025*** | 0.021*** | 0.035*** | 0.027*** | 0.022*** | 0.045*** |
| (4.575) | (4.199) | (4.153) | (4.622) | (4.081) | (4.166) | ||
| INVOP_DUM × FEMOWN | + | – | 0.012** | – | – | 0.018*** | – |
| (2.199) | (2.956) | ||||||
| INVOP_DUM × CONTROL | – | – | – | −0.014* | – | – | −0.024** |
| (−1.821) | (−2.484) | ||||||
| FEMOWN | ? | −0.001 | −0.007 | −0.001 | 0.005 | −0.007 | 0.005 |
| (−0.188) | (−1.407) | (−0.184) | (1.036) | (−1.071) | (1.058) | ||
| CONTROL | – | −0.007 | −0.007 | 0.000 | −0.003 | −0.003 | 0.013* |
| (−1.618) | (−1.612) | (0.037) | (−0.839) | (−0.845) | (1.836) | ||
| SIZE | + | 0.010*** | 0.010*** | 0.010*** | 0.010*** | 0.010*** | 0.010*** |
| (3.516) | (3.514) | (3.502) | (3.587) | (3.584) | (3.542) | ||
| FAGE | ? | −0.037*** | −0.037*** | −0.037*** | −0.035*** | −0.035*** | −0.035*** |
| (−8.585) | (−8.585) | (−8.586) | (−9.105) | (−9.121) | (−9.099) | ||
| FOROWN | + | −0.001 | −0.001 | −0.001 | 0.002 | 0.002 | 0.002 |
| (−0.129) | (−0.130) | (−0.102) | (0.287) | (0.282) | (0.337) | ||
| FINCRED | + | 0.003 | 0.003 | 0.003 | 0.002 | 0.001 | 0.002 |
| (0.735) | (0.708) | (0.733) | (0.425) | (0.372) | (0.432) | ||
| EXPORT | + | −0.009 | −0.009 | −0.009 | −0.008 | −0.008 | −0.008 |
| (−0.996) | (−0.978) | (−1.023) | (−1.096) | (−1.071) | (−1.150) | ||
| FINCONS | – | −0.003** | −0.003** | −0.003** | −0.002 | −0.002 | −0.002 |
| (−2.074) | (−2.076) | (−2.075) | (−0.974) | (−0.972) | (−0.966) | ||
| BUSRISK | – | 0.013 | 0.013 | 0.014 | −0.016*** | −0.016*** | −0.016*** |
| (0.146) | (0.145) | (0.155) | (−12.683) | (−12.698) | (−12.692) | ||
| CORP | + | −0.010* | −0.010* | −0.010* | −0.008 | −0.008 | −0.008 |
| (−1.786) | (−1.774) | (−1.789) | (−1.445) | (−1.420) | (−1.443) | ||
| EXTDEP | + | 0.010 | 0.010 | 0.010 | 0.009 | 0.010 | 0.009 |
| (1.345) | (1.338) | (1.330) | (1.433) | (1.444) | (1.395) | ||
| INNOV | + | 0.006*** | 0.006*** | 0.006*** | 0.005** | 0.005** | 0.005** |
| (3.068) | (3.076) | (3.095) | (2.462) | (2.487) | (2.476) | ||
| Intercept | ? | 0.246*** | 0.248*** | 0.242*** | 0.313*** | 0.317*** | 0.302*** |
| (4.723) | (4.750) | (4.645) | (5.923) | (5.974) | (5.728) | ||
| Year fixed effects | Yes | Yes | Yes | Yes | Yes | Yes | |
| Industry fixed effects | Yes | Yes | Yes | Yes | Yes | Yes | |
| Country fixed effects | Yes | Yes | Yes | Yes | Yes | Yes | |
| Observations | 27,642 | 27,642 | 27,642 | 28,598 | 28,598 | 28,598 | |
| R-squared | 0.089 | 0.089 | 0.089 | 0.088 | 0.088 | 0.088 | |
| Test: INVOP + INVOP × FEMOWN = 0 | 17.63*** | 16.65*** | |||||
| Test: INVOP + INVOP × CONTROL = 0 | 17.25*** | 17.36*** | |||||
Note(s): Superscript ***, **, and * represent statistical significance at the 1, 5, and 10% levels, respectively, two-tailed. Coefficient values (robust t-statistics) are shown with standard errors clustered at the country level. Descriptions of variables are provided in Appendix
Source(s): Authors’ own work
Table 7, Panel C reports the second-stage regression results. The coefficients of INVOP_DUM are positive and statistically significant (β = 0.025, p < 0.01 in Model [1]; β = 0.027, p < 0.01 in Model [4]) using both methods of matching. Furthermore, the coefficients of INVOP_DUM × FEMOWN are positive and statistically significant in Models (2) and (5), while the coefficients of INVOP_DUM × CONTROL are negative and statistically significant in Models (3) and (6), respectively. These results confirm the robustness of our findings and suggest that they are not affected by self-selection bias based on observable firm characteristics.
4.4.3 Evidence from the machine learning approach
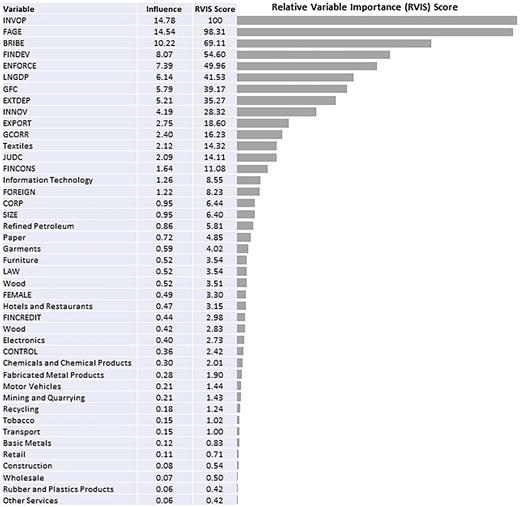
We employ an advanced supervised machine learning approach to provide additional insights into the role of investment opportunities in predicting private firms’ performance. Machine learning algorithms can serve as a complement to causal inferences (Mullainathan and Spiess, 2017). Machine learning algorithms identify complex patterns in data, select the best variables to explain an outcome variable, and identify optimal combinations of variables to produce accurate out-of-sample predictions (Bose et al., 2024; Bertomeu et al., 2019). Recent studies show that predictive modelling based on machine learning which integrates a large number of explanatory variables not only helps to reduce out-of-sample prediction error, but also provides relevant information based on superior prediction outcomes (Bose et al., 2024; Jones, 2017; Bertomeu et al., 2019). Therefore, we employ the tree-based advanced machine learning model known as extreme gradient boosting. In recent years, boosting-based machine learning models have grown in popularity owing to their high level of accuracy in making predictions and their ability to overcome the shortcomings of conventional OLS and logit regression (Jones, 2017). The important feature of extreme gradient boosting is that it converts weak learners into strong learners.
For machine learning analysis, we employ 49 predictors in the extreme gradient boosting model (13 firm-level variables, seven country-level variables and 29 industries). After running the machine learning algorithm, 43 predictors survive, and six variables show zero (0) influence. Boosting-based machine learning models produce the percentages of variance explained by the parameters rather than any sign or coefficient of those parameters. For the remaining variables to be ranked in relation to the strongest predictor, the percentage of variation explained by the machine learning model is converted into relative variable importance (RVI) score, which is then converted on a scale from 0–100. The RVI ratings, as shown in Table 8, illustrate the overall predictive influence of individual predictors on firm performance. The ratings show that, of the 43 variables used in the model, INVOP is the strongest indicator (Influence = 14.78; RVI = 100) of firm performance. Overall, the findings of the machine learning approach show that investment opportunities (INVOP) are a strong predictor of future stock price crash risk.
5. Additional analyses and robustness checks
5.1 Role of country-level institutional factors
Prior research emphasizes the importance of country-specific factors in understanding the results of cross-country studies (Gordon et al., 2013; Bose et al., 2021, 2025; Saha, 2022; Ali et al., 2023). Therefore, we examine the moderating roles of four country-level institutional variables: financial development, country’s legal system, country-level financial constraints, and corruption.
Well-developed financial markets and institutions mitigate moral hazard and adverse selection issues, reducing the cost of capital from external sources (Rajan and Zingales, 1998). To explore this further, we conduct subsample analyses to examine how country-level financial development influences the relationship between investment opportunities and firm performance. More specifically, we divide the full sample into subsamples based on country-level gross domestic product (GDP). Specifically, we create an indicator variable, HIGH_FDEV, that takes a value of 1 if the country-level GDP is higher than the sample’s yearly median GDP, and 0 otherwise, re-estimating Equation (1). Table 9, Panel A shows the regression results. The coefficient of INVOP is positive and statistically significant in Model (1), suggesting that the positive impact of investment opportunities on firm performance is more pronounced in countries with a higher level of financial development. Furthermore, the coefficient of INVOP × FEMOWN is positive and statistically significant in Model (3), suggesting that the positive role of female ownership in the association between investment opportunities and firm performance is more pronounced in countries with a higher level of financial development. However, the coefficient of INVOP × CONTROL is negative and statistically significant in Model (6), suggesting that the negative role of concentrated ownership in the association between investment opportunities and firm performance is more pronounced in countries with a lower level of financial development.
Regression results between private firms’ investment opportunities and firm performance: role of country-level institutional factors
| Panel A: role of country-level financial development | ||||||
|---|---|---|---|---|---|---|
| Dependent variable = Firm performance (PERF1) | ||||||
| HIGH_FDEV | LOW_FDEV | HIGH_FDEV | LOW_FDEV | HIGH_FDEV | LOW_FDEV | |
| Model (1) | Model (2) | Model (3) | Model (4) | Model (5) | Model (6) | |
| INVOP | 0.120*** | 0.049 | 0.098** | 0.046* | 0.151*** | 0.096*** |
| (3.304) | (1.704) | (2.626) | (1.733) | (2.839) | (3.702) | |
| INVOP × FEMOWN | – | – | 0.066** | 0.009 | – | – |
| (2.359) | (0.422) | |||||
| INVOP × CONTROL | – | – | – | – | −0.047 | −0.064** |
| (−1.280) | (−2.256) | |||||
| FEMOWN | 0.006 | 0.002 | −0.045* | −0.004 | 0.006 | 0.002 |
| (0.963) | (0.247) | (−1.869) | (−0.193) | (0.977) | (0.239) | |
| CONTROL | −0.003 | −0.003 | −0.003 | −0.003 | 0.033 | 0.045** |
| (−0.927) | (−0.336) | (−0.881) | (−0.335) | (1.126) | (2.206) | |
| Intercept | 0.015 | 0.125** | 0.033** | 0.127** | −0.008 | 0.091* |
| (1.041) | (2.435) | (2.369) | (2.543) | (−0.268) | (1.857) | |
| Control variables | Yes | Yes | Yes | Yes | Yes | Yes |
| Year fixed effects | Yes | Yes | Yes | Yes | Yes | Yes |
| Industry fixed effects | Yes | Yes | Yes | Yes | Yes | Yes |
| Country fixed effects | Yes | Yes | Yes | Yes | Yes | Yes |
| Observations | 13,913 | 9,929 | 13,913 | 9,929 | 13,913 | 9,929 |
| R-squared | 0.051 | 0.076 | 0.052 | 0.076 | 0.051 | 0.077 |
| Panel B: role of country-level governance | ||||||
|---|---|---|---|---|---|---|
| Dependent variable = Firm performance (PERF1) | ||||||
| CLAW = 1 | CLAW = 0 | CLAW = 1 | CLAW = 0 | CLAW = 1 | CLAW = 0 | |
| Model (1) | Model (2) | Model (3) | Model (4) | Model (5) | Model (6) | |
| INVOP | 0.181* | 0.076*** | 0.203** | 0.061** | 0.279* | 0.102*** |
| (2.405) | (3.305) | (3.284) | (2.748) | (2.112) | (4.029) | |
| INVOP × FEMOWN | – | – | −0.054 | 0.046*** | – | – |
| (−0.658) | (2.876) | |||||
| INVOP × CONTROL | – | – | – | – | −0.163 | −0.038* |
| (−1.217) | (−1.773) | |||||
| FEMOWN | −0.023 | 0.006 | 0.017 | −0.029* | −0.022 | 0.006 |
| (−1.653) | (1.021) | (0.290) | (−1.840) | (−1.573) | (1.013) | |
| CONTROL | 0.010 | −0.006 | 0.010 | −0.006 | 0.132 | 0.023 |
| (0.605) | (−1.390) | (0.627) | (−1.338) | (1.151) | (1.497) | |
| Intercept | 0.195 | 0.069*** | 0.180 | 0.080*** | 0.120 | 0.049** |
| (1.685) | (3.133) | (1.545) | (3.683) | (0.925) | (2.474) | |
| Control variables | Yes | Yes | Yes | Yes | Yes | Yes |
| Year fixed effects | Yes | Yes | Yes | Yes | Yes | Yes |
| Industry fixed effects | Yes | Yes | Yes | Yes | Yes | Yes |
| Country fixed effects | Yes | Yes | Yes | Yes | Yes | Yes |
| Observations | 2,529 | 20,427 | 2,529 | 20,427 | 2,529 | 20,427 |
| R-squared | 0.1590 | 0.0576 | 0.1594 | 0.0579 | 0.1633 | 0.0578 |
| Panel C: role of country-level financial constraints | ||||||
|---|---|---|---|---|---|---|
| Dependent variable = Firm performance (PERF1) | ||||||
| HIGH_GFC | LOW_GFC | HIGH_GFC | LOW_GFC | HIGH_GFC | LOW_GFC | |
| Model (1) | Model (2) | Model (3) | Model (4) | Model (5) | Model (6) | |
| INVOP | 0.075*** | 0.097*** | 0.071*** | 0.083*** | 0.111*** | 0.132*** |
| (3.679) | (4.026) | (3.452) | (3.677) | (4.671) | (3.286) | |
| INVOP × FEMOWN | – | – | 0.012 | 0.041** | – | – |
| (0.661) | (2.099) | |||||
| INVOP × CONTROL | – | – | – | – | −0.050** | −0.048 |
| (−2.137) | (−1.388) | |||||
| FEMOWN | −0.003 | 0.004 | −0.011 | −0.027 | −0.003 | 0.004 |
| (−0.440) | (0.643) | (−0.753) | (−1.521) | (−0.438) | (0.652) | |
| CONTROL | −0.006 | −0.004 | −0.006 | −0.004 | 0.030 | 0.032 |
| (−1.169) | (−1.056) | (−1.166) | (−1.027) | (1.614) | (1.244) | |
| Intercept | 0.325*** | 0.071 | 0.329*** | 0.079 | 0.301*** | 0.045 |
| (5.642) | (1.184) | (5.652) | (1.333) | (5.159) | (0.714) | |
| Control variables | Yes | Yes | Yes | Yes | Yes | Yes |
| Year fixed effects | Yes | Yes | Yes | Yes | Yes | Yes |
| Industry fixed effects | Yes | Yes | Yes | Yes | Yes | Yes |
| Country fixed effects | Yes | Yes | Yes | Yes | Yes | Yes |
| Observations | 16,103 | 20,082 | 16,103 | 20,082 | 16,103 | 20,082 |
| R-squared | 0.1272 | 0.0549 | 0.1273 | 0.0552 | 0.1276 | 0.0552 |
| Panel D: role of country-level corruption | ||||||
|---|---|---|---|---|---|---|
| Dependent variable = Firm performance (PERF1) | ||||||
| HIGH_GCORR | LOW_GCORR | HIGH_GCORR | LOW_GCORR | HIGH_GCORR | LOW_GCORR | |
| Model (1) | Model (2) | Model (3) | Model (4) | Model (5) | Model (6) | |
| INVOP | 0.056 | 0.076*** | 0.085*** | 0.064** | 0.111*** | 0.140*** |
| (0.800) | (2.904) | (4.098) | (2.522) | (4.540) | (3.290) | |
| INVOP × FEMOWN | – | – | 0.028 | 0.034* | – | – |
| (1.310) | (1.999) | |||||
| INVOP × CONTROL | – | – | – | – | −0.026 | −0.084** |
| (−1.336) | (−2.089) | |||||
| FEMOWN | −0.004 | 0.009 | −0.025 | −0.016 | −0.005 | 0.010 |
| (−0.916) | (1.355) | (−1.500) | (−1.042) | (−0.924) | (1.399) | |
| CONTROL | −0.003 | −0.009 | −0.003 | −0.009 | 0.016 | 0.053* |
| (−0.786) | (−1.514) | (−0.750) | (−1.545) | (1.074) | (1.680) | |
| Intercept | 0.235*** | 0.248*** | 0.242*** | 0.256*** | 0.222*** | 0.200** |
| (3.344) | (2.957) | (3.450) | (3.045) | (3.144) | (2.267) | |
| Control variables | Yes | Yes | Yes | Yes | Yes | Yes |
| Year fixed effects | Yes | Yes | Yes | Yes | Yes | Yes |
| Industry fixed effects | Yes | Yes | Yes | Yes | Yes | Yes |
| Country fixed effects | Yes | Yes | Yes | Yes | Yes | Yes |
| Observations | 21,617 | 14,568 | 21,617 | 14,568 | 21,617 | 14,568 |
| R-squared | 0.1226 | 0.0654 | 0.1227 | 0.0656 | 0.1227 | 0.0662 |
Note(s): Superscript ***, **, and * represent statistical significance at the 1, 5, and 10% levels, respectively, two-tailed. Coefficient values (robust t-statistics) are shown with standard errors clustered at the country level. Descriptions of variables are provided in Appendix
Source(s): Authors’ own work
Wealthier countries have more resources to build their legal systems and enforcement practices, while these more economically advanced countries also have other institutional developments that protect property rights and facilitate private contracting (Claessens and Laeven, 2003). Therefore, by conducting subsample analyses, we examine the effect of country-level legal systems on the association between investment opportunities and firm performance. We divide the full sample into subsamples based on country-level legal systems. Specifically, we create an indicator variable that takes a value of 1 if the firm is domiciled in a common law country (CLAW = 1) and 0 if it is domiciled in a code law country (CLAW = 0). Table 9, Panel B shows the regression results, which suggest that our findings hold for only code law countries.
Prior studies argue that financial development promotes economic growth (King and Levine, 1993; Levine et al., 2000), alleviates financial constraints, and fosters business investment (O’Toole and Newman, 2016). Building on this, we conduct subsample analyses to examine how country-level financial constraints influence the relationship between investment opportunities and firm performance. We divide the sample based on country-level financial constraints by creating an indicator variable, HIGH_GFC, which equals 1 if a country’s financial constraints are above the sample’s median and 0 otherwise. We then re-estimate Equation (1), with the results presented in Table 9, Panel C. The findings indicate that the coefficients of INVOP are positive and statistically significant in both Models (1) and (2), but the magnitude is higher for firms in countries with lower financial constraints. This suggests that the positive impact of investment opportunities on firm performance is stronger in less financially constrained environments. Similarly, the coefficient of INVOP × FEMOWN indicates that the positive moderating role of female ownership in the investment opportunities–performance relationship is more pronounced for firms in countries with lower financial constraints. Conversely, the coefficient of INVOP × CONTROL in Model (5) shows that the negative impact of concentrated ownership on this relationship is more pronounced in countries with higher financial constraints. These results underscore the critical role of financial constraints in shaping the effectiveness of ownership structures and investment opportunities in driving firm performance.
Corruption is a major concern in emerging and developing economies due to its negative impact on economic growth and productivity (Méon and Weill, 2010; Wellalage et al., 2019). Prior studies argue that country-level corruption reduces a country’s business activities, leading to inefficient outcomes (Shleifer and Vishny, 1994; Svensson, 2005). As our study examines firms in a cross-country sample, our findings may be affected by country-level corruption. Therefore, we examine the effect of country-level corruption on the association between investment opportunities and firm performance by conducting subsample analyses. More specifically, we divide the full sample into subsamples based on country-level corruption scores. Specifically, we create an indicator variable, HIGH_GCORR, that takes a value of 1 if the country-level corruption score is higher than the sample’s yearly median of corruption scores, and 0 otherwise, and re-estimate Equation (1). Table 9, Panel D shows the regression results. The coefficient of INVOP is positive and statistically significant in Model (2), suggesting that the positive effect of investment opportunities on firm performance is more pronounced for firms in countries with a lower level of corruption. Furthermore, the role of female ownership (concentrated ownership) in the positive (negative) association between investment opportunities and firm performance also holds for countries with a lower (higher) level of corruption.
5.2 Alternative proxies for firm performance
Our main analysis uses sales growth as a proxy for firm performance. We use two alternative proxies for measuring firm performance: annual employment growth (PERF2) and labour productivity (PERF3). Table 10, Panel A reports the regression results. Overall, our findings are supported by the alternative proxies for firm performance. For reasons of brevity in this paper, we do not report the regression results for labour productivity (PERF3). However, the unreported results show that our findings remain qualitatively similar.
Regression results between private firms’ investment opportunities and firm performance: alternative proxies for firm performance and investment opportunities
| Panel A: alternative proxies for firm performance | |||||||
|---|---|---|---|---|---|---|---|
| Predicted sign | Dependent variable = Firm performance (PERF2) | Dependent variable = Firm performance (PERF3) | |||||
| Model (1) | Model (2) | Model (3) | Model (4) | Model (5) | Model (6) | ||
| INVOP | + | 0.062*** | 0.054*** | 0.071*** | 0.022** | 0.019* | 0.052*** |
| (4.188) | (3.376) | (3.293) | (2.346) | (1.797) | (4.023) | ||
| INVOP × FEMOWN | + | – | 0.024** | – | – | 0.010 | – |
| (2.228) | (0.701) | ||||||
| INVOP × CONTROL | – | – | – | −0.012 | – | – | −0.042*** |
| (−0.607) | (−2.625) | ||||||
| FEMOWN | ? | 0.002 | −0.017* | 0.002 | 0.000 | −0.007 | 0.000 |
| (0.743) | (−1.883) | (0.746) | (0.023) | (−0.612) | (0.033) | ||
| CONTROL | – | 0.004 | 0.004 | 0.013 | −0.010*** | −0.010*** | 0.021* |
| (1.172) | (1.159) | (0.875) | (−3.468) | (−3.473) | (1.699) | ||
| Intercept | ? | 0.260*** | 0.266*** | 0.254*** | 0.042 | 0.045 | 0.021 |
| (15.697) | (15.607) | (12.516) | (0.901) | (0.949) | (0.440) | ||
| Control variables | Yes | Yes | Yes | Yes | Yes | Yes | |
| Year fixed effects | Yes | Yes | Yes | Yes | Yes | Yes | |
| Industry fixed effects | Yes | Yes | Yes | Yes | Yes | Yes | |
| Country fixed effects | Yes | Yes | Yes | Yes | Yes | Yes | |
| Observations | 35,155 | 35,155 | 35,155 | 35,136 | 35,136 | 35,136 | |
| R-squared | 0.084 | 0.084 | 0.084 | 0.071 | 0.071 | 0.072 | |
| Panel B: alternative proxies for investment opportunities | |||||||
|---|---|---|---|---|---|---|---|
| Predicted sign | Dependent variable = Firm performance (PERF1) | ||||||
| Model (1) | Model (2) | Model (3) | Model (4) | Model (5) | Model (6) | ||
| INVOP | + | 0.026*** | 0.019*** | 0.038*** | 0.025*** | 0.022*** | 0.036*** |
| (4.607) | (3.769) | (4.173) | (4.522) | (4.071) | (4.109) | ||
| INVOP × FEMOWN | + | – | 0.022*** | – | – | 0.009 | – |
| (4.936) | (1.565) | ||||||
| INVOP × CONTROL | – | – | – | −0.016* | – | – | −0.016** |
| (−1.981) | (−2.004) | ||||||
| FEMOWN | ? | 0.001 | −0.011** | 0.001 | 0.001 | −0.004 | 0.001 |
| (0.237) | (−2.307) | (0.255) | (0.238) | (−0.772) | (0.244) | ||
| CONTROL | – | −0.005 | −0.005 | 0.003 | −0.005 | −0.005 | 0.004 |
| (−1.466) | (−1.470) | (0.618) | (−1.452) | (−1.447) | (0.753) | ||
| Intercept | ? | 0.314*** | 0.318*** | 0.309*** | 0.311*** | 0.312*** | 0.304*** |
| (6.079) | (6.136) | (5.994) | (5.998) | (6.016) | (5.860) | ||
| Control variables | Yes | Yes | Yes | Yes | Yes | Yes | |
| Year fixed effects | Yes | Yes | Yes | Yes | Yes | Yes | |
| Industry fixed effects | Yes | Yes | Yes | Yes | Yes | Yes | |
| Country fixed effects | Yes | Yes | Yes | Yes | Yes | Yes | |
| Observations | 36,185 | 36,185 | 36,185 | 36,185 | 36,185 | 36,185 | |
| R-squared | 0.090 | 0.090 | 0.090 | 0.090 | 0.090 | 0.090 | |
Note(s): Superscript ***, **, and * represent statistical significance at the 1, 5 and 10% levels, respectively, two-tailed. Coefficient values (robust t-statistics) are shown with standard errors clustered at the country level. Descriptions of variables are provided in Appendix
Source(s): Authors’ own work
5.3 Alternative proxies for investment opportunities
We use capacity utilization rate as a proxy for investment opportunities, with this being a continuous variable. We code investment opportunities as a dummy variable. The first classification is that if a firm’s INVOP value is more than 80%, this is considered to mean higher investment opportunities, following Ayyagari et al. (2011). Table 10, Panel B, Models (1)–(3) report the regression results. Another proxy is computed based on the median level of investment opportunities. Table 10, Panel B, Models (4)–(6) report the regression results. Both results show that our findings remain qualitatively similar. Finally, we employ an alternative proxy for investment opportunities based on firms’ decisions to invest in new or fixed assets, such as machinery, vehicles, equipment, land, or buildings. We argue that firms with higher capacity utilization rates are more likely to allocate additional capital toward such investments. This, in turn, enables firms to hire more employees and expand their fixed asset base to maximize production levels. For the sake of brevity, we do not report the regression results here. However, the unreported results indicate that our findings remain qualitatively similar.
5.4 Other tests
Our study exhibits a significant variation in country-level sample sizes, ranging from 6 to 5,241 observations, which could potentially bias our results towards countries that are either overrepresented or underrepresented. To mitigate this issue, we re-estimate our main regression, excluding firms from the India, Egypt, Mexico, and Peru—countries with the largest number of observations. We also exclude countries with less than 20, 50, and 100 observations. Although we do not show the regression results for brevity, the unreported results suggest that our findings remain same. Finally, we apply weighted least squares technique to estimate our baseline regression models, with weights inversely proportional to the number of observations per country. Although the regression results are not shown for brevity, they indicate that our findings remain consistent with those presented in Table 4. This confirms that our results are robust, even after accounting for the issue of uneven sample distribution.
6. Conclusions
This study aims to examine the association between firm performance and investment opportunities in private firms. We also investigate whether female ownership and concentrated ownership moderate the association between investment opportunities and firm performance. We use 36,185 firm observations from 2006–2018 across 114 countries and employ multiple regression analyses. We document that investment opportunities are positively associated with firm performance. Furthermore, we show that female ownership positively moderates the link between firm performance and investment opportunities. As predicted, we also find that concentrated ownership negatively moderates the association between firm performance and investment opportunities.
Our findings have significant policy implications for firm management, regulators, and policymakers, particularly in developing economies. First, the documented positive association between investment opportunities and firm performance suggests that policymakers should prioritize creating a supportive environment for private firms to effectively utilize their productive capacities. This could involve implementing targeted financial incentives, improving access to credit, and enhancing infrastructure support to stimulate private sector growth and job creation. Second, the positive moderating effect of female ownership highlights the importance of gender-inclusive policies. Policymakers and regulators should consider initiatives that promote female participation in firm ownership and leadership, such as facilitating access to capital for women entrepreneurs, offering tailored training programs, and providing incentives for firms with diverse ownership structures. Finally, the finding that concentrated ownership weakens the positive link between investment opportunities and performance underscores the need for governance reforms. Policymakers can strengthen corporate governance frameworks by encouraging transparency, safeguarding minority shareholder rights, and implementing oversight mechanisms to mitigate potential agency conflicts in privately held firms. By addressing these areas, our study provides actionable insights to foster sustainable growth and improved performance in private firms across developing countries.
While this study offers valuable insights, it has its limitations. We focus specifically on private firms, and future research could broaden the scope by comparing both public and private firms. Additionally, while we examine two key ownership characteristics, there is scope to explore other governance mechanisms—such as board diversity, external monitoring, or managerial ownership—that may influence the investment-performance relationship. Nevertheless, our findings contribute meaningfully to the literature by highlighting the significant roles that investment opportunities, female ownership, and concentrated ownership play in shaping the performance of private firms in developing economies.
Notes
In this study, we consider investment opportunities as a firm’s capacity utilization rate, following Ayyagari et al. (2011), with this rate suggesting the level of a firm’s ability to utilize its scarce resources for productive purposes. In addition, Baumohl (2012) argues that capacity utilization rates measure the amount of slack in an economy and are used as leading indicators of business investment expenditure.
The 2006–2018 sample period captures critical global events, including the 2008 financial crisis, offering insights into private firms’ responses to economic shifts. WBES data from this period are widely used in prior research, ensuring relevance and comparability, with consistent methodology providing reliable, unique firm-level observations across 114 countries. This period also reflects a transformative era for private firms, making it ideal for examining their performance and investment behaviour.
The World Bank has conducted an enterprise survey using a stratified random sampling methodology since 2006 (World Bank, 2017). The survey employs a standardized questionnaire, methodology, and global scope, ensuring consistency and comparability across different economies (World Bank, 2017). The survey’s instruments and sampling techniques are designed to minimize measurement error and maintain cross-country and longitudinal comparability. Due to confidentiality agreements, the World Bank does not disclose the names or specific identifiers of surveyed firms, making it impossible to link the data to other firm-level databases (Ayyagari et al., 2006; Francis et al., 2011; Hope et al., 2011). However, the WBES data are free from response bias, which is often associated with mail or web-based surveys (Chen et al., 2011). Validity tests conducted by several researchers have confirmed the absence of bias in the WBES data (Carlin et al., 2007; Beck et al., 2008; Hope et al., 2011).
Alternative proxies for investment opportunities, such as the market-to-book assets (MBA) ratio, market-to-book (MB) ratio, Tobin’s Q, the earnings-price (EP) ratio, and the ratio of capital expenditures to the net book value of plant, property, and equipment, are commonly employed in studies of public firms (Adam and Goyal, 2008). However, these measures are unsuitable for private firms, as they depend on market-based data that private firms typically lack. To address this challenge, this study leverages firm-level variables from the World Bank Enterprise Surveys (WBES), which provide consistent and robust indicators specifically designed for private firms globally, ensuring the methodological rigour and applicability of our analysis.
We define high levels of investment opportunities (HIGH_INVOP) as an indicator variable that equals 1 if the firm-level investment opportunities are greater than the country-industry median of investment opportunities, and 0 otherwise.
The objective of this test is to determine whether the effect of INVOP is contingent on FEMOWN and to ensure that the observed influence is statistically significant and not attributable to random variation.
References
Appendix
Descriptions of variables
| Variable notation | Variable name | Description |
|---|---|---|
| Panel A: dependent variables | ||
| PERF1 | Firm performance | Actual annual sales growth, measured as a percentage change in sales between the last completed fiscal year and a previous period |
| PERF2 | Firm performance | Annual employment growth, measured as the change in full-time employment reported in the current fiscal year from a previous period |
| PERF3 | Firm performance | Annual labour productivity growth, measured by a percentage change in labour productivity between the last completed fiscal year and a previous period, where labour productivity is sales divided by the number of full-time permanent workers |
| Panel B: variables of interest | ||
| INVOP | Investment opportunities | Investment opportunities are measured using the firm’s capacity utilization rate, following Ayyagari et al. (2011) |
| FEMOWN | Female ownership | An indicator variable that takes a value of 1 if the firm is owned by a female owner, and 0 otherwise |
| CONTROL | Concentrated ownership | An indicator variable that takes the value of 1 if the largest shareholder owns more than 50% of the firm, and 0 otherwise |
| Panel C: firm-level control variables | ||
| SIZE | Firm size | Firm size is measured using three dummy variables corresponding to small, medium-sized, and large firms. A firm takes the value of 1 if it is small with less than 20 employees, the value of 2 if it is medium-sized with 20–99 employees, and the value of 3 if it is large with 100 or more employees |
| FAGE | Firm age | The natural logarithm of the age of the firm since it was incorporated |
| FOROWN | Foreign ownership | The percentage of foreign ownership |
| FINCRED | Financial credibility | An indicator variable that takes a value of 1 if the firm obtains a voluntary assurance service on its financial statements, and 0 otherwise |
| EXPORT | Foreign market interaction | An indicator variable that takes the value of 1 if a firm has foreign sales, and 0 otherwise |
| FINCONS | Financing constraints | Financing constraints are defined based on the response to the question: “To what degree is access to finance an obstacle to the current operations of this establishment?” The responses take values between 0 and 4, where 0 indicates no obstacle; 1 is a minor obstacle; 2 is a moderate obstacle; 3 is a major obstacle; and 4 is a very severe obstacle |
| BUSRISK | Business risk | The ratio of informal payments paid to government officers to total sales |
| CORP | Limited liability corporation | An indicator variable that takes the value of 1 if a firm is incorporated as a limited liability corporation, and 0 if it is incorporated as a proprietorship, partnership, or cooperative |
| EXTDEP | External finance | The proportion of a firm’s financing from external sources |
| INNOV | Innovation | The sum of quality certification, licensed technology, website, and email. Quality certificate is measured as an indicator variable coded 1 if the firm obtains an internationally recognized quality certificate, and 0 otherwise. Licensed technology is measured as an indicator variable coded 1 if the firm obtains technology licensed from a foreign-owned firm, and 0 otherwise. Website is measured as an indicator variable coded 1 if the firm has a website for its business, and 0 otherwise. Email is an indicator variable coded as 1 if the firm has an email address, and 0 otherwise |
| Panel D: country-level control variables | ||
| LNGDP | Gross domestic product | The natural logarithm of a country’s gross domestic product (GDP) per capita averaged over the sample period (source: World Bank) |
| FINDEV | Financial development | The sum of the stock market development index score (STKMKT) and the financial intermediary development index score (FININT). The stock market development index score (STKMKT) is computed based on the sum of market capitalization over GDP, total value traded over GDP, and total value traded over market capitalization. The financial intermediary development index score (FININT) is computed based on the sum of the ratio of liquid liabilities to GDP and the credit going to the private sector over GDP. It is computed based on time series data over the sample period (source: World Bank) |
| LAW | Country-level legal tradition | An indicator variable that takes the value of 1 if a country has a common law legal tradition, and 0 otherwise (source: La Porta et al., 1998; Ayyagari et al., 2013) |
| GFC | General financing constraints | General financing constraints are computed based on averaged overall firms in a country by using responses to the question: “Using the response options on the card, to what degree is access to finance an obstacle to the current operations of this establishment?” The responses take values between 0 and 4, where 0 indicates no obstacle; 1 is a minor obstacle; 2 is a moderate obstacle; 3 is a major obstacle; and 4 is a very severe obstacle |
| GCORR | General corruption constraints | General corruption constraints are computed based on averaged overall firms in a country by using responses to the question: “As I list some factors that can affect the current operations of a business, please look at this card and tell me the degree to which you think each factor (corruption) is an obstacle to the current operations of this establishment”. The responses take values between 0 and 4, where 0 indicates no obstacle; 1 is a minor obstacle; 2 is a moderate obstacle; 3 is a major obstacle; and 4 is a very severe obstacle |
| JUDC | Judicial constraints | Judicial constraints are computed based on averaged overall firms in a country by using responses to the question: “As I list some factors that can affect the current operations of a business, please look at this card and tell me the degree to which you think each factor (courts) is an obstacle to the current operations of this establishment”. The responses take values between 0 and 4, where 0 indicates no obstacle; 1 is a minor obstacle; 2 is a moderate obstacle; 3 is a major obstacle; and 4 is a very severe obstacle |
| ENFORCE | Legal enforcement | Legal enforcement is computed based on averaged overall firms in a country by using responses to the statement: “The court system is fair, impartial, and uncorrupted”. The responses take values between 1 and 4, where 1 indicates strongly disagree; 2 tends to disagree; 3 tends to agree; and 4 is strongly agree |
Source(s): Authors’ own work

