Character education programs address moral and ethical values such as respect, responsibility, and trustworthiness (Character Education Partnership, 2010). Programs may be targeted to impact individuals, small groups, whole classrooms, or whole schools (What Works Clearinghouse, 2007) and may be implemented as a practice, supplement or curriculum. Depending on the nature of the program, school administrators tasked with reporting outcomes must assess the effectiveness of a character education program for reducing negative behaviors, enhancing social-emotional skills, and/or improving academic achievement. The magnitude of the behavioral or academic outcome is typically reported in terms of “effect size” in the literature (Schochet, 2005) so that results between studies of various programs can be compared.
Effect size values (magnitude of the out- comes/variability within the system) in the social sciences typically range between Cohen’s (1988) designation of 0.2 and 0.8 for small and large effects, respectively. These values can provide a way to compare the effectiveness of character education programs when 20+ individuals, small groups, classrooms, or schools are involved in each study. However, studies that analyze classroom- or school-level outcomes can be very costly when using 20+ classrooms or schools, so school districts may not have the resources to engage in rigorous research studies. How can districts develop effective studies when funding is limited? One way to overcome financial barriers to research is to reduce the number of classrooms or schools required in a study. How can this be done? Districts can limit the required number of classrooms or schools by controlling for the amount of variability that is allowed into the research study such that adequate statistical power is maintained.
Statistical power in educational research is a measure of researchers’ ability to have confidence in the outcomes and is related to the effect size value as well as to the number of individuals or groups that participate in the study. The Optimal Design software (Spybrook, Raudenbush, Liu, & Congdo, 2009) that is available on the W.T. Grant Foundation website (2011) was developed to help researchers understand the relationship between the effect size, statistical power, and the number of classrooms or schools used in the study. The software is capable of assisting with study designs typical of the social sciences (i.e., high number of participants, high variability, and low effect size values) as well as those that are more common in the physical sciences (low number of participants, low variability, and high effect size values). Either design is valid, but the study design that is more common in the physical sciences offers districts the ability to limit costs by reducing the number of participants that are required to measure meaningful behavioral and academic changes.
The following discussion demonstrates that administrators and researchers can know in advance whether or not a study designed to evaluate a character education program will likely allow statistically meaningful outcomes to be measured if they occur. Meaningful outcomes can be obtained if the effect of the program is sufficiently large given the number of schools and the variability in the data used in the study. The information provided below can help school researchers answer the following questions: What is a general (and quick) method to approximate the expected effect size using easily accessible school data? How many schools do researchers need to use in a research study so that they can have confidence in the results? If a district has a limited budget, how does it determine which schools are the best candidates for an effective study?
Approximating Effect Size
The effect size provides important information about two distinct sets of information: the magnitude of the effectiveness of a program and the variability present in the system. In equation form, effect size can be represented for a given outcome as:
If we assume that there will be no change in the mean outcome of the comparison group, then the equation becomes:
Using discipline referrals as a measurable outcome, the following example demonstrates the impact of the percent variability on the effect size.
Example: If there are 1,000 students in each of two schools, A and B, and if the reported 3-year mean for discipline referrals for School A is 500 ± 100 and the corresponding mean for School B is 500 ± 400, then we can determine the percent variability in discipline referrals for each school.
School A: 100/500 = 0.2 or 20% variability in the 3-year data
School B: 400/500 = 0.8 or 80% variability in the 3-year data
Given the percent variability in the data for these schools, if a fully implemented character education program is expected to produce at least a 40% decrease in discipline referrals in schools (based upon previous studies), in which school will the program exhibit the largest effect size if both schools experience a 40% decrease in referrals?
Thus, in two schools with identical enrollment numbers, 3-year discipline referral means, and program outcomes, the character education program will produce a fourfold larger effect size in school A because of the differences in the variability in the data.
Why is this important? The variability in the data impacts the expected effect size that ultimately determines how many classrooms or schools will need to be used in a study in order to detect meaningful change.
Determining How Many Classrooms or Schools to Use in a Study
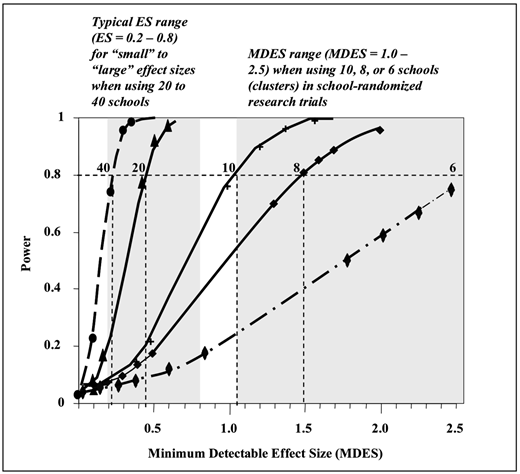
The power curves in Figure 1 obtained using the Optimal Design software allows researchers to determine the relationship between statistical power (the ability to have confidence in the results), the magnitude of the effect size, and the number of classrooms or schools needed for a study. Adequate statistical power is generally considered to be 0.8. The procedure by which the curves in Figure 1 were obtained using the Optimal Design software is provided in Appendix A.
If we consider a single curve, such as the one obtained when using 20 classrooms or schools, we can see how statistical power changes with increasing effect size. For this curve, when the effect size is 0.2, the power is also approximately 0.2 (inadequate power). However, doubling the effect size to ~0.4 produces a fourfold increase in power to ~0.8 (adequate power). If we consider a different curve, such as the one obtained when using only 10 classrooms or schools, then doubling the effect size from 0.2 to 0.4 only increases power from <0.1 to <0.2 (inadequate power). Adequate power (~0.8) is not achieved until the effect size is ~1.0. If we consider the curve representing an eight-school study, adequate power is not achieved until ES~ 1.5.
Historically, effect sizes could be compared between studies in the social sciences because adequate power (~0.8) was assumed when researchers incorporate more than 20 classrooms or schools in large research trials. Thus, Cohen’s (1988) designation of small, medium, and large effect size values of 0.2, 0.5 and 0.8, respectively, could be reasonably used. However, because federal guidelines require evidence of program effectiveness in local schools, district administrators must determine what type of study (small or large) can be undertaken given the district’s financial and logistical constraints. For instance, if the district can support a 20-school study, then if we consider the example above involving schools A and B, the district would be able to measure changes in discipline referrals using a mixture of 20 schools exhibiting either A-type (variability = 20%; ES = 2.0) or B-type (variability = 80%; ES = 0.5) variability when the expected outcome is a 40% decrease in discipline referrals. As indicated by the 20-school curve in Figure 1, adequate power would be obtained if the effect size is at least 0.5.
However, if the district only has sufficient resources for an eight-school study, then the district must limit the variability allowed into the study because the corresponding curve in Figure 1 indicates that an effect size of ~1.5 must be achieved to maintain adequate power in the study. In this case, schools exhibiting A-type (20%) variability would be allowed into a small, eight-school study, but schools with B-type (80%) variability would not be considered. Schools with B-type variability would need to be incorporated into a larger study involving 20+ schools.
Determining the Best Candidates for a Study: Real World Application
Table 1 provides the actual discipline referral data that was submitted to district administrators by10 schools in Michigan interested in measuring the effect of a character education program on student behavior. Decreases in discipline referrals as well as increases in prosocial behaviors were outcomes of interest to the district and are program effects that are of interest to both character education (Berkowitz & Bier, 2011; Character Education Partnership, 2010) and risk prevention (Office of Juvenile Justice and Delinquency Prevention, 2004) agencies. The school district obtained funding to conduct a six-school randomized controlled trial, and then considered how to determine which of the 10 schools should be selected for inclusion in the study prior to random assignment of the schools to intervention or control groups.
The 3-year mean and standard deviation in discipline referrals was determined for each school, and the variability in the data was expressed as a percentage (as was done in the example above using schools A and B). For instance, school #1 reported a 3-year mean of 262 (± 35) discipline referrals. The standard deviation was divided by the mean, yielding a value equal to 13% variability when expressed as a percentage. The percent variability in this outcome was calculated for each school, and then the schools were divided into groups depending on the percent variability (i.e., <40%, 40-75%, or >75%). Four of the schools exhibited less than 20% variability in the data; however, a study incorporating only 4 schools would include only 2 schools per treatment (intervention and control). For statistical reasons, the district needed to use at least 6 schools. Therefore, schools 3 and 4 exhibiting 37% and 32% variability, respectively, were included in the study.
The presence of these two schools with greater variability in the data presents a challenge to researchers. If all schools exhibited comparable variability (i.e. approximately 10-15%), then schools could be randomly assigned to the intervention or control groups without the concern that unequal variability between the groups would occur. However, because of the greater variability in the data from Schools 3 and 4, randomizing at this point would potentially allow both of these schools to be assigned to the same group, thus presenting a scenario in which either the intervention or control group would have much greater initial variability in the data. If this inequality were allowed to occur, the two groups would not be comparable. To prevent unequal incorporation of variability in the intervention and control groups, the six schools were paired according to the variability in the discipline referral data and then randomly assigned from these matched pairs to the intervention or control groups. As a result, the variability was similar in both groups.
At this point, the six-school randomized controlled trial (using 3 intervention and 3 control schools) has the potential to be able to detect behavioral changes if they occur. Before further committing resources to a study, researchers wanted to demonstrate to stakeholders the potential of the study, and wanted to ensure that the study could statistically withstand the impact of incorporating Schools 3 and 4 (exhibiting greater variability in the data).
Previous studies investigating the effectiveness of the character education intervention under consideration had demonstrated that a 25-75% reduction in discipline referrals could be expected as a result of implementing the program. The size of the decrease depended upon a number of factors, including principal support for the process and fidelity of implementation. Therefore, 3 effect size values were of interest to the researchers: (1) the ES value when suboptimal implementation of the program produces a smaller reduction (25%) in discipline referrals; (2) the ES value when optimal implementation of the program produces a larger reduction in discipline referrals (75%); and 3) the ES value at which statistical power is 0.8. Table 2 provides the effect size values that would result from specific reductions in discipline referrals.
Thus, in this study, intervention schools must meet or exceed a 40% reduction in discipline referrals in order to have adequate power such that the school can have confidence in the results. This information allows administrators to see the importance of ensuring that the intervention is implemented with high fidelity by a school staff that is committed to the process. Without this commitment, although the intervention may indeed exhibit small reductions in discipline referrals, researchers will not be able to establish a strong correlation between program implementation and reduction in discipline referrals because there will be insufficient statistical power for the six-school study.
Research Study Design Toolkit
The preceding information demonstrates that administrators can determine in advance whether or not they have the resources to conduct meaningful research. The power curves in Figure 1 provide information to help researchers design a study that will maximize the impact of the resources that are committed for research. Tables 1 and 2 demonstrate how to use actual data in conjunction with the power curves in Figure 1 to determine whether or not researchers can have statistical confidence in the results. The following step-by-step protocol outlines what school districts need to do to set up a rigorous study to measure school-level outcomes:
Determine which school-level changes in behavioral or academic outcomes should be measured. Be specific (i.e., number of discipline referrals, attendance rate, dropout rate, classroom grades, standardized test grades).
Obtain archival behavioral or academic school data from the preceding 3 years from schools that want to participate in the study.
Determine the mean and standard deviation for each school’s data and place the information into a table such as shown in Table 1.
Calculate the percent variability for each school. Group the schools according to the level of variability (i.e., <20%, 20-40%, 40-75%, >75%).
Given the district’s financial constraints, determine how many schools (i.e. 6, 8, 10) can be included in the study.
If there are at least 6 schools with low levels of variability (i.e. <20%) and if there are small differences in the variability for all 6 schools (i.e. the schools exhibit 12%, 15%, 14%, 11%, 10%, 13% variability), then the schools can be randomly assigned to intervention and control groups. However, if the variability is not similar (i.e. 7%, 18%, 9%, 11%, 8%, 19%), then it may be best to create matched school pairs (i.e. Pair 1 [7%, 8%]; Pair 2 [9%, 11%]; Pair 3 [18%, 19%], and then randomly assign the schools from the matched pairs (1 school in each pair assigned to intervention group and 1 school assigned to the control group) such that the percent variability in the intervention and control groups are similar.
If there are 6 schools that do not exhibit similar levels of variability, but exhibit variability in two of the lower variability groupings (i.e. <20% or 20-40%), then matched pairs of schools must be created prior to randomization as described above in step 6. For example, 6 schools exhibiting 37%, 20% 9%, 23%, 34%, and 5% variability would be paired [5%, 9%], [20%, 23%], and [34%, 37%] prior to randomization from matched pairs to intervention and control groups.
Create a table similar to Table 2, using the data from schools assigned to the intervention group and from information found in Figure 1 to determine the expected power level of the study. For each school, determine the ES value at various outcome values (i.e., in Table 2, if school #2 exhibits a 25% reduction in discipline referrals, then the expected ES = [25% reduction/17% variability] = 1.47.) Find the mean ES value for all of the intervention schools. Use Figure 1 to determine the expected statistical power level corresponding to the mean ES value for the intervention group. Do this for a number of outcome levels (i.e., 25%, 40%, 75% etc.) until a power level of 0.8 is achieved.
Given this information, determine whether or not adequate statistical power can be reasonably achieved. If not, a district may consider a couple of options. If the district still wants to conduct schoolwide research, administrators at least know that they are not likely to be able to measure meaningful outcomes even when they occur. Alternatively, districts may decide that they want the study to be able to measure meaningful outcomes, so they may consider how to contain costs by using this same methodology to conduct research at the classroom level.
The online Optimal Design software provided by the W.T. Grant Foundation is a powerful tool that can be used by school researchers to optimize the impact of resources that are committed to conduct research in local schools. This toolkit presents a basic method by which administrators can determine whether or not to conduct schoolwide research on character education programs and can be used to develop classroom-level studies. Being aware of the statistical constraints involved in a research study can help administrators know when to commit resources to develop high impact research studies, thus increasing the effectiveness of funding used for research and decreasing the costs associated with each study.
The authors are grateful for invaluable research discussions with Drs. Thomas Lickona, Matt Davidson, and Vlad Khmelkov (SUNY-Cortland); Vic Battis- tich (late) and Marvin Berkowitz (U. Missouri-St. Louis); Jessaca Spybrook (U. Western Michigan).
Appendix
In the Optimal Design software (v. 2.0; available from the W.T. Grant Foundation, 2011), choose the following power analysis design components:
(a) cluster randomized trial with cluster level outcome (measurement of group processes);
(b) multisite (or blocked) cluster randomized trial;
(c) treatment at level 2;
(d) power for the treatment effect on the y-axis; and
(e) power versus effect size (delta).
Choose the following parameters to generate “best case scenario” power curves:
(f) number of desired schools/clusters, that is, (J) = 6, 8, 10, 20, or 40;
(g) effect size variability (σ2) = 0.01 (random effects model);
(h) number of sites (K) = J/2;
(i) reliability (rel) = 0.9; and
(j) proportion of explained variance by the blocking variable (B) = 0.15.