

The Relationship Questionnaire (Rel-Q) is a multiple choice measure of psychosocial maturity derived from developmental theory that identifies the capacity to differentiate and coordinate the social perspectives of self and other to be central to treating other people in respectful and ethical ways. Data from 1237 students in grades 4 through 12 were used to explore the Rel-Q’s usefulness as a tool for evaluating school-based character education programs. Significant developmental change on mean psychosocial maturity was found across grades (with the exception of a plateau across the middle school grades). The Rel-Q also shows sensitivity to group differences based on differential socialization, with significant differences among students reporting different levels of risk behavior and between genders and social classes. Quantitative and qualitative data on social climate predicted differences in mean psychosocial maturity between schools. The findings suggest that this evaluation measure can assess mature psychosocial choice due to either development or socialization (including school climate), and can help clarify the extent to which character education programs not only teach social awareness and interpersonal skills but also engage students in personally meaningful ways.
The focus of this study is the validation of a measure of psychosocial maturity—the Relationship Questionnaire or Rel-Q—designed for the evaluation of school-based character education programs. The construct of psychosocial maturity used in the Rel-Q derives from developmental theory that identifies the social-cognitive capacity to differentiate and coordinate the social perspectives of self and other as central to character development and education (Selman & Schultz, 1990; Selman, 2003). Growth in psychosocial maturity promotes children’s ability to interact with others respectfully, by incorporating the other’s perspective in one’s social interactions and relationships (Selman, Watts, & Schultz, 1997). Other researchers also recognize that the way people treat children, and the way adults treat others in their presence, is fundamental in character development and its promotion in schools (cf. Berkowitz, 2002).
Theoretical & Methodological History of the Relationship Questionnaire
The Relationship Questionnaire’s assessment of psychosocial maturity based on social perspective coordination was developed within the cognitive-developmental research tradition. Cognitive-developmental theorists (Kohlberg, 1981, 1984; Piaget, 1965; Loevinger, 1966; Selman, 1980) and their intellectual predecessors in social theory (Baldwin, 1906, Dewey, 1933; Mead, 1934) assume that there is a structure to the way persons think about social relations, and these conceptions become more complex as children grow up. Cognitive-developmental theorists stress that socio-moral development is promoted by role-taking opportunities, the perceived socio-moral level provided by an institution, and cognitive-moral conflict that stimulates movement to the next stage through reflective reorganization arising from sensed contradictions in a person’s current structure (Kohlberg, 1984; Rest, 1979; Turiel, 1966).
In order to map out the hierarchical, universal, and invariant sequence of stages of structural development empirically, cognitive-developmental researchers initially assessed subjects with reflective interview methodology (Piaget, 1983; Colby & Kohlberg, 1987). This methodology, pioneered in Piaget’s methode clinique, uses extensive questioning with probes to illuminate the compexity of subjects’ social reasoning, thus assessing the highest developmental level in their repetoire. Establishing the age-related developmental sequence of structural stages—as Piaget did for cognitive development, Kohlberg in the domain of moral reasoning development, and Selman (1980) for social reasoning development—is an assessment of individual competence. The use of this reflective interview methodology to study differences across groups, such as gender, social class, and ethnicity (in basic research) or differences between intervention groups (in evaluation) provides a means to track systematic influences on the development of socio-moral competence, such as socialization processes or effective school-based character education programs.
Selman and colleagues used reflective interviews and manual-based scoring systems to develop a model of relationship awareness that includes three social-cognitive constructs:
interpersonal understanding or social reasoning (Selman, 1979),
interpersonal negotiation strategies or conflict resolution in thought and action (Schultz, Yeates, & Selman, 1988), and
awareness of the personal meaning of relationships (Levitt & Selman, 1993).
Although the three constructs in this “Relationship Framework” share a developmental substructure (the capacity for social perspective coordination), two of the constructs—the social-cognitive abilities to resolve conflict and to make meaning of one’s social relationships—are more affect-laden and contextual than the third construct the more strictly cognitive ability to understand the social world.
Table 1 presents the Relationship Framework as it is represented in the Relationship Questionnaire scales, showing how the levels of social perspective coordination give developmental form (structure) to the psychosocial competencies, which develop along parallel tracks, each along a continuum from immature (undifferentiated) to mature (differentiated and integrated). The assessment of interpersonal understanding, negotiation, and meaning with probed hypothetical social dilemmas in normative, longitudinal, and clinical comparative studies showed children to be capable of expressing developmental levels of social perspective coordination in an age progression, as shown in Table 1, that maps onto structural-developmental assessments in the cognitive and moral domains (cf. Selman, 1980).
Developmental Levels in the Psychosocial Competencies of Psychosocial maturity as Operationalized in the Five Scales of the Relationship Questionnaire
| Theoretical Foundation | Rel-Q Scales | |||||
|---|---|---|---|---|---|---|
| Interpersonal Understanding | Interpersonal Negotiation | |||||
| Level | Social Perspecitve Coordination | Agea | Understanding | Persp.-takingb | Hypothetical & Real-Life | Personal Meaning |
| 0 | egocentric | 3-5 | undifferentieted | none | impulsive | dismissive |
| 1 | one-way/ | 6-7 | differentieted | first-person | unileterel | rule-besed, impersonel |
| 2 | reciprocal | 7-8 | reflective | second-person | cooperetive | rule-besed, personel |
| 3 | mutual | 12-14 | third-person | third-person | compromising | need-besed (isoleted) |
| 4 | interdependent | 15-18 | intersubjective/societel-symbolic | generelized other | colleboretive | need-besed (integreted) |
aAge when capacity emerges normatively.
bNumber of coherent perspectives.
The Relationship Framework, in describing how social-cognitive capacities underlie social interaction and development, addresses a common critique of cognitive-developmental approaches to sociomoral research: that there is little relation between the development of social cognition and real-world action (Ashton, 1978). This social-cognitive theory describes “levels” (instead of “stages”) of social perspective coordination (see Selman, 1980; Selman & Schultz, 1990), which underlie understanding, action, and meaning, taking into account affective and meaning-oriented influences on social-cognition in action. Levels indicate that persons can oscillate in their performance as a function of social context.
Interpersonal negotiation strategies (INS), for example, were found to vary systematically across social contexts, with developmental level varying according to the social role of the other, such as adult versus peer, or friend versus acquaintance (Selman, Beardslee, Schultz, Krupa, & Podorefsky, 1986; Yeates, Schultz, & Selman, 1991). INS also varies individually across contexts: troubled youth exhibit more variable INS and more “gaps” between understanding and action, though even socially-competent children seem to negotiate at a lower developmental level when upset by an interpersonal conflict (Selman & Schultz, 1990). In this way, various contexts for interpersonal negotiation seem to entail different internal dynamics and emotional pulls, resulting in social actors’ use of varying levels of social perspective coordination. The use of this capacity in actual social interaction seems to be highly dependent on the social, emotional, and role-related contexts of the interpersonal relationships involved, in contrast to the more structural nature of the construct of interpersonal understanding. This contextual dimension of the Relationship Framework departs from its historical origins in the work of Piaget (1983) and Kohlberg (1969), and is more akin to Werner’s (1948) comparative view of mental development.
The affective component of the relationship model, the personal meaning competency, sheds light on the reason for thought-action gaps to the extent that it accounts for emotional forces generated by complicated psychological processes. Personal meaning awareness represents the extent to which individuals connect their behavior to their own life histories, which involves a developing capacity to consciously appreciate and explicitly express how one’s behavior is embedded in the complex fabric of past and present relationships (Levitt & Selman, 1993, 1996). When persons have relatively high-level social understanding but negotiate conflict less maturely than their perspective coordination ability would ordinarily enable them to do, their personal meaning also tends to be at a lower developmental level (Levitt, Selman, & Richmond, 1991; Selman, Levitt, & Schultz, 1997). For example, when an adolescent understands why his parents and other adults oppose fighting and violence but nevertheless joins a gang and bullies others (despite having lost a cousin to gang violence) because he thinks fighting is always cool and everyone will look up to him, then his personal meaning of fighting is at a low (rule-based) developmental level.
The individual interview and observational methodologies used to develop the Relationship Framework are labor intensive and relatively costly, and therefore not practical for the large-scale samples and longitudinal data collection required for evaluating most school-based prevention/intervention programs. The Relationship Questionnaire was developed in response to this program evaluation need, particularly for programs influenced by social developmental theory, using practice-based research. In this approach, investigations into children’s social development are based in practices designed to promote social competence (Schultz, Barr, & Selman, 2001; Selman, 2003; Selman, Watts, & Schultz, 1997). The developmental theory—the Relationship Framework—identified social perspective coordination, particularly its expression in personal meaning, as a potent change agent in the practice of intervention/prevention programs focused on promoting children’s character development. The theory in turn informed the development of the Rel-Q measure to evaluate these programs, as well as to further study normative social and character development.
The Relationship Questionnaire was initially developed to help evaluate a school-based multicultural literacy promotion, character education, and violence prevention program, the Voices of Love and Freedom (VLF) project (Walker, 1997). The VLF program aims to promote students’ perspective-taking and relationship capacity, and a measure with which to assess large samples of students was needed to test the hypothesis upon which the VLF program was designed: that problem behaviors of students would be negatively related to the developmental level of their interpersonal relationship competencies.
In the first phase of the instrument’s development, data from the qualitative interviews assessing interpersonal negotiation strategies and interpersonal understanding were used to constuct Rel-Q items. Item prompts were constructed from the interview dilemmas, and multiple-choice responses to these prompts representing different developmental levels were selected from actual subject answers. Cross-sectional pilot assessments of program and comparison public school students from fourth through twelfth grade supported the potential of the questionnaire to test the hypothesis underlying the prevention program: students’ developmental levels of interpersonal understanding and skills were significantly inversely related to both violent behavior and drug use.
The Rel-Q was revised a number of times to refine its theoretical and psychometric properties (Schultz, Selman, & Adalbjarnardottir, 1996). For example, the seven multiple choice responses for each item in the first version posed too many choices for many subjects, so the number of responses was reduced to four choices by eliminating responses that did not discriminate subjects by age, or that were chosen either seldomly or too often by all age groups. In this intermediate phase of the Rel-Q’s development, personal meaning items were added and the measure was administered to diverse samples (elementary and high school students in the U.S. and Iceland and adolescent girls at a residential treatment center). The Rel-Q was revised in a third and final phase of development with the addition of new items and the item rating scoring to improve its internal consistency, and a picture-based version for younger (kindergarten through third grade) children was developed and pilot tested.
The interpersonal constructs of the Relationship Framework as measured with the qualitative interview methodology showed consistent developmental trends from preschool through twelfth grade (e.g., Selman, 1980; Selman, Schultz, & Yeates, 1991), and this age progression is a key criteria for the validity of the Rel-Q. Other findings with its forerunner interview methodologies were less uniform. Although no gender differences were found for interpersonal understanding (Selman, 1980), girls consistently scored higher than boys on the Interepersonal Negotiation Strategies Interview (e.g., Yeates, Schultz, & Selman, 1991).
Several evaluation studies have demonstrated that the Rel-Q has the potential to document growth in psychosocial maturity in character education programs. In an evaluation of the Facing History and Ourselves program, the students participating in the program showed significantly greater change in psychosocial maturity than comparison students (Schultz, Barr, & Selman, 2001). Nakkula and Nikitopoulos (2001) used a Spanish version of the Rel-Q in an evaluation of the Program for Young Negotiators with early adolescents in Buenes Aires, Argentina, and found significant change in psychosocial maturity, including interpersonal understanding, negotiation, and personal meaning of relationships. Students in this study with thought-actions gaps at the pretest (measured as a difference between interpersonal understanding and negotiation levels) changed substantially more than other students on a measure of negotiation ability.
The Rel-Q multiple-choice methodology is designed to measure complex social developmental constructs originally assessed by individual interview methodology, much like the multiple-choice Defining Issues Test (DIT; Rest, 1986) was developed to assess Kohlberg’s construct of moral reasoning as an alternative to the Moral Judgment Interview. The Rel-Q methodology, with preconstructed responses and lack of probing, not only taps individual and developmental differences among students, but may also be able to measure individual differences in social perceptions reflecting differences in the social or moral atmosphere of students’ schools and neighborhoods.
Research Questions
Data across a variety of samples will be used to examine the characteristics of the Rel-Q assessment (e.g., its developmental nature and sensitivity to sociocultural factors) to illuminate its utility as a tool for evaluating school-based character education programs, guided by the following questions:
What are the psychometric properties of the Rel-Q?
It is expected that psychosocial maturity as measured by the Rel-Q will show significant developmental differences from fourth through twelfth grade, both cross-sectionally and longitudinally, and a negative relationship with students’ self-reported negative risk-taking behavior, supporting the measure’s validity. The relation of psychosocial maturity to other variables, including gender and social class will also be examined, and differences among the individual psychosocial competencies (i.e., the Rel-Q subscales) will be explored.
Is variation in psychosocial maturity across schools related to school social and moral climate, measured both quantitatively and qualitatively?
It is expected that the Rel-Q as a measure of social maturity will distinguish groups that experience different school climates.
Method
Subjects
Subjects were public school elementary and middle school students; twelfth grade students were also recruited to test whether the Rel-Q has ceiling effects for high school students. The sample included 1237 students as follows: 180 fourth graders (age 9), 371 sixth graders (age 11), three subsamples totalling 545 eighth graders (age 13), and 141 twelfth graders (age 17). Table 2 presents the demographics of each sample.
Longitudinal follow-up data were available for three samples (samples A, B, and D) as follows: the fourth grade sample (spring and fall of grade 4 and spring of grade 5), the sixth grade sample (spring of grades 6, 7, and 8) and the largest eighth grade sample (fall and spring). In sample B, based on Rel-Q results when the students were in grade 6, four (out of fourteen) schools reflecting a range of mean psychosocial maturity scores were selected for more in-depth study in grades 7 and 8.
Except for one school system in which the Rel-Q was administered as part of the health curriculum, written consent was obtained from parents and guardians through letters sent home and collected by teachers. Only students with written permission participated in the study; the participation rate ranged from 86% to 100%, with an average participation of 94%.
Measures
Psychosocial Maturity
Psychosocial maturity was measured with the Relationship Questionnaire. The Rel-Q is a multiple-choice measure that assesses the level of social development based on the Relationship Framework described earlier. Like the majority of child self-report questionnaires, it requires third- to fourth-grade reading skills, and is designed for fourth grade through twelfth grade. A second Rel-Q version that uses verbal instructions and pictures of animals instead of words was developed for younger children from kindergarten to third grade (Schultz & Selman, 2004). The Rel-Q measure is usually group administered, but can be given one-on-one (especially desirable for students with behavioral or cognitive problems or those with reading deficiencies).
Sample Sizes and Characteristics
| Sample | ||||||
|---|---|---|---|---|---|---|
| A | B | C | D | E | F | |
| Size | 180 | 371 | 135 | 138 | 410 | 141 |
| Grade(s) | 4-5 | 6-7-8 | 8 | 8 | 8 | 12 |
| Gender: girls/boysa | 83/88 | 61/56 | 68/63 | 85/50 | 213/197 | 94/43 |
| Region | NE | NE | NE | South | NE | NE |
| Location | Urban | Urbanb | Urbanb | Urban | Urban/suburban | Urban/suburban |
| Free lunch | 89% | 31%c | 45%c | 27% | n/ad | n/a |
| Race/Ethnicity | ||||||
| White | 11% | 32% | 40% | 36% | 62% | 59% |
| Black | 53% | 29% | 23% | 60% | 6% | - |
| Hispanic | 31% | 15% | 12% | 2% | 4% | - |
| Other | 5% | 24%e | 25%e | 2% | 28%f | 41%f |
The demographics for each longitudinal sample is for the first time point.
aGender was missing for 21 subjects.
bSame school system;
cIn grade 6, 22% of students indicated “I don't know” whether they received free lunch, whereas only 7% of grade 8 students didn't know.
dn/a = not available.
eBiracial, other, don't know.
fIncludes Black, Hispanic, and other.
The Rel-Q consists of 24 questions comprising five scales: understanding of interpersonal relationships (6 questions), perspective-taking (4 questions), hypothetical interpersonal negotiation (4 questions), real-life interpersonal negotiation (4 questions), and awareness of personal meaning (6 questions). Two Rel-Q scales represent interpersonal understanding (understanding and perspective-taking), two scales represent interpersonal skills (hypothetical and real-life interpersonal negotiation) and the fifth Rel-Q scale represents the third competency, (inter)personal meaning awareness, as shown in Table 1.
Items in the measure pose dilemmas or common social situations with peers or adults. The questions on the measure each have four multiple-choice responses, which represent points in the continuum of four theoretical levels in the coordination of social perspectives, ranging from egocentric (Level 0) to unilateral (Level 1) to reciprocal (Level 2) to mutual (Level 3).1 For example, in the hypothetical negotiation questions, a situation involving a conflict between a particular protagonist and another person (either an adult or peer) is presented, followed by four actions the protagonist could take to respond to the disequilibrium. In this example, one of the four hypothetical negotiation questions on the Rel-Q asks children to respond to a common early adolescent parental conflict:
Gladys, who has a ten o’clock curfew, goes to a party one Saturday night. She gets home at 12:00 and her father is waiting up for her. He is very angry and grounds her for a month. Gladys feels that the punishment is too severe and thinks she is old enough to stay out past 10:00. Gladys could
a. storm out of the room.
b. tell her father he can’t tell her what to do.
c. ask her father to work with her on an agreement, which would allow her to stay out later on weekends.
d. explain to her father why she feels she’s old enough to stay out late.
These four responses range from impulsive negotiation (storm out of the room—Level 0), to a unilateral strategy (tell her father he can’t tell her what to do—Level 1), to reciprocal negotiation (explain to her father why she feels she’s old enough to stay out late—Level 2), and to a mutual strategy (ask her father to work with her on an agreement which would allow her to stay out later on weekends—Level 3).
The following is an example of an interpersonal understanding item:
A good teacher
a. does not yell.
b. keeps the class quiet.
c. lets the students help make some decisions.
d. listens to students’ ideas.
These responses range from egocentric understanding (does not yell—Level 0), to a unilateral understanding (keeps the class quiet—Level 1), to more reflective and reciprocal understanding (listens to students’ ideas—Level 2) to a mutual, third-person understanding (lets the students help make some decisions—Level 3).
Subjects rate each multiple-choice response on a four point Likert scale (poor, average or “OK,” good, excellent), then choose the “best” response of the four responses. This method yields two Rel-Q scores for each item (and for each scale): a “response rating” score, based on students’ separate ratings of the four multiple choice responses, and a “best response” score, based on which response they choose as “best.” The procedures used to score the best response and response-rating scales are described in Schultz and Selman (2000).
“Best response” scores for each of the five Rel-Q subscales (social perspective coordination, interpersonal understanding, hypothetical and real-life negotiation, and personal meaning awareness) are computed by averaging the “best response” scores for each question in that domain. Similarly, the response rating subscale scores are computed by averaging the response rating scores for each question in that subscale. The overall best response and response rating scores are computed by averaging the five subscale scores. Because both the best response and response rating scores have similar developmental level metrics, they can be averaged into a composite score for each subscale, and then into one overall psychosocial maturity score.
Cronbach’s alpha across these samples for overall psychosocial maturity was .87 for the composite, .71 for the best choice score, and .82 for the response rating score, indicating relatively good internal consistency. Internal consistency was less adequate for the subscales, with real-life negotiation strategies having the highest and personal meaning awareness the lowest alphas. The subscale composite score alphas ranged from .52 to .68, the response rating alphas ranged from .45 to .61, and the best response alphas ranged from .27 to .46. The latter are low because the best response scores are based on only one piece of information for 4 to 6 items per scale.
Risk-Taking Behavior
Self-reported negative risk-taking behaviors were measured in four samples (samples B, D, E, and F) with an adaptation of the Centers for Disease Control and Prevention’s Youth Behavior Risk Survey (CDC, 1990). Included were multiple choice questions about fighting behavior (e.g., How many fights have you gotten into in the last three months?), carrying weapons to school, various criminal acts, and smoking, drinking and other drug use.
School Social Climate
The social environment of four schools chosen for more intensive study in sample B was measured with both quantitative and qualitative methods when the students were in grades 7 and 8.
The Effective School Battery
The Effective School Battery (ESB) is a questionnaire that provides information about the psychosocial climate and population characteristics of schools (Gottfredson, 1984). The student version was administered to all eighth graders in the four schools. The measure provides norm-based scores on a number of scales, including perceived safety, respect for students, fairness of rules, clarity of rules, and student influence.
Focus Groups
Focus group sessions were conducted with groups of 6 to 9 students in three of the four schools in the spring of grades 7 and 8 to explore psychosocial aspects of adolescent risk behavior. Multiple sessions were conducted with each group to explore the students’ perceptions of risk, prevention programs, policies, and practices in their schools. A brief report of data from these sessions regarding school climate is presented here; for a full report see LaRusso (2004).
Other Measures
Moral Reasoning
Moral reasoning was assessed in one eighth grade sample with a short form of Rest’s (1979) Defining Issues Test (DIT), a questionnaire designed to measure Kohlberg’s (1969) moral development stages. In extensive testing (Rest, 1986), the DIT has been found to be a reliable and valid measure of the degree to which a person considers principles important in making moral decisions. The DIT’s D score, which was available for 224 students, was used in this study.
Social Skills
Self-reported student social skills were assessed by the American Guidance Service Social Skills Rating System (SSRS)—Student Form (Gresham & Elliott, 1990) for the fourth grade sample. The student form of the SSRS is a validated 34-item instrument in which students rate on a three-point scale how often (never, sometimes, very often) they do specific social behaviors. The SSRS social skills scale has four subscales: cooperation, assertion, empathy, and self-control. The student form has good internal consistency (α = .82), test-retest reliability over four weeks (r = .68), and criterion-related and construct validity across grades 3 to 6.
Socioeconomic status
SES was measured in two different ways. In the fourth grade sample, participation in the free lunch program was obtained from the school department records. In the sixth grade sample, participation in free lunch was self-reported on the risk-taking behavior survey described above. In one eighth grade sample (sample E) and in the twelfth grade sample, a self-report of father’s education was obtained. Father’s education is measured as years of education, with 12 years representing a high school education, 16 years representing a college education, and more than 16 years representing graduate study.
Results
Research Question 1. What are the psychometric properties of the Rel-Q?
A grade X gender ANOVA conducted on psychosocial maturity across the entire sample showed significant main effects for both grade [F(3,1337) = 80.68, p < .0001] and gender [F(1,1337) = 142.49, p < .0001]. There was no interaction between grade and gender. Girls scored higher than boys at each grade, and mean psychosocial maturity increased from 1.82 in fourth grade to 2.21 in twelfth grade on the composited score, as shown in Table 3. The increase with grade was even more dramatic for the best response score, which increased from 1.79 in fourth grade to 2.37 in twelfth grade. The mean for eighth graders on this score was about 2.10, which is .30 of a developmental level above the mean of the fourth graders, and .30 of a developmental level below the mean of the 141 twelfth graders. Thus, the mean of overall psychosocial maturity appears to increase between a quarter and a third of a developmental level during each four-year interval, supporting the validity of the developmental properties of the measure.
Means and Standard Deviations for Psychosocial Maturity across Samples by Grade Level and Gender
| Composite | ||||||||||||
|---|---|---|---|---|---|---|---|---|---|---|---|---|
| Sample | Grade & Time of Year | Best Response | Response rating | Composite | Female | Male | ||||||
| A | 4 | fall | 1.79 | (0.36) | 1.85 | (0.18) | 1.82 | (0.24) | 1.88 | (0.26) | 1.76 | (0.22) |
| spring | 1.87 | (0.36) | 1.84 | (0.18) | 1.87 | (0.24) | 1.94 | (0.22) | 1.82 | (0.26) | ||
| 5 | spring | 1.89 | (0.38) | 1.96 | (0.19) | 1.92 | (0.26) | 2.00 | (0.25) | 1.82 | (0.26) | |
| B | 6 | spring | 2.05 | (0.37) | 2.04 | (0.17) | 2.04 | (0.25) | 2.12 | (0.19) | 1.97 | (0.28) |
| 7 | spring | 2.04 | (0.36) | 2.03 | (0.18) | 2.03 | (0.25) | 2.13 | (0.33) | 1.96 | (0.25) | |
| 8 | spring | 2.08 | (0.36) | 2.05 | (0.18) | 2.05 | (0.24) | 2.16 | (0.21) | 1.98 | (0.27) | |
| C | 8 | spring | 2.12 | (0.37) | 2.05 | (0.22) | 2.08 | (0.27) | 2.14 | (0.23) | 2.03 | (0.30) |
| D | 8 | fall | 2.14 | (0.27) | 2.06 | (0.16) | 2.10 | (0.20) | 2.16 | (0.21) | 1.98 | (0.27) |
| E | 8 | fall | 2.10 | (0.38) | 2.06 | (0.18) | 2.08 | (0.26) | 2.17 | (0.16) | 2.01 | (0.21) |
| 8 | spring | 2.07 | (0.36) | 2.03 | (0.19) | 2.06 | (0.26) | 2.15 | (0.21) | 1.95 | (0.27) | |
| F | 12 | fall | 2.37 | (0.40) | 2.17 | (0.16) | 2.21 | (0.22) | 2.25 | (0.17) | 2.10 | (0.28) |
Standard deviations are in parentheses next to the means.
Post-hoc comparison tests (Scheffe’s) indicated that fourth graders scored significantly lower than sixth, eighth, and twelfth graders, and that sixth and eighth graders scored significantly lower than twelfth graders. However, the sixth grade scores were not significantly different from the eighth grade scores. As shown in Table 3, the mean for the sixth graders (2.04) was close to that of the three eighth grade samples, which were remarkably similar to each other (2.07, 2.08, 2.10) given the different demographics of these samples (see Table 2).
Longitudinal and cross-sectional analyses of the fourth- and sixth-grade samples support this pattern of significant change in the upper elementary grades and nonsignificant change in middle school. There was significant longitudinal change across fourth grade (fall to spring) in psychosocial maturity (t = 2.35, p = .0201). Although the longitudinal change from spring of fourth to the spring of fifth grade did not reach significance for the composited psychosocial maturity score (t = 0.59, p = .5586), change measured with the response rating score approached significance (t = 1.97, p = .0516), and the cross-sectional differences between spring of fifth grade to the spring of sixth grade was significant (t = 4.86, p < .0001). The longitudinal change from six to eighth grade, however, was nonsignificant (with the change from grades 6 to 7 close to zero in magnitude).
Table 4 presents means and standard deviations for the Rel-Q subscales across grade levels. To determine whether there were differences among the five psychosocial competencies, a multivariate analysis of variance was conducted using the subscale composite scores as dependent variables and grade and gender as independent variables. The within subjects effects showed a significant effect for type of psychosocial competency (F = 4.56, p = .0011) and an interaction between type of competency and grade (F = 5.07, p < .0001). This finding suggests that there are differences among the psychosocial competencies and that this relation changes across grades. For example, the lowest mean in grade 4 was interpersonal understanding, whereas the lowest mean in grade 12 was personal meaning awareness, as shown in Table 4. The between subject effects showed a main effect for both grade (F = 20.54, p < .0001) and gender (F = 20.54, p < .0001), indicating that the developmental and gender differences held for all five Rel-Q subscales.
In order to further explore the relations among the psychosocial competencies, a thought-action gap variable was computed by averaging the hypothetical and real-life negotiation scales, and subtracting this overall negotiation scale from the interpersonal understanding scale. A regression analysis conducted on the thought-action gap variable, controlling for grade and gender, showed a significant main effect for personal meaning awareness levels (B = -0.73, t = -2.40, p = .0165). The overall F statistic for this regression was F (3,1159) = 3.94, p = .0082, and the control variable statistics were grade (B = .013, t = 2.28, p = .0229) and gender (B = -.018, t = -0.88, p = .3790). The negative coefficient for the personal meaning predictor indicates that higher gaps between thought and action are predicted by lower developmental levels of personal meaning, suggesting that the promotion of personal meaning awareness may play a particularly effective role in enhancing social development in character education programs.
Table 5 presents the correlations of psychosocial maturity with negative risk-taking behaviors and other measures. The overall Rel-Q score was significantly negatively related to self-reported fighting behavior. Psychosocial maturity was correlated with fighting in the last six months at r = -.20, p < .05 in both the grade 6 and 8A samples, at r = -.42, p < .0001 in the grade 8C sample, and at r = -.29, p < .01 in the twelfth grade sample. Psychosocial maturity was also negatively correlated with other risk taking behaviors as shown in Table 4, including alcohol use (grades 6, 8A, 8C, and 12), carrying weapons to school (in grades 8C and 12, though not in grade 6 nor sample 8A), and smoking cigarettes (in both eighth grade samples but not in the sixth or twelfth grades). Although the relationship between psychosocial maturity and risk-taking behavior tends to be consistently negative, the magnitude of the negative association varies across samples, suggesting that risk-taking behavior levels may index other socio-cultural factors operating to influence student behavior.
Table 5 also presents correlations with two constructs conceptually related to psychosocial maturity, moral reasoning measured with the Defining Issues Test in one eighth grade sample and social skills from the Social Skills Rating System in the fourth grade sample. Moral reasoning was associated with psychosocial competence at a moderate level (r = .36; p < .0001). The correlation with SSRS social skills was at a lower effect size though still significant (r = .25; p < .0001).2
Psychosocial maturity shows a significant association with socioeconomic status (SES) in each sample except the inner city grade 4 sample. In that sample the correlation between psychosocial maturity and SES was near zero in magnitude (r = .01) because there was little variation in SES: participation in the free lunch program was uniformly high, ranging from 84% to 100% across four schools. In grade 6 and grade 8 (sample A), SES measured as participation in the free lunch program was negatively correlated with psychosocial maturity (r = -.18 and r = -.27, respectively, p < .001). In grade 8 (sample E) and grade 12, SES measured as father’s education was positively correlated with psychosocial maturity (r = .22, p < .001, and r = .28, p = .0263, respectively). Thus, because higher free lunch participation indicates lower SES and higher father’s education indicates higher SES, higher SES was significantly associated with higher psychosocial maturity at each grade level.
Means and Standard Deviations for Rel-Q Subscales across Grade Levels
| GRADE | ||||||||
|---|---|---|---|---|---|---|---|---|
| 4 (n= 180) | 6 (n = 371) | 8 (n = 679) | 12 (n = 140) | |||||
| Psychosocial competencies | ||||||||
| Interpersonal understanding | ||||||||
| best response | 1.76 | (0.46) | 1.93 | (0.43) | 2.01 | (0.46) | 2.40 | (0.33) |
| response rating | 1.78 | (0.23) | 2.01 | (0.19) | 2.03 | (0.20) | 2.17 | (0.17) |
| composite | 1.77 | (0.29) | 1.97 | (0.28) | 2.02 | (0.30) | 2.22 | (0.22) |
| Perspective coordination | ||||||||
| best response | 1.71 | (0.68) | 2.12 | (0.59) | 2.17 | (0.56) | 2.36 | (0.43) |
| response rating | 1.88 | (0.30) | 2.10 | (0.29) | 2.14 | (0.26) | 2.26 | (0.26) |
| composite | 1.80 | (0.43) | 2.11 | (0.39) | 2.15 | (0.36) | 2.27 | (0.29) |
| Hypothetical negotiation | ||||||||
| best response | 1.76 | (0.60) | 2.15 | (0.56) | 2.03 | (0.58) | 2.43 | (0.45) |
| response rating | 1.96 | (0.32) | 2.20 | (0.26) | 2.14 | (0.29) | 2.28 | (0.24) |
| composite | 1.86 | (0.41) | 2.17 | (0.38) | 2.11 | (0.40) | 2.30 | (0.29) |
| Real-life negotiation | ||||||||
| best response | 1.72 | (0.71) | 2.11 | (0.69) | 2.24 | (0.57) | 2.53 | (0.55) |
| response rating | 1.90 | (0.28) | 2.11 | (0.29) | 2.17 | (0.28) | 2.27 | (0.25) |
| composite | 1.81 | (0.44) | 2.11 | (0.44) | 2.20 | (0.42) | 2.33 | (0.33) |
| Personal Meaning | ||||||||
| best response | 1.95 | (0.57) | 2.02 | (0.53) | 2.10 | (0.57) | 2.43 | (0.58) |
| response rating | 1.79 | (0.21) | 1.91 | (0.22) | 1.95 | (0.23) | 1.97 | (0.20) |
| composite | 1.86 | (0.33) | 1.96 | (0.32) | 2.01 | (0.35) | 2.07 | (0.32) |
Correlations of Psychosocial Maturity with Negative Risk-Taking Behaviors, Moral Reasoning, Social Skills and SES by Grade
| Psychosocial maturity | ||||||
|---|---|---|---|---|---|---|
| Grade: | 4 | 6 | 7 | 8C | 8E | 12 |
| r | r | r | r | r | r | |
| Negative risk-taking behaviors | ||||||
| Fights1 | -.20* | -.25*** | -.20* | -.42*** | -.29** | |
| Criminal acts | -.34*** | -.42*** | ||||
| Shoplifting | -.19* | .01 | ||||
| Sexual assault | -.29** | -.22*** | -.13 | |||
| Weapons | -.16 | -.26*** | -.07 | -.40*** | -.44*** | |
| Cigarettes | -.13 | -.24** | -.23* | -.31*** | -.12 | |
| Alcohol/drug use2 | -.28**/-.14 | -.14** | -.11/-.20* | -.35*** | -.27** | |
| Related to Psyhosocial Maturity | ||||||
| Moral reasoning (DIT) | .36*** | |||||
| Social skills (SSRS) | .25** | |||||
| Socioeconomic status | ||||||
| Free lunch participation | .01 | -.18*** | -.25*** | -.27*** | ||
| Father's education | .22*** | .28* | ||||
1Fights in last 6 months.
2Alcohol for grades 6 and 8a: in last year/in last month.
* p < .05;
** p < .01;
*** p < .001
Research Question 2. Is variation in psychosocial maturity across schools related to school social and moral climate, measured both quantitatively and qualitatively?
Mean psychosocial maturity for the fourth grade sample was examined across the four different schools comprising this sample in the fall and spring of fourth grade and the spring of fifth grade. ANOVAs conducted on psychosocial maturity indicated a significant main effect for school at each of the three time points. Average psychosocial maturity ranged from 1.70 to 1.86 in the fall of grade 4 (F = 3.96, p = .0092), from 1.78 to 1.98 in the spring of that year (F = 5.00, p = .0024), and from 1.86 to 2.05 in the spring of grade 5 (F = 2.87, p = .0386). As noted above, there were no significant differences in social class, which was uniformly low, to account for these variations in psychosocial maturity across the schools.
This pattern of significant differences in psychosocial maturity across schools within the same grade, even those within the same community, was evident in the other school-based samples in this report. For example, the large (n = 410) eighth grade sample was drawn from nine schools in six communities in the same geographic area. Means for psychosocial maturity in this sample varied widely, as shown in Table 6, even accounting for type of community (urban vs. suburban), a proxy for socioeconomic status.3 Within communities whose schools differed significantly in psychosocial maturity (suburban community D and urban community E), the schools with higher psychosocial maturity showed lower amounts of fighting and criminal behaviors than the lower psychosocial maturity school (though the difference was not significant). However, this relationship between psychosocial maturity and risk behavior was not consistent: there were two schools in another urban community (F) with almost identical means for psychosocial maturity but with significant differences in fighting and criminal behaviors. Also, the other suburban communities (A, B, and C) showed wide differences in negative risk-taking behaviors despite similarly high means on psychosocial maturity, with one school’s mean for criminal behaviors the highest in the entire sample. Thus, other systematic factors in addition to gender, social class, and sociocultural factors indexed by amounts of negative risk behavior seem to be influencing school differences in psychosocial maturity at any given grade level.
Psychosocial Maturity and Risk-Taking Behaviors Across Schools in an Eighth Grade Sample
| Suburban | Urban | ||||||||
|---|---|---|---|---|---|---|---|---|---|
| Community: | A | B | C | D | E | F | |||
| School: | 1 | 1 | 1 | 1 | 2 | 1 | 2 | 1 | 2 |
| Psychosocial maturity | 2.17 | 2.13 | 2.11 | 2.15 | 1.99 | 2.16 | 2.06 | 2.03 | 1.99 |
| Fights | 2.07 | 2.33 | 1.86 | 2.11 | 3.19 | 2.33 | 2.58 | 2.44 | 1.66 |
| Criminal behaviors | 2.05 | 0.21 | 0.26 | 1.13 | 2.03 | 0.74 | 0.68 | 0.86 | 0.25 |
| Father's educationa | 16.65 | 16.27 | 17.05 | 16.68 | 15.89 | 13.94 | 14.71 | 14.76 | 14.12 |
aEducation in years, with 16 years indicating four years of college.
In sample B, in which all students in a grade cohort in the fourteen elementary (K – 8) schools in one city were followed across three years (grades 6 through 8), mean psychosocial maturity scores varied widely across schools. ANOVAs conducted on the psychosocial maturity score, controlling for grade and gender, showed a significant main effect for school at each of the three time points (grade 6: F = 4.09, p < .0001; grade 7: F 2.29 = , p = .0084; grade 8: F = 2.92, p = .0010). For example, average psychosocial maturity scores across the 14 schools ranged from 1.84 to 2.13 in the second year of the study when the students were seventh graders and from 1.88 to 2.16 in the third year when they were eighth graders. The lowest mean psychosocial maturity score is close to the fourth grade norms and the highest mean score is roughly equivalent to the eighth grade norms shown in Table 3. Thus, the students in some of this city’s schools scored as developmentally advanced, on average, while in other schools in the same community, the students seem developmentally behind.
Table 7 presents data on the four schools in this district with the highest and lowest psychosocial maturity scores when the students were in grade 8. Feelings of interpersonal safety measured by the risk questionnaire vary widely across these schools, with the number of students who report feeling “not at all safe” ranging from 4% to 27%. Schools A and B, with the lowest psychosocial maturity scores in the district (1.88 and 1.99, respectively) had lower perceived school safety (27% of students not feeling safe in school A and 10% in school B) and low social class (55% and 68% free lunch, respectively). In contrast, schools C and D, with the highest psychosocial maturity scores (2.13 and 2.16, respectively) have fewer students feeling unsafe (4% and 5%, respectively) and higher social class (18% free lunch in both schools).
Although lower mean Rel-Q scores are generally associated with markers of poverty—lower social class and lower perceived school safety—there seem to be other sociocultural factors operating to constrain students’ understanding of relationships. Students’ perceptions of school climate in schools with low psychosocial maturity differ dramatically from those with high psychosocial maturity. The T-scores for several items from the Effective School Battery presented in Table 7 show these differences in students’ perspectives on their schools’ social climate, including the perceived level of respect for students (school A—very low, school D—moderately high), the safety of the school environment (school A and B—average; schools C and D—moderately high and high), the extent to which students feel they can influence matters of concern to them (A—moderately low, C—high), and social integration rather than alienation (A—very low, D—very high).
Psychosocial Maturity, Socioeconomic Status, and Perceived School Climate for Eighth Graders Across Schools Within a District
| School | |||||
|---|---|---|---|---|---|
| District | A | B | C | D | |
| Relationship Questionnaire | |||||
| Psychosocial maturity mean | 2.08 | 1.88 | 1.99 | 2.13 | 2.16 |
| Socioeconomic status | |||||
| Receive free lunch | 47% | 55% | 68% | 18% | 18% |
| Perceived school safety | |||||
| Feeling “not safe at all” | 5% | 27% | 10% | 4% | 5% |
| Students' Perceptions of School Climate (ESB measure) | |||||
| Level of respect for students | 25 | 49 | 52 | 57 | |
| Very low | Average | Average | Moderately high | ||
| Safety of school environment | 55 | 46 | 58 | 65 | |
| Average | Average | Moderately high | High | ||
| Capacity for student influence on school | 41 | 60 | 65 | 53 | |
| Moderately low | Moderately high | High | Average | ||
| Attachment to school | 21 | 42 | 40 | 40 | |
| Very low | Moderately low | Moderately low | Moderately low | ||
| Social integration | 32 | 44 | 39 | 67 | |
| Very low | Moderately low | Low | Very high | ||
Although students’ perceptions of school climate are generally ordered according to the psychosocial maturity means, they are not consistently so. Differences in perceptions of school climate help explain why school A has significantly lower psychosocial maturity than school B despite identically low social class and perceived school safety. Students at school A report a very low level of respect and moderately low influence on the school compared to average respect and moderately high influence at school B.
Focus group data with the adolescents in these schools allowed a closer examination of differences in the social environments of the schools with high versus low psychosocial maturity. In both schools A and B, students reported a large amount of hostility, bullying, and harassment among peers and inconsistent school policies that were ineffective in helping students deal with these problems. However, although students in both schools expressed a lack of trust between students and teachers, students from school A, with the lowest mean Rel-Q score in the district, reported more extreme issues of disconnection between students and teachers than did students in school B.
In school A, students reported feeling unsafe in their school and expressed a general mistrust of the adult staff. Students described feeling disrespected, unprotected, and uncared for. Stories and comments regarding the teachers’ treatment of the students were offered without prompting throughout discussions that were intended to explore the students’ behaviors with their peers. In a focus group on bullying, students frequently shifted the focus from peer interactions to their perceptions of teachers bullying students.
In contrast, school D students seemed to have experienced teachers who listen to them and value their opinions. In this school, the few experiences of disrespect from teachers were related to a lack of listening or considering the students’ points of view, rather than harassment or threats, and reflect a school social order which emphasizes the value of listening to others. Consequently, the students in this school seem to have learned to value their peers’ perspectives. In the focus groups, school D students were particularly respectful of each other, taking turns to speak and commenting thoughtfully and respectfully on one another’s ideas. It is likely that these students’ higher psychosocial maturity was, at least in part, nurtured by the climate of respect and trust they have experienced in their school.
Discussion
The Nature of the Rel-Q Assessment
Despite the methodological constraints inherent in a multiple choice assessment of complicated interpersonal constructs, psychosocial maturity as measured by the Relationship Questionnaire shows a strong age-related progression across the upper elementary, middle school and high school years. This developmental component of the measure suggests that it assesses development from the perspective of emerging psychosocial competencies, in accord with its cognitive-developmental ancestry.
Because of the developmental nature of the Rel-Q assessment, the age of the subjects (or its proxy, grade level) is a salient factor in interpreting the meaning of the psychosocial maturity scores. Mean psychosocial maturity shows significant differences between fourth-, eighth-, and twelfth graders, with a .30 developmental level difference between fourth graders and eighth graders and the same size difference between eighth graders and twelfth graders in their choice of the “best” response to interpersonal issues. Children in the upper elementary through high school years appear to gain between a quarter and a third of a developmental level on average every four years on the Rel-Q, moving from a point between the unilateral and the reciprocal levels of perspective coordination to somewhere between the reciprocal and mutual levels. However, this growth with age is not uniform: although students changed significantly from fourth to sixth grade, there was no difference in psychosocial maturity levels between sixth and eighth grades, suggesting that growth in psychosocial maturity plateaus during the middle grade years before increasing again in high school.
The fourth through twelfth grade students in this study were generally making their way across the unilateral to reciprocal transition. Some older students were beginning the transition from reciprocal toward mutual strategies, using the third-person social perspective coordination that develops with formal operations in adolescence in their social relationships, particularly in their friendships. The age norms presented in Table 1 indicate when social perspective coordination capacities emerge rather than when they are commonly used in interpersonal understanding, negotiation, and meaning. Even young adults continue to fail to use their third-person perspective coordination capacities in their relationships, particularly when resolving difficult interpersonal conflicts, as found in a study of 24- to 26-year-olds using a qualitative Close Peer Relationship Interview based on the Relationship Framework (Schultz, Hauser, Selman, & Allen, 2004).
Although the developmental changes on the Rel-Q seem numerically small, they are significant both statistically and theoretically/substantively. LaRusso et al. (1999) identified quarter levels in subjects’ responses to hypothetical social conflict dilemmas, suggesting that small increments between each developmental level can be reliably identified in subjects’ responses and are psychosocially and theoretically significant. For example, the differences between a physical assault (0.25), a verbal attack (0.5), a suggestion of a verbal attack with some reflection or hesitancy (0.75), and unilateral strategies with an orientation toward power (1.0) are very meaningful in impulsive children. The unilateral to reciprocal transition is equally differentiated and discrete, from unilateral threats, defiance, or compliance (1.0), to unilateral strategies with an explanation of reasons (1.25), to reciprocal strategies in the service of asserting one’s perspective (1.5) to reciprocal strategies with an authoritative tone (1.75), to reciprocal strategies reflecting an orientation toward fairness (2.0). Similarly, the next transition involves incremental movement from cooperative strategies to compromising with an orientation toward the relationship (3.0).
Psychosocial maturity as measured by the Rel-Q was significantly correlated with another developmental measure, the Defining Issues Test, that measures moral judgment development according to Kohlberg’s (1969) stages, which are based on the same cognitive-developmental tradition as the social perspective coordination levels. The moderate effect size of the correlation of level of moral judgment with all five psychosocial competency scales suggests that the measures share a developmental orientation but assess separate constructs, supporting the Rel-Q’s validity.
The relatively low internal consistency reliabilities at the Rel-Q subscale level seem to speak more to the constructs being measured than to the Rel-Q’s measurement of the constructs. The high reliability of the overall score reflects the deep structure of social perspective coordination upon which the developmental levels of each of the psychosocial competencies (i.e., the subscales) are based; the lower reliability of the subscales reflects the contextual nature of these competencies, which theoretically are expected and empirically have been shown to vary across different interpersonal relationships and across different incidents or interactions within the same relationship. This interpretation is supported by the finding that the subscale of personal meaning awareness, which is theoretically the most contextual subscale, has the lowest internal consistency.
The small (though significant) relation between the Rel-Q and social skills measured by the SSRS suggests that the two measures assess quite different aspects of social development. The SSRS measures adult-centered appropriate behavior or social adjustment, as do most other instruments character education researchers use to tap social development constructs, including student self-reports, teacher ratings, and classroom observation scales. The Rel-Q assesses a related but quite different construct of developmentally-defined relationship capacity or psychosocial competence. Overton (1998) defines two types of change that help clarify how the Rel-Q differs from other social skill measures used to evaluate character education programs. The Rel-Q can assess transformational (formal) change, or qualitative change in form, pattern, or organization, whereas other social skill instruments measure only variational (functional) change, or the extent that what is changing varies from an assumed standard in a quantitative sense. The Rel-Q’s assessment of transformational change in social maturity provides a unique tool for evaluating programs that aim to promote character development rather than “better” behavior.
In addition to the considerable age-linked influence, there is also evidence that socialization influences the level of psychosocial maturity as measured by the Rel-Q. Girls scored significantly higher than boys on psychosocial maturity from fourth to twelfth grade, a gender difference consistent with an Icelandic study of adolescents that used the Rel-Q (Adalbjar-nardettir, 2002) and with other measures of social development, including most pencil-and-paper social skills measures (e.g., Gresham & Elliott, 1990; Highertower et al., 1986). Although there is some debate about whether some of this difference in girls’ and boys’ psychosocial maturity is to some extent innate, there is clear evidence that it is also partially, if not substantially, related to differential socialization (Maccoby, 1990, 1998). The tendency for boys to be discouraged from being emotionally expressive and intimate in their friendships and other close relationships has been associated with homophobia, an emphasis on competition between males, rigid stereotypes of masculinity, and a lack of expressive male role models (e.g., Benenson, 1996).
Other factors that are more clearly sociocultural in nature also contribute to the meaning of psychosocial maturity scores. The psychosocial maturity of students in sixth, eighth, and twelfth grade were significantly negatively correlated with fighting, criminal acts, carrying weapons to school, and cigarette and drug (especially alcohol) use. Adalbjarnardottir (2002) also found a negative association between psychosocial maturity measured with the Rel-Q and heavy drinking behavior. These negative relationships support the notion that a capacity for the expression of more mature relationship awareness is associated with less violence and drug use. That this negative association between psychosocial maturity and risk varies in magnitude across schools suggest that the relationship is mediated by other social and/or cultural factors. Negative risk-taking behavior was also associated with lower social class in this study.
Children and adolescents from families with higher social class, whether measured by free lunch participation or by father’s education, had higher psychosocial maturity than those from lower social class families. This finding conflicts with interview-based findings on interpersonal understanding that children from working class families score lower than middle-class children before early adolescence though there is no difference after about age 11 (Selman, 1980). Future studies should explore the relation between psychosocial maturity and social class further, since neither the dichotomous free-lunch participation variable nor the self-report of father’s education used in this study are particularly effective measures of SES.
Variation in psychosocial maturity across schools, both within and across districts, does not simply reflect individual and developmental differences among students or consistently parallel patterns attributable to differences in social class and risk behavior levels. Social climate data, assessed with both quantitative and qualitative means, identified differences in the “health” of the school social environments that help to explain differences in students’ psychosocial maturity across schools. The quantitative survey data on the school environment showed that differences in the social climate across schools paralleled differences in psychosocial maturity. The qualitative focus group data provided a richer view of student attitudes, beliefs, and perspectives that informs us about the “developmental basis” for students’ choices on the Rel-Q: when students report that their teachers don’t listen to them, tell them to shut up, and call them names, it is not surprising that they would have lower Rel-Q scores than their peers who describe more respectful relationships between teachers and students in their schools.
The multiple-choice methodology of the Rel-Q seems to be a valid assessment of psychosocial maturity in individuals and groups (if subjects attend to the task carefully). In addition to its value as a reliable and useful index of individual psychosocial maturity and development over time, the measure also seems to be sensitive to the effects of the social environment. Within the constraints of the age range in which each developmental level typically emerges, psychosocial maturity scores seem to reflect student differences in social perceptions among schools that may be attributed to differences in the social or moral atmosphere of those schools. Thus, psychosocial maturity scores are indicators of both the “relational health” of the schools and the “psychosocial competence patterns” of the individual students.
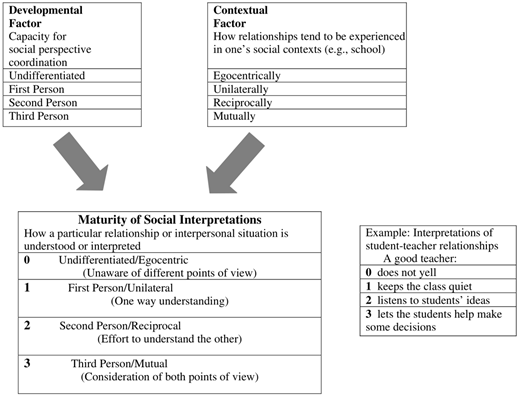
The Influence of Developmental and Contextual Factors on Social Maturity (LaRusso & Selman, 2003)
The Influence of Developmental and Contextual Factors on Social Maturity (LaRusso & Selman, 2003)
Figure 1 presents this interaction between developmental levels and social context. Developmental factors (left side of the figure), such as the capacity to engage in higher level perspective coordination, emerge with age; contextual factors (right side of the figure), such as school atmosphere, interact with the developmental competencies to determine the actual level at which individuals experience and interpret relationships and social situations in specific moments. For example, adolescents who have the capacity to take a “third-person” perspective may still interpret relationships as primarily unilateral if they have many one-way relationships or interact with others in what they perceive as an authoritarian environment (e.g., in which teachers actually do yell a lot). Thus, when students in a school have Rel-Q scores that are, on average, lower than typical for their grade, it may indicate that the school environment is not supporting the development of students’ most mature social interpretations as well as it could. An issue raised by this research is the dynamic behind the lower psychosocial maturity of students in schools with unhealthy social environments: do disrespectful school climates actually lower students’ psychosocial maturity or does students’ lower performance simply reflect what they observe and experience? Further research may clarify that both processes are at play.
The finding that higher developmental levels of personal meaning awareness predicted lower gaps between thought and action in this study has implications for both the practice and evaluation of character education programs. Selman’s (2003) qualitative study of the Voices of Love and Freedom program highlights this centrality of personal meaning in program effectiveness. Many school-based programs endeavor to promote ethical understanding and action; the meaning-oriented nature of the developmental theory underlying the Rel-Q suggests that character education programs will be effective to the extent that they engage students in meaningful ways.
Psychosocial maturity as indexed by the developmental levels of perspective coordination—from egocentric to unilateral to reciprocal and mutual levels—seems to be a major determinant of how children and adolescents treat others, understand and appreciate a diversity of perspectives, and communicate across socio-cultural differences. The Rel-Q charts shifts across these developmental levels, providing researchers and practitioners with an instrument to evaluate growth in students’ psychosocial maturity that can inform them about the extent to which the goals of transmitting social awareness and moral wisdom in the context of a particular school culture are realized.
This research was supported by grants from the Spencer Foundation, the Carnegie Corporation of New York, the W. T. Grant Foundation, and the Robert Wood Johnson Foundation. The authors would like to thank Dennis Barr and Patrick Walker for their involvement.
Notes
There is a fifth, higher level of social perspective coordination in each psychosocial competency that was not included in this instrument for two reasons: the complexity of the competencies at this developmental level are difficult to capture in a multiple-choice response and these levels develop in response to the life tasks of later adolescence and adulthood.
Moral reasoning was significantly correlated with all five Rel-Q psychosocial competencies, ranging from r = .38 for perspective coordination to r = .21 for interpersonal understanding and personal meaning. In contrast, the correlation with the SSRS social skills was significant only for the perspective coordination and real-life negotiation subscales.
The mean number of years of father’s education was significantly different in urban and suburban schools (t = 6.4, p < .0001), with fathers having 16.62 years of education in the suburban community schools and 14.39 years in the urban community schools, as reported by the students.
