


This article uses a measure of psychosocial maturity for children in kindergarten (age 5) through third grade (age 8)—the relationship questionnaire (Rel-Q)—to illustrate the growth of social competence in young children. Social competence on the Rel-Q is defined according to maturity levels of three psychosocial competencies—understanding about, skills in, and personal meaning of social relationships, which depend on the degree to which the social perspectives of self and other are coordinated. Results on the Rel-Q from 4,076 kindergarten, 1st, 2nd, and 3rd grade children from urban public school systems in 2 different geographic areas show strong developmental trends and gender differences: there were significant differences in mean level between each grade from kindergarten through 3rd grade, and, beginning in 2nd grade, girls consistently scored higher than boys. The Rel-Q also showed theoretically predicted associations with a teacher rating scale of social skills. Confirmatory factor analyses suggest that the hypothesized structure of the measure fit the data.
Social competence is a complex construct, and its assessment in children, especially young children, is challenging. Yet the assessment of social competence is crucial for prevention and intervention efforts in children at risk for—or already displaying—negative life outcomes (e.g, Selman, Watts, & Schultz, 1997; Weissberg, Caplan, & Sivo, 1989), as well as for character education in general (Selman, 2003). Deficits in social functioning, particularly with peers, are predictive of academic failure, antisocial behavior, and psychopathology in adolescence and adulthood (e.g., Cowen, Pederson, Babigian, Isso, & Tost, 1973; Gesten, Flores de Apodaca, Rains, Weissberg, & Cowen, 1979; Roff, Sells, & Golden, 1973; Rubin & Ross, 1982; Spivack, Platt, & Shure, 1976). Promoting competent, caring, and respectful social interaction is fundamental to effective character education programs (Berkowitz, 2002).
A number of researchers distinguish between social competence defined as (a) an integrative, summary, and more abstract construct (e.g., “effectiveness”) versus (b) specific skills or beliefs used to deal with social situations (e.g., Dodge, 1985; Rubin, Bukowski, & Parker, 1998; Weissberg, Caplan, & Sivo, 1989). Waters and Sroufe (1983) point out that the construct of social competence, with its intuitively abstract nature but discrete manifestations, presents problems for both conceptualization and assessment: if it is defined in terms of specific capacities or skills, the integrative potential of the concept is forfeited, yet the more molar definitions lack specific guidance for measurement. Waters and Sroufe suggest that a developmental perspective on social competence provides a way around this dilemma by “formulating assessment procedures [that] are specifically appropriate to each age period and, yet, retain common core features” (p. 84).
This article describes a measure of psychosocial maturity—the Relationship Questionnaire (Rel-Q)—designed to assess one developmental component of social competence that is useful for evaluating character education programs. The construct of psychosocial maturity used in the Rel-Q derives from developmental theory that identifies the social-cognitive capacity to differentiate and coordinate the social perspectives of self and other as central to character development and education (Selman, 2003; Selman & Schultz, 1990). The assessment of social skills and social competence tends almost without exception to be assessed by external observers’ ratings of social behavior, particularly for young children, rather than on the subject’s own expression of their social competencies. This has been due in part to the difficulty of developing valid methods for this kind of assessment, and in part to limitations of existing theoretical frameworks. This study, in presenting a measure of young children’s interpretation of social experience—the phenomenology of social competence or relationship awareness—addresses both those issues.
The picture-based version of the Rel-Q presented here, designed for children from kindergarten through third grade (the “K-3” version), complements a reading-based version for fourth through 12th graders (the “4-12” version), described in Schultz, Selman, and LaRusso (2003). The latter paper details the theoretical and methodological history of the two versions of the measure. This companion paper provides validation data for the “K-3” Rel-Q to illustrate how the emergence of social perspective coordination facilitates the growth of psychosocial maturity across the early elementary years.
The Relationship Framework
The Relationship Questionnaire’s assessment of psychosocial maturity based on social perspective coordination was developed within the cognitive-developmental research tradition (Kohlberg, 1981, 1984; Loevinger, 1966; Piaget, 1932/1965; Selman, 1980), influenced by these researchers’ intellectual predecessors in social theory (Baldwin, 1902, Dewey, 1933/ 1964; Mead, 1934) and by Werner’s (1948) orthogenetic theory. Selman and colleagues operationalized three related constructs in a set of research methods and instruments (including reflective individual interviews, manual-based scoring systems, and observations of social interactions) to develop a “Relationship Framework” during a 30-year research program. The premise of this framework is that social competence ultimately rests on the capacity for forming close relationships with other people, and that capacity in turn is grounded in psychosocial maturity, an internal psychological development. Furthermore, to the extent that persons lack the capacity to coordinate social perspectives, which underlies this construct of psychosocial maturity, they will be more likely to engage in risky and/ or antisocial behavior. Psychosocial maturity as measured in the “4-12” Rel-Q has consistently shown negative associations with risk-taking behaviors such as fighting, alcohol and drug use, and criminal activity in older children and adolescents (Adalbjarnardottir, 2002; Schultz, Barr, & Selman, 2001; Schultz, Selman, & LaRusso, 2003).
This model of relationship awareness includes three social-cognitive constructs: (1) interpersonal understanding, the theoretical knowledge of the nature of relationships (Selman, 1979, 1980), (2) interpersonal skills, including both interpersonal negotiation strategies (needed to resolve conflict in order to make and maintain good relationships) and shared experience or relatedness skills (Selman & Schultz, 1990), and (3) awareness of the personal meaning of relationships, the intensity and quality of the emotional investment an individual is able to make in specific other persons (Levitt & Selman, 1993). Although the three social-cognitive constructs in the Relationship Framework share the developmental substructure of capacity for social perspective coordination, these competencies tap distinct aspects of psychosocial functioning. For example, the constructs of interpersonal negotiation and personal meaning awareness are more affect-laden and contextual than the more strictly cognitive interpersonal understanding construct.
The three psychosocial competencies develop along parallel tracks from immature (undifferentiated) to mature (differentiated and integrated) levels. Table 1 presents the Relationship Framework, showing how the levels of social perspective coordination provide the developmental foundation of the psychosocial competencies.1 The age progression in the emergence of social perspective coordination, which maps onto structural-developmental assessments in the cognitive and moral domains, was established through the assessment of psychosocial maturity with probed hypothetical social dilemmas (cf. Selman, 1980).
This developmental approach accommodates different levels of maturity in each of the three psychosocial competencies at a given point in time and/or across contexts. A key underlying assumption of the relationship model is that persons do not consistently reason or act at the same developmental level in different interpersonal contexts; even within a single incident or context the developmental level of action strategies may cover a wide range (Fischer & Bidell, 1998), and these performance levels are often not consistent with the highest level of social operations in the person’s repertoire (competence). The mapping of gaps between competence and performance provides a contextual dimension to this theory of social competence, distinct from its historical origins in the structural-developmental work of Piaget (1983) and Kohlberg (1969). In this sense the approach is heavily influenced by Werner’s (1948) classic view of comparative mental development. Although individuals can function at different levels in the three psychosocial competencies in different contexts, mature psychosocial capacity is reflected in social functioning in an integrative way (i.e., without gaps) at higher levels, when functionally appropriate.
Developmental Levels in the Relationship Framework: The Case of Friendship
| Interpersonal Skills | ||||||
|---|---|---|---|---|---|---|
| Level | Social Perspective Coordination | Agea | Interpersonal Understanding | Personal Meaning | Interpersonal Negotiation Strategies | Shared Experience |
| 0 | egocentric | 3-5 | undifferentiated | dismissive | impulsive | enmeshed or situation-based |
| 1 | one-way unreflective | 6-7 | differentiated | impersonal | unilateral | action-based |
| 2 | reciprocal | 7-8 | reflective | personal rule-based | cooperative | feeling-based |
| 3 | mutual | 12-14 | third-person | need-based (isolated) | compromise | identity-based and empathic |
| 4 | interdependent | 15-18 | intersubjective/societal-symbolic | need-based (integrated) | collaborative | boundary-based |
aAge when capacity emerges normatively.
Research Questions
A study of the “4-12” version of the Rel-Q that explored its usefulness as a tool for evaluating school-based character education programs (Schultz, Selman, & LaRusso, 2003) found significant developmental change on mean psychosocial maturity across grades 4 through 12 (with the exception of a plateau across the middle school grades). The Rel-Q also showed sensitivity to group differences based on differential socialization: girls scored significantly higher than boys at each grade level, and there were also with significant differences among students of different social classes and among those reporting different levels of negative risk-taking behavior. Quantitative and qualitative data on social climate predicted differences in mean psychosocial maturity between schools. These findings led to the following research questions with regard to the picture-based version of the Rel-Q for grades kindergarten through third grade:
What are the psychometric properties of the K-3 Rel-Q?
It is expected that psychosocial maturity or relationship awareness as measured by the Rel-Q will show significant developmental differences from kindergarten through third grade, both cross-sectionally and longitudinally, supporting the measure’s validity. This age progression is expected to be similar in both geographically diverse samples. Gender differences in psychosocial maturity in this age range will also be examined, and differences among the individual psychosocial competencies (i.e., the Rel-Q subscales) will be explored.
What is the relation between the K-3 Rel-Q and teacher ratings of social skills?
Psychosocial maturity is expected to be positively related to teacher ratings of students’ prosocial behaviors and negatively related to teacher ratings of problem behaviors. However, the effect size of these associations will likely be quite modest, since the ratings are not developmentally based.
Will the K-3 Rel-Q data fit the hypothesized structure of the measure, with three subscales and a general factor of psychosocial maturity or relationship awareness?
A hierarchical confirmatory factor analysis will be conducted to examine this question.
Method
Subjects
This study used data derived from a classroom-based administration of the Rel-Q to children from kindergarten through third grade in two urban public school systems that were participating in character education and prevention programs.2 Subjects from one Northeastern U.S. city, which totaled 2,046, including 62 kindergartners (age 5), 796 first graders (age 6), 784 second graders (age 7), and 404 third graders (age 8) from nine public schools, were tested in the fall of the school year. This sample was approximately half male and half female. A subsample of 200 first graders, 311 second graders, and 176 third graders in these schools in comparison classrooms not participating in the intervention were tested again in the spring, and this group was used in longitudinal (change score) analyses. This sample was 53% Black, 11% White, 5% Asian, and 31% Hispanic children. Seventy-four percent of the students were eligible to receive free or reduced-price meals.
A second sample from a Southern U.S. city was included to explore the representativeness of the Northeast sample. This sample of 2,030 students included a larger sample of kindergartners (475), 591 first graders (age 6), 445 second graders (age 7), and 519 third graders (age 8) from 6 public schools, tested in January of the school year. The gender of the subjects was not available for this sample. This sample was composed of 87% Black, 9% White, and 4% other races/nationalities. Eighty-seven percent of the students were eligible to receive free or reduced-price meals. As indicated by the free or reduced-price meal percentages, both samples consisted of relatively low social class populations.
The Rel-Q data reported were collected as part of program evaluations. In the Northeastern sample, although all students in the intervention classrooms participated in the character education programs, consent was required for participation in the evaluation. Written consent was obtained from parents and guardians through letters sent home and collected by their teachers. Only students who returned written permission sheets participated in the study; the participation rate ranged from 82% to 100%, with an average participation of 93%.3 All students in the Southern sample participated in the evaluation since the school system considered the questionnaire administration part of the program.
Teacher Rating of Social Skills
For part of the Northeastern sample (n = 393), teachers rated students’ social skills with the Teacher-Child Rating Scale (T-CRS) in both the fall and spring of the school year. The T-CRS (Hightower et al., 1986) was developed from two longer social skills scales, the Health Resource Inventory (Gesten, 1976) and Classroom Adjustment Rating Scale (Lorion, Cowen, & Caldwell, 1975) that were shown to have some psychometric shortcomings (Weissberg et al., 1987). The T-CRS instrument (Hightower et al., 1986) includes three problem scales (acting out, shy anxious, and learning difficulties) and three competence scales (educational task orientation, assertive social skills, and frustration tolerance). The three problem scales are derived from 18 items (e.g., “Is disruptive in class”) that teachers rate from 1 (not a problem) to 5 (very serious problem), and the three competence scales are derived from 20 items (e.g., “Is friendly toward peers”) that teachers rate as describing students from 1 (not at all) to 5 (very well). A validation study of the T-CRS showed high internal consistency (alphas ranging from .85 to .95), 10- and 20-week test-retest coefficients ranging from .61 to .91 with a median of .83, an ability to discriminate groups known to differ in adjustment, and convergent and divergent validity with other measures of child adjustment and performance in children from kindergarten through sixth grade.
The Relationship Questionnaire
Structure of the Rel-Q
The Relationship Questionnaire is a multiple-choice instrument that assesses the developmental level of the interpersonal competencies in the Relationship Framework. The measure focuses on relationships with both peers (friends and peer group acquaintances) and adults (parents and teachers). One version of the Rel-Q, like the majority of child self-report questionnaires, requires third to fourth-grade reading skills, and is appropriate for fourth grade through high school grade (the “4-12” version, Schultz, Selman, & LaRusso, 2003). The second version, which is the focus of this study, uses verbal instructions and pictures of animals instead of words and was specifically developed for younger children from kindergarten to third grade (the “K-3” version). The two conceptually similar, though empirically separate, versions have different questions with different multiple-choice responses, but are parallel in structure and based on the same constructs from the Relationship Framework.
The instruments were developed with data from qualitative interviews assessing interpersonal negotiation strategies and interpersonal understanding. Item prompts were constructed from the interview dilemmas, and multiple choice responses to these prompts representing different developmental levels were selected from actual subject answers.
Each multiple-choice response to the questions (or items) in the Rel-Q represents a particular developmental level of social perspective coordination in the domain (or scale) represented by the item. The two versions differ on the developmental range of the four responses to each item: whereas those on the “4-12” version range from impulsive to mutual, those on the “K-3” version range from impulsive to either reciprocal or in between reciprocal and mutual (see Table 1). The lower ceiling of the K-3 Rel-Q reflects the less complex social-cognitive capacities and social awareness of children who are transitioning from early to middle childhood.
The K-3 Rel-Q includes the following three scales, each with three items: interpersonal understanding of relationships, hypothetical interpersonal negotiation, and social perspective coordination. This picture-based version of the Rel-Q does not measure all three psychosocial competencies in the relationship model: there is no personal meaning awareness scale, in this version, though there is in the 4-12 Rel-Q.4 The K-3 Rel-Q has fewer subscales for related developmental reasons (the psychosocial competencies are less differentiated in early elementary children, partly because of their less developed cognitive ability, and the typical social problems that children of this age face tend to be less complex) as well as for methodological reasons (the animal picture-based format is less flexible than the written multiple-choice format).
The following are definitions and examples of items for the three Rel-Q scales on the K-3 version.
Interpersonal Understanding. Interpersonal understanding is defined as what the developing individual reflectively understands to be the core psychological and social qualities of persons and their relationships (Selman, 1980). Relationship understanding involves a child’s developing theoretical understanding of matters such as what goes into forming relationships or the conceptions of trust and jealousy in a close relationship, as distinct from the actions (strategies) that might be taken in the service of a relationship, the know-how of forming and maintaining a relationship. The following is one of the three interpersonal understanding items on the Rel-Q:
Who Can Lion Trust?
It was Lion’s first day at a new school. Lion wants to know whom he can trust to be his friend at the new school.
Elephant says, “You can trust me, Lion, because I will always do what you tell me to do.”
Horse says, “You can trust me, Lion, because I will always sit next to you in school.”
Zebra says, “You can trust me, Lion, because I will never tell your secrets.”
Tiger says, “You can trust me, Lion, because I will give you presents.”
These four responses range from egocentric understanding (Horse saying he will always sit next to Lion in school) to a unilateral (first-person) understanding (Tiger giving Lion presents) to a response that is part unilateral, part reciprocal understanding (Elephant offering to always do what Lion tells him to do) to a fully reciprocal (second-person) understanding (Zebra saying he will never tell Lion’s secrets).
Interpersonal Negotiation. The developmental levels of interpersonal negotiation are also based on the core operation of social perspective coordination as we observe how a person resolves conflict with others in certain ways that indicate the extent to which the perspectives of self and other are taken into account and coordinated (Beardslee, Schultz, & Selman, 1987; Selman, Beardslee, Schultz, Krupa, & Podorefsky, 1986; Yeates, Schultz, & Selman, 1991). The autonomy-oriented interactions of interpersonal negotiation strategies are defined as the ways in which persons in situations of social conflict deal with the self and another person to gain control over inner and interpersonal disequilibrium. The following example is one of the three negotiation items on the Rel-Q that ask children to respond to a common early elementary peer conflicts:
Bunny Cuts in Line
It was time for lunch and everyone was hungry. The teacher said, “Line up for lunch!” When Bunny got to the line, she cut in line in front of other students.
Donkey pushed Bunny back out of line.
Dove told the teacher.
Lion called Bunny a cheater.
Turtle told Bunny that cutting in line is not fair.
The four responses here range from impulsive negotiation (Donkey pushing Bunny back out of line) to unilateral negotiation (Lion calling Bunny a cheater) to a transitional part unilateral, part reciprocal negotiation (Dove telling the teacher) to a reciprocal negotiation (Turtle telling Bunny that cutting in line is not fair).
Social Perspective Taking. Whereas interpersonal understanding items reflect the task of applying social perspective coordination to conceptualize relationships, and interpersonal negotiation items ask subjects to apply perspective coordination in the skill of responding to situations of social conflict, the social perspective taking items elicit a more pure social perspective coordination operation in response to a social problem involving multiple (though not conflicting) perspectives. These items tap operations that are similar to those of the social problem-solving research tradition (e.g., Spivak, Platt, & Shure, 1976). The following is one of the three perspective taking items on the Rel-Q:
Wolf’s Lost Teddy Bear
All of Wolf’s friends had been thinking about what to get Wolf for her birthday. Then, the day before her birthday party, Wolf lost her very favorite teddy bear. When she found out it was lost, she cried and said to her friends “Nothing can ever replace my teddy bear!” After that, all of Wolf’s friends talked about what to get Wolf for her birthday.
Polar Bear decided to get Wolf a puzzle because Wolf had said she didn’t want another teddy bear.
Buffalo decided to get Wolf a new teddy bear because Wolf didn’t really mean it when she said nothing could replace it.
Seal thought Wolf’s parents would know what she really wants for her birthday, so Seal will ask them what to get her.
Gorilla decided to get Wolf a hand puppet because Gorilla really likes puppets.
These four responses range from egocentric perspective taking (Gorilla decided to get Wolf a hand puppet because Gorilla likes puppets) to one-way perspective taking (Polar Bear getting Wolf a puzzle because she interpreted Wolf’s comment to mean that she didn’t want another Teddy Bear) to a transitional part one-way, part second person response (Buffalo) to second-person perspective taking (Seal thought Wolf’s parents would know what she would want and deciding to ask them for a suggestion).
Innovation in the Multiple-choice Methodology
For each question (or item), there are four multiple-choice responses, each of which represents a particular level in the coordination of social perspectives. Unlike a typical multiple-choice questionnaire, Rel-Q subjects are asked not only to choose the “best” response, but also to rate each response as “poor,” “OK,” “good” or “excellent.” The combination of subjects rating each response and the use of pictures of animals results in a method of assessing the social competence capacity of younger children in a way that minimizes the impediments of their limited conceptual and literacy abilities. The process of successively rating each response breaks the task down for young children so that they are better prepared to pick their “best choice.” The methodology also adds four additional pieces of data per item, enhancing the psychometric properties of the measure. This multiple-rating method was key in solving problems inherent in the task of translating a complex qualitative/quantitative interview methodology to a more purely quantitative questionnaire one.
Consider a 6-year-old child’s responses to the interpersonal negotiation question presented above. Figure 1 shows the picture-based answer sheet filled out by a child named Jenny for the Bunny Cuts in Line item presented earlier. As each of the four responses is read in turn, the children are asked to circle (or color in) one of the faces representing respectively a “bad” way to deal with Bunny’s cutting in line (frowning face), an “OK” way (neutral face), a “good” way (smiling face), or an “excellent” way (smiling face with star). Note that this response rating is not a forced choice in which subjects have to designate one response as poor, a second one as average, a third as good, and a fourth as excellent. Rather, subjects choose any response rating (bad, OK, good, excellent) for each of the four responses within the question. Jenny, for example, rated two responses as bad (b and c), one as excellent, one as good, and no response as average (OK). Finally, the children are asked to “Look at the row with all the animals in it at the bottom of the page. Circle the animal that did the best thing when Bunny cut the line,” and the four choices are read again (the meaning of “best” is left to the subject). Jenny chose response “d” (Turtle) as his best choice. This “best choice” operation is a forced choice similar to typical multiple-choice methodology.
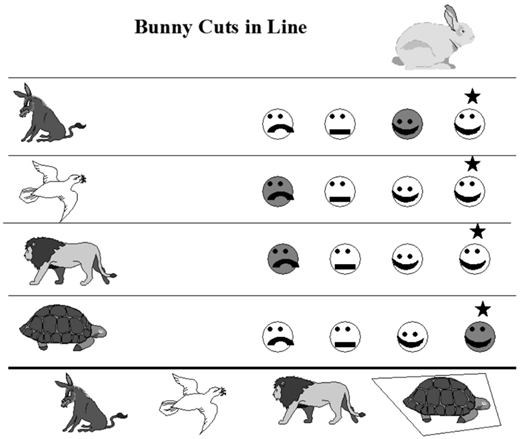
The Picture-based Scoring Sheet for the Item “Bunny Cuts in Line” from the K-3 Relationship Questionnaire as Filled Out by 6-year-old Jenny
The Picture-based Scoring Sheet for the Item “Bunny Cuts in Line” from the K-3 Relationship Questionnaire as Filled Out by 6-year-old Jenny
Scoring of the Rel-Q
The Rel-Q yields two scores for each scale: a “response-rating” score, based on the children’s separate ratings of each of the four multiple choice responses, and a “best-choice” score, based on which response of the four they choose as “best.”
The scoring guide presents the following information for item 4, Bunny Cuts in Line:
4. Bunny Cuts in Line (interpersonal negotiation/conflict resolution)
| Best-choice scores | Response-rating scores | |||
|---|---|---|---|---|
| Level | Poor | Average | Good | Excellent |
| a. 0 - Egocentric | 2 | 1.5 | 1 | 0 |
| b. 1.5 - Between 1 & 2 | 1 | 1.5 | 2 | 1.5 |
| c. 1 - One-way | 1.5 | 2 | 1.5 | 1 |
| d. 2 - Reciprocal | 0 | 1 | 1.5 | 2 |
The numbers in bold to the right of each multiple choice response (letters a, b, c, d) represent the developmental level assigned to the response based on previous theoretical and empirical analysis of subjects’ responses to interpersonal negotiation dilemmas (Schultz, Yeates, & Selman, 1988; Selman & Schultz, 1990). In this item, as in all the items, the responses are not in developmental level order but rather are ordered randomly. The developmental level of the response a child chooses as “best” is the score assigned as the “best-choice” score for each question. The scoring guide also presents the level scores to be assigned for each multiple-choice response subjects rate on the Likert scale of poor (or bad), average (or OK), good, or excellent. The corresponding number in the table is the level assigned for that particular response rating.
Jenny’s choices for Bunny Cuts in Line will serve as an example to illustrate the scoring process. She selected the reciprocal response “d” as the best, so her “best-choice” score would be 2.0 for this item. Jenny’s rating of the egocentric response 4a as “good” overrated it (by our standards) and is given a score of 1, her rating of the unilateral/reciprocal response 4b as “poor” underrated the item and also receives a score of 1, her rating of the unilateral response 4c as “poor” underrated the response somewhat and is given a score of 1.5, and her rating of the reciprocal item 4d as “excellent” reflects good judgment in our system and is given a score of 2. Jenny’s response-rating score for item 4 is 1.38, computed by summing the four level scores and dividing by 4: (1 + 1 + 1.5 + 2) divided by 4, which equals 5.5 divided by 4. Note that if a subject fails to rate all four choices or responses, the rated responses are summed and divided by the number of ratings the child did make (i.e., 3, 2 or 1) to compute the response-rating score.
Figure 2 presents a four-by-four table showing how these level scores were derived. Scoring items rated from poor to excellent involves giving credit for the extent to which subjects recognize the maturity or immaturity of a given item. The amount of credit subjects get for a given response rating is based on the range of developmental levels in the item.5 For this item (question 4, Bunny Cuts in Line), the response levels range from Level 0 to Level 2. In this case, subjects are given a response-rating score of 2 when they rate the responses exactly according to perspective coordination theory, corresponding to the diagonal in Figure 2. Thus, a score of 2 is given for a particular rating when level 0 responses are rated as poor, level 1 responses as average, level 1.5 responses as good, and level 2 responses as excellent (e.g., Jenny’s rating of 4d). When a rating falls off the diagonal by 1 box, the response has been somewhat overrated or underrated (e.g., Jenny’s rating of 3c, which was a level 1 response, as poor), and it is given a response score of 1.5. If a rating is off the diagonal by 2 boxes, which is even more of an underrating or overrating (e.g., Jenny’s rating 3a, which was a level 0 response, as good), the subject receives a response score of 1. Finally, if a level 0 response is highly overrated as excellent or a level 2 response is highly underrated as poor, the response score is 0. As described earlier for Jenny’s choices, the response-rating score for a given question is the sum of the individual response scores divided by the number of response ratings.
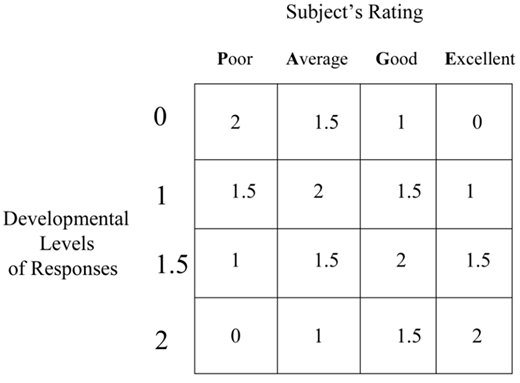
The Scoring Algorithm for the Response-rating Scale on the Relationship Questionnaire
The Scoring Algorithm for the Response-rating Scale on the Relationship Questionnaire
“Best-choice” scores for each of the three subscales (social perspective coordination, interpersonal understanding, and interpersonal negotiation) are computed by averaging the best-choice scores for each of the three items in that domain. Similarly, the three “response-rating” subscale scores are computed by averaging the three response-rating scores in a given subscale domain. The overall best-choice and response-rating scores, which represent two alternative ways to measure psychosocial maturity, are computed by averaging the three respective subscale scores. Because the best-choice and response-rating scores each have a developmental level metric (though the response-rating developmental level derivation is much less direct and obvious that that of the best-choice scores), the two scores can be averaged into an overall composite score. Descriptive statistics for all three scores—the best choice, response rating, and composite—are reported here, though the statistical analyses were conducted on the composite score only.
Results
Research Question 1. What are the Psychometric Properties of the Rel-Q?
Table 2 presents Cronbach alphas for overall psychosocial maturity and the three subscales for both samples. The alpha for the composite form of overall psychosocial maturity was .75 in both samples, indicating moderately high internal consistency. The response-rating alpha was somewhat lower (.66 in both samples), and that of the best choice was much lower (.48 in one sample and .51 in the other), indicating only moderate internal consistency. The internal consistency scores for the subscales were very much lower, with alphas ranging from .70 to .53 for the composite score, from .62 to .32 for the response-rating score, and from .36 to .11 for the best-choice score. Of the three subscales, the interpersonal understanding scale had the strongest alphas. The alphas were very consistent across the two samples for each scale.
Estimated Cronbach Alphas for Psychosocial Maturity in the Two Samples
| Rel-Q Scales | Northeastern U.S. Sample (N = 2,046) Alpha | Southern U.S. Sample (N = 2,030) Alpha |
|---|---|---|
| Psychosocial maturity | ||
| Composite | .75 | .75 |
| Best choice | .48 | .51 |
| Response rating | .66 | .66 |
| Subscales | ||
| Perspective taking | ||
| Composite | .53 | .53 |
| Best choice | .11 | .18 |
| Response rating | .41 | .37 |
| Interpersonal understanding | ||
| Composite | .70 | .63 |
| Best choice | .33 | .31 |
| Response rating | .62 | .55 |
| Interpersonal negotiation | ||
| Composite | .61 | .59 |
| Best choice | .33 | .36 |
| Response rating | .32 | .39 |
Table 3 presents ANOVAs across grades and gender for the Northeastern sample and across grades only for the Southern sample (for which gender was not available), using the composite Rel-Q score. The ANOVA for the Northeastern sample, which was conducted on the spring administration of the Rel-Q at each grade level, indicated significant grade effects from early spring of kindergarten through the end of third grade for psychosocial maturity and all three Rel-Q subscales. The F statistics for gender, which represent the effect of gender controlling for age (gender differences at each age), indicated that significant differences between girls and boys on psychosocial maturity and each subscale, with the largest gender difference in interpersonal negotiation and the smallest, though still significant, gender difference in perspective taking. There were no interactions between grade and gender. In the Southern sample ANOVA, grade also significantly predicted psychosocial maturity and each subscale at the p < .001. level. For both samples, the grade effect was especially large for interpersonal understanding.
Table 4 presents means and standard deviations for psychosocial maturity and the three subscales (using the composite score) at seven time points (both cross-sectional and longitudinal) from early spring of kindergarten through the end of third grade for the Northeastern sample and at each of the four (cross-sectional) grade levels for the Southern sample. The mean psychosocial maturity score rises progressively across these grades, from 1.32 in kindergarten to 1.68 in the spring of third grade.
Table 5 shows Scheffe multiple comparison tests conducted with ANOVAs on these composite scores to pinpoint where across the cross-sectional and longitudinal testing points the significant grade effects occurred. In the Northeastern sample, although there was no difference across the third grade year for psychosocial maturity, there were significant differences between each of the other consecutive testing points, with the exception of the short intervals (the summers) between school years (i.e., between the end of first grade and the beginning of second grade and between the end of second grade and the beginning of third grade). That is, the Rel-Q measured significant differences in psychosocial maturity between early spring of kindergarten and fall of first grade, across first grade, and across second grade. The pattern was the same for the subscales except there was not significant change from early spring of kindergarten to fall of first grade for interpersonal understanding and perspective taking, across first grade for perspective taking, and across second grade for interpersonal negotiation. Thus, the multiple comparisons for this sample suggest that growth in these psychosocial competencies is most robust across kindergarten, and first, and second grade but seems to slow in third grade, perhaps reflecting some ceiling effect. Even so, the grade effects are consistently significant across the first half of this period (kindergarten through fall of grade 2) and the second half (fall of grade 2 through spring of grade 3).
ANOVAs across Grade Levels and Gender for K-3 Rel-Q Composite Scales
| Northeastern Sample | |||||||
|---|---|---|---|---|---|---|---|
| Dependent Measures: | Model | Predictors | |||||
| Rel-Q Scales | df | R2 | F | p | F | P | |
| Psychosocial maturity | 5,1270 | .21 | 69.4 | *** | Grade | 106.1 | *** |
| Gender | 27.3 | *** | |||||
| Grade X Gender | 1.2 | ns | |||||
| Perspective taking | 5,1261 | .06 | 17.0 | *** | Grade | 24.4 | *** |
| Gender | 5.3 | * | |||||
| Grade X Gender | 0.3 | ns | |||||
| Interpersonal understanding | 5,1266 | .23 | 74.4 | *** | Grade | 119.2 | *** |
| Gender | 12.1 | ns | |||||
| Grade X Gender | 2.4 | ns | |||||
| Interpersonal negotiation | 5,1269 | .09 | 24.9 | *** | Grade | 33.0 | *** |
| Gender | 25.6 | *** | |||||
| Grade X Gender | 0.0 | ns | |||||
| Southern Sample | ||||||
|---|---|---|---|---|---|---|
| Dependent Measures: | Model | Predictor | ||||
| Rel-Q Scales | df | R2 | F | P | ||
| Psychosocial maturity | 2,2026 | .25 | Grade | 229.3 | *** | |
| Interpersonal understanding | 2,2026 | .20 | Grade | 170.5 | *** | |
| Interpersonal negotiation | 2,2026 | .10 | Grade | 76.9 | *** | |
| Perspective taking | 2,2025 | .13 | Grade | 95.1 | *** | |
In the Northeastern sample, the kindergartners were tested in late winter/early spring, the other grades in late spring. In the Southern sample, all grades were tested in January of the school year. Gender was not available for this sample. ns = nonsignificant;
* p < .05;
*** p < .001.
Means and Standard Deviations for Psychosocial Maturitya across the Two Samples by Grade Level
| Subscales | |||||||||
|---|---|---|---|---|---|---|---|---|---|
| Sample | Grade | Time of Year | n | Psychosocial maturity | PersPective Taking | Understanding | InterPersonal Negotiation | ||
| S | K | Jan. | 475 | 1.38 (0.19) | 1.40 (0.28) | 1.36 (0.26) | 1.39 (0.27) | ||
| NE | Feb. | 62 | 1.32 (0.18) | 1.43 (0.30) | 1.28 (0.29) | 1.27 (0.32) | |||
| NE | 1 | fall | 278 | 1.43 (0.18) | 1.49 (0.26) | 1.38 (0.27) | 1.42 (0.27) | ||
| S | Jan. | 591 | 1.43 (0.17) | 1.43 (0.26) | 1.42 (0.25) | 1.42 (0.24) | |||
| NE | spring | 518 | 1.52 (0.18) | 1.55 (0.25) | 1.49 (0.26) | 1.49 (0.26) | |||
| NE | 2 | fall | 358 | 1.53 (0.17) | 1.56 (0.25) | 1.52 (0.25) | 1.50 (0.22) | ||
| S | Jan. | 445 | 1.55 (0.16) | 1.56 (0.26) | 1.53 (0.26) | 1.55 (0.20) | |||
| NE | spring | 426 | 1.62 (0.17) | 1.65 (0.24) | 1.65 (0.25) | 1.55 (0.24) | |||
| NE | 3 | fall | 116 | 1.63 (0.17) | 1.64 (0.26) | 1.68 (0.26) | 1.58 (0.23) | ||
| S | Jan. | 519 | 1.64 (0.17) | 1.64 (0.25) | 1.68 (0.23) | 1.60 (0.21) | |||
| NE | spring | 288 | 1.68 (0.18) | 1.67 (0.28) | 1.78 (0.24) | 1.60 (0.24) | |||
Standard deviations are in parentheses next to the means. aComposite Rel-Q scores.
In the Southern sample, there was significant cross-sectional change across all three years for overall psychosocial maturity and the interpersonal understanding subscale, indicating that children develop on these competencies from kindergarten to first grade, from first to second grade, and from second to third grade. There was also significant change across first and second grades for interpersonal negotiation and perspective taking, and although the change from kindergarten to first grade was not significant on the composite score for these competencies, it was significant for the best-choice score for interpersonal negotiation and for the response-rating score for perspective taking. Thus, in the Southern sample growth in psychosocial maturity was relatively steady from the middle of the kindergarten year through the middle of third grade.
Table 6 shows the means broken out by gender for the overall score and subscale scores across the seven (cross-sectional and longitudinal) time points from kindergarten through third grade for the Northeastern sample, showing that girls scored significantly higher than boys across these ages. To further explore the gender differences found in the ANOVA analyses, t tests were conducted on each set of scores and gender differences that were significant or approaching significance are indicated with the appropriate symbol. Consistent gender differences began appearing at the end of grade 1 in overall psychosocial maturity and interpersonal negotiation, and became markedly robust by the end of second grade, continuing through third grade.5 In each case, girls scored at higher developmental levels than boys. In the spring of second grade (when the sample size was much larger than in third grade and thus smaller size differences become significant), there were gender differences on each subscale.
Scheffe Multiple Comparisons for Grade Level Effects on K-3 Relationship Questionnaire Scales
| Dependent Measures | Consecutive Testing Points | First and Second Half of Age Range | ||||||
|---|---|---|---|---|---|---|---|---|
| Northeastern Sample: | Ks→1f | 1f→1s | 1s→2f | 2f→2s | 2s→3f | 3f→3s | Ks→2f | 2f→3s |
| Psychosocial maturity | * | * | ns | * | ns | ns | * | * |
| Perspective taking | ns | ns | ns | * | ns | ns | * | * |
| Interpersonal understanding | ns | * | ns | * | ns | ns | * | * |
| Interpersonal negotiation | * | * | ns | ns | ns | ns | * | * |
| Southern Sample: | K→1 | 1→2 | 2→3 | |||||
| Psychosocial maturity | * | * | * | |||||
| Perspective taking | ns | * | * | |||||
| Interpersonal understanding | * | * | * | |||||
| Interpersonal negotiation | ns | * | * | |||||
ns = nonsig1nificant; *p < .05
Means of the K-3 Relationship Questionnaire Scales for Males and Females across Grade Levels in US Northeast
| Rel-Q Scales | Kindergarten | Grade 1 | Grade 2 | Grade 3 | ||||||||||
|---|---|---|---|---|---|---|---|---|---|---|---|---|---|---|
| Springa (n = 62) | Fall (n = 273) | Spring (n = 509) | Fall (n = 350) | Spring (n = 418) | Fall (n=102) | Spring (n = 288) | ||||||||
| Females | Males | Females | Males | Females | Males | Females | Males | Females | Males | Females | Males | Females | Males | |
| Psychosocial maturity | 1.35 | 1.30 | 1.44 | 1.43 | 1.54 | 1.51- | 1.55 | 1.51* | 1.65 | 1.58*** | 1.66 | 1.61+ | 1.71 | 1.66* |
| Perspective taking | 1.44 | 1.43 | 1.51 | 1.46 | 1.55 | 1.54 | 1.57 | 1.56 | 1.69 | 1.61** | 1.64 | 1.66 | 1.68 | 1.66 |
| Interpersonal understanding | 1.27 | 1.28 | 1.39 | 1.38 | 1.51 | 1.48 | 1.56 | 1.49* | 1.68 | 1.62** | 1.71 | 1.65 | 1.82 | 1.74** |
| Interpersonal negotiation | 1.36 | 1.21- | 1.42 | 1.42 | 1.56 | 1.51* | 1.52 | 1.50 | 1.60 | 1.51*** | 1.65 | 1.52** | 1.64 | 1.57* |
aThe kindergartners were tested in late winter/early spring. The spring testing in the other grades was in late spring.
+p < .15;
~ p < .10;
* p < .05;
** p < .01;
*** p < .001
Table 7 presents change scores for the Rel-Q scales across school years for the longitudinal portion of the Northeastern sample, along with t statistics from paired t tests indicating their significance. The whole sample showed significant change across the year on the overall psychosocial maturity scale as well as on all three subscales. The first, second, and third graders, when examined separately, each showed significant change on the overall scores and on the subscale scores. In each case change was largest for the interpersonal understanding subscale and lowest, though still significant, for the interpersonal negotiation subscale. This pattern supports the validity of the developmental properties of the measure, and suggests that the K-3 Rel-Q is sensitive to psychosocial growth across these early elementary years.
Research Question 2. What is the relation between the Rel-Q and Teacher Ratings of Social Skills?
Also shown in Table 7, the teachers observed little change across the year in the nondevelopmental Teacher-Child Rating Scale variables (though the first-grade teachers reported a significant decrease in two problem scales, the shy/anxious and learning problem scales). Table 8 compares the Rel-Q and Teacher-Child Rating Scale (T-CRS) in both fall and spring assessments for a subsample of second graders in the Northeastern sample. The correlations between psychosocial maturity and the prosocial T-CRS scales (easy-going behavior, assertive social skills, and task orientation) are consistently positive and significant, and those between psychosocial maturity and the teacher-rated problem behaviors (acting out, shy/anxious, and learning problems) are consistently negative and significant. These significant correlations, however, are at a small effect size (t’s ranging from an absolute value of .13 to .27). The modest size of these correlations between the K-3 Rel-Q and the T-CRS supports the conclusion that the Relationship Questionnaire seems to measure a related but quite different construct of social competence than that of the T-CRS, suggesting that phenomenological psychosocial maturity (or relationship awareness) is distinct from the types of social skills traditionally assessed as observed social competence.
Estimated Mean Changes Across the School Year on the K-3 Relationship Scales and T-CRS Scales and their Significance for First and Second Graders
| Grade | ||||||||
|---|---|---|---|---|---|---|---|---|
| Whole Sample | 1 | 2 | 3 | |||||
| Change Mean | t | Change Mean | t | Change Mean | t | Change Mean | t | |
| Rel-Q Scales | (n = 768) | (n = 246) | (n = 328) | (n = 194) | ||||
| Psychosocial maturity | 0.10 | 12.9*** | 0.08 | 5.5*** | 0.10 | 8.6*** | 0.14 | 8.4*** |
| Perspective taking | 0.09 | 7.7*** | 0.06 | 2.8** | 0.11 | 5.9*** | 0.11 | 4.5*** |
| Interpersonal understanding | 0.16 | 13.0*** | 0.11 | 5.3*** | 0.15 | 8.8*** | 0.22 | 8.5*** |
| Interpersonal negotiation | 0.06 | 4.6*** | 0.05 | 2.4*** | 0.04 | 2.4*** | 0.09 | 3.4*** |
| Hightower T-CRS Scales | (n = 393) | (n = 80) | (n = 313) | (not available) | ||||
| Acting out | 0.05 | 1.4 | -0.07 | -0.9 | 0.08 | 2.0~ | ||
| Shyanxious | -0.04 | -1.4 | -0.17 | -2.1* | -0.01 | -0.3 | ||
| Learning problems | -0.06 | -1.5 | -0.23 | -2.6* | -0.02 | -0.4 | ||
| Easy-going social behavior | 0.01 | 0.3 | 0.03 | 0.3 | 0.01 | 0.2 | ||
| Assertive social skills | 0.08 | 1.9~ | 0.16 | 1.4 | 0.06 | 1.4 | ||
| Task Orientation | 0.05 | 1.1 | 0.14 | 1.3 | 0.02 | 0.5 | ||
~ p < .10 = approaching significance;
*p < .05;
**p < .01;
***p < .001
Estimated Correlations between Hightower Teacher-Child Rating Scales and K-3 Psychosocial Maturity Scales for Second Graders
| Teacher-Child Rating Scales | Psychosocial Maturity | |
|---|---|---|
| Fall (n = 232) | Spring (n = 318) | |
| Problem behaviors | ||
| Acting out | –.15* | –.21*** |
| Shy/anxious | –.18** | –.15** |
| Learning problems | –.27*** | –.22*** |
| Prosocial behaviors | ||
| Easy-going social behaviorsa | .16* | .22*** |
| Assertive social skills | .16* | .13* |
| Task orientation | .22*** | .24*** |
aThe developers of this scale termed it “frustration tolerance.”
*p < .05;
**p < .01;
***p < .001.
Research Question 3. Will the Rel-Q data fit the hypothesized structure of the measure, with three subscales and a general factor of psychosocial maturity or relationship awareness?
The factor structure of the Rel-Q was explored using hierarchical confirmatory factor analysis in order to determine whether the hypothesized structure of the measure—with three first-order subscales (interpersonal understanding, interpersonal negotiation, and perspective taking) and one second-order factor (relationship maturity)—fit the data.
A nested series of hierarchical models were fitted on the nine response-rating and nine best-choice scores. These included three first-order models (one factor, three factor, and nine factor), two second-order models (one factor and three factor), and a third order model representing the hypothesized structure of the Rel-Q model (see Figure 3). As Christiansen, Lovejoy, Szymanski and Lang (1996) point out, comparisons of nested models like these provide a rigorous test of the structural validity of a measure beyond the information obtained from the overall goodness of fit of the hierarchical model itself. The use of nested model comparisons with hierarchical confirmatory factor analysis allows specific features of the Rel-Q model to be tested by restricting the solution in ways that systematically contrast competing higher order models and allow for a closer inspection of whether the factors of a given level are discriminable and justifiable (Rindskopf & Rose, 1988).
Table 9 presents the chi-square statistics, degrees of freedom, and fit statistics6 for the nested series of models and Table 10 presents a summary of the model comparisons. The null model, which posits that all of the observed variables are independent, fit the data poorly, supporting the proposed existence of common factors in subsequent models. The first-order models were compared to test whether the response-rating and best-choice scores for each of the nine items fit together (the nine factor model) or whether they independently loaded onto the three Rel-Q subscales (the three factor model). 7
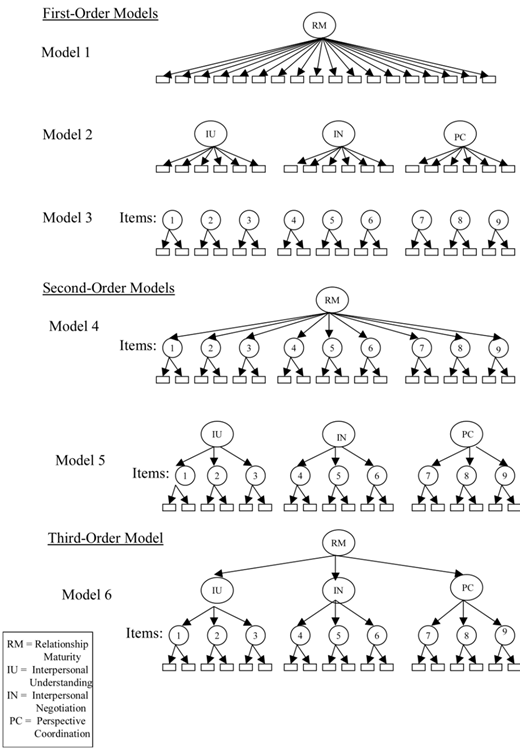
Models for Hierarchical Confirmatory Factor Analysis of the Relationship Questionnaire
Models for Hierarchical Confirmatory Factor Analysis of the Relationship Questionnaire
To examine the discriminability of the first-order factors, the model positing a single factor (Model 1) was compared to the oblique (correlated) nine-factor model (Model 3b). As shown in Table 10, the one-factor model fit considerably worse than the oblique nine-factor models (Model 1 vs. Model 3b), suggesting that the 18 scores were poorly represented by a singular construct. A test of whether inclusion of the nine first-order factors in the model significantly improves fit (Model 2 vs. Model 5b/Model 6) further justified their structure and also suggests that they cannot be adequately represented by the three subscales as first-order factors.
Estimated Fit Statistics for Hierarchical Confirmatory Analysis Models Examined
| Model | X2 | p | df | X2//df | RMR | RMSEA | CFI |
|---|---|---|---|---|---|---|---|
| Null | 4,243 | .00 | 153 | 27.7 | |||
| First-order models | |||||||
| 1. One factor | 1,980 | .00 | 135 | 14.7 | .014 | .102 | .549 |
| 2. Three factor | |||||||
| a. Orthogonal | 2,129 | .00 | 135 | 15.8 | .022 | .106 | .512 |
| b. Oblique1 | 1,693 | .00 | 132 | 12.8 | .014 | .098 | .618 |
| 3. Nine factor | |||||||
| a. Orthogonal | 1,635 | .00 | 135 | 12.1 | .024 | .092 | .920 |
| b. Oblique1 | ,182 | .00 | 99 | 1.8 | .007 | .025 | .980 |
| Second-order models | |||||||
| 4. One factor1 | ,324 | .00 | 127 | 2.6 | .008 | .036 | .952 |
| 5. Three factor | |||||||
| a. Orthogonal2 | 867 | .00 | 126 | 6.9 | .020 | .067 | .819 |
| b. Oblique1 | ,297 | .00 | 124 | 2.4 | .008 | .035 | .958 |
| Third-order model | |||||||
| 6. Rel-Q model1 | 297 | .00 | 124 | 2.4 | .008 | .035 | .958 |
1 The error variance of the response-rating score for the Puppy item was set to zero in these models.
2 Two error variances were set to zero in this model.
Summary of Model Comparisons before Compositing Best-choice and Response-rating Scales
| Comparison | Δχ2 | Δdf | Δχ/Δdf |
|---|---|---|---|
| Overall test of the hierarchical structure | |||
| Model 1 vs. Model 5b/6 | 1,683 | 11 | 153.00 |
| Test whether first-order factors are discriminable | |||
| Model 1 vs. Model 3b | 1,798 | 36 | 49.94 |
| Test whether first-order factors are necessary | |||
| 2b vs. Model 5b | 1,396 | 8 | 174.50 |
| Test whether second-order factors are possible Model | |||
| 2a vs. Model 2b | 436 | 3 | 145.33 |
| Model 3a vs. Model 3b | 1,453 | 36 | 40.36 |
| Test whether second-order factors are necessary/discriminable | |||
| Model 4 vs. Model 5b/6 | 27 | 3 | 9.0 |
| Test whether third-order factor is possible | |||
| Model 5a vs. Model 5b | 570 | 2 | 285.00 |
Overall, the models tested justified the possibility of a hierarchical structure. Specifically, the model positing a single global factor (Model 1) fit the data much worse than the hierarchical model (Model 5b/6), indicating that the first and second-order unique factor variances were important to the model. Furthermore, the three-factor and nine-factor models allowing correlations among the factors (and therefore the potential for higher order factors) fit the data better than the orthogonal models, where no such structure was possible (Model 2a vs. Model 2b and Model 3a vs. Model 3b).
What is the viability of a second-order structure? An examination of the fit statistics show that Models 3b and 5b/6 both fit the data well, though they suggest that the fit of Model 3b is somewhat better, including the X2 (182 vs. 297), RMR (.007 vs. .008), RMSEA (.025 vs .035), and CFI (.980 vs. .958). However, these differences are slight and theory favors Model 5b/6. 8
Further comparisons explored the structure of the second-order factors and the potential for a third-order factor. The correlated factor model (Model 5b) fit the data significantly better than the orthogonal model (Model 5a), where there was no possibility of a higher order factor. Comparing Model 5b/6 to the model with a single second-order factor (Model 4) to test whether the three subscale factors were discriminable, the model with three correlated second-order factors fit the significantly better than the one-factor model. This result suggests that the three second-order factors are discrete and cannot be adequately represented by a more general factor.
From this series of nested model comparisons we conclude that the data fit the hypothesized structure of the Rel-Q measure, with nine first-order factors (i.e., representing the best-choice and response-rating scores for each item), three second-order factors (the three subscales), and a third-order factor (psychosocial maturity). Figure 4 illustrates the third-order model with the fitted parameters, showing high correlations among the second-order factors that support the use of the third-order factor of psychosocial maturity.
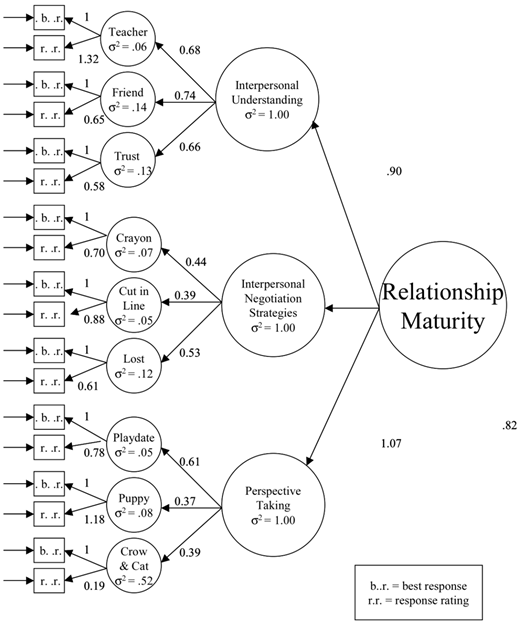
Confirmatory Factor Analysis Model for Relationship Questionnaire with Fitted Parameters
Confirmatory Factor Analysis Model for Relationship Questionnaire with Fitted Parameters
Discussion
Psychometric Properties of the Relationship Questionnaire
One of the most important psychometric characteristics of a developmental assessment in childhood is consistent age differences: older subjects should score higher on average than younger subjects. The Relationship Questionnaire showed significant age differences on psychosocial maturity and the three subscales. Cross-sectionally, kindergartners assessed in early spring scored significantly below first graders assessed in early fall on overall psychosocial maturity and certain subscales; first graders assessed in the early fall of the school year scored significantly below first graders assessed in the late spring, who in turn scored significantly below second graders assessed in the late spring in the Northeastern sample. Although this pattern did not hold consistently through third grade—the third graders tested in late spring did not score higher in the cross-sectional sample than those tested in the fall, change scores on the Rel-Q scales across the school year in the smaller longitudinal sample were highly significant for first, second, and third graders. Moreover, in the (cross-sectional) Southern sample, in which students were tested in January of the school year, there was significant change across each year between kindergarten and third grade. Not surprisingly, there were no differences between subjects assessed in the late spring of first grade and the early fall of second grade in the Northeastern sample—nor across the summer between second and third grade—since these assessments were only about four months apart.
Thus, although students in the kindergarten through third grade scored on average between the unilateral and reciprocal levels, students move from an average score close to the unilateral level in kindergarten to an average score closer to the reciprocal level by the end of third grade. The age progression in these cross-sectional and longitudinal data suggest that the Rel-Q is sensitive to developmental change in relationship maturity in the early elementary years. Although the evidence suggests that the natural growth in these psychosocial competencies is greater for the younger early elementary students, this may be an artifact of the measure—for example, some degree of ceiling effect may be operating for the third graders— since there was significant growth in psychosocial maturity across the later elementary years (fourth through sixth grade) on the reading-based version of the Rel-Q (cf. Schultz, Selman, & LaRusso, 2003).
Beginning at the end of first grade, girls’ psychosocial maturity was significantly higher than that of boys. Results from a study using the 4-12 Rel-Q suggest that this gender difference remains through 12th grade (Schultz, Selman, & LaRusso, 2003). Gender differences are typically found on measures of children’s social skills, with girls generally scoring as more socially adept than boys. For example, teachers rated girls higher than boys in kindergarten through sixth grade on the T-CRS (Hightower et al., 1986), except for the Shy/ Anxious scale. Similarly, teachers, parents, and students consistently gave better ratings to females at almost every grade level from preschool through 10th grade on the Social Skills Scale of the SSRS (Gresham & Elliott, 1990). Thus, relationship maturity as measured by the Rel-Q shows gender differences consistent with the T-CRS, SSRS, and other social skills measures. Despite some debate about whether gender differences in social development are due to biological or social processes, the finding that there are few gender differences in psychosocial maturity in kindergarten and early first grade, but that they emerge consistently at the end of first grade and continue through high school—and even into young adulthood (Schultz, Hauser, Selman & Allen, 2004)—suggest that these gender differences may be due to differential socialization, consistent with other evidence (Maccoby, 1990, 1998).
The multiple-choice methodology of the Rel-Q asks children to not only choose among four responses (best choice), but also to rate each of the four responses separately (response rating), a task in which children evaluate the responses according to their own developmental schema. This latter method is an innovative way to tap children’s social competence by comparing their rating of a range of social responses to a theoretical and empirical developmental ordering to convert the resulting score to a developmental metric.
The data with regard to internal consistency reliability provide less consistent support for the soundness of the Relationship Questionnaire than do the age and gender data, though this may speak to the complexity of the theoretical constructs rather than to deficient reliability of the measure. As argued in Schultz, Selman and LaRusso (2003), the higher reliability of the overall score reflects the deep structure of social perspective coordination on which the developmental levels of each of the psychosocial competencies (i.e., the subscales) are based; the lower reliability of the subscales reflects the contextual nature of these competencies, which theoretically are expected and empirically have been shown to vary across different interpersonal relationships and across different incidents or interactions within the same relationship (e.g., Selman et al., 1986). The higher estimated Cronbach alpha reliabilities on the 4-12 version of the Rel-Q (.85 for relationship maturity reported in Schultz, Selman & LaRusso, 2003) supports the notion that younger children are more labile in their psychosocial functioning than older children, both less consistent in coordinating social perspectives and more variable in applying it across contexts. The low internal consistency of the best-choice scores is due in part to the fact that these scores are based on only three data points for each of the three subscales, whereas the response-rating scores are based on 12 data points and the composite scores on 15 data points per subscale. Choosing the best choice represents a distinct cognitive task from that of rating each response, but because the reliability of the composite Rel-Q score is much more adequate than the response-rating score and (especially) the best-choice score, this score tends to be preferable in statistical analyses.
Hierarchical confirmatory factor analysis on a nested series of models confirmed that, as predicted by the theoretical model, a hierarchical model fits the Rel-Q data better than the one-factor model that neither pairs best-choice score and response-rating scores for each item nor groups the items into the three subscales of interpersonal understanding, interpersonal negotiation, and perspective coordination. Despite the relatively low internal consistency of the Rel-Q subscales, reflected in the “best” fit of the hierarchical model without the three subscales, the model that includes both the subscales and a higher-order general factor of relationship maturity also fits the data very well, providing support for the theoretical structure of the measure.
The psychosocial maturity of first, second, and third graders was positively correlated with teacher-rated T-CRS prosocial behaviors, as well as negatively correlated with teacher-rated problem behaviors, but at a small effect size. The teacher-rated social skills did not show the age progression of the Rel-Q scores. The T-CRS assessment seems based on observers’ norms of what constitutes culturally appropriate social behavior so that there is development in teacher’s (external) understanding of the child’s social behavior rather than in the cross-age scores. In contrast, the developmental standards are to a greater degree embedded in the expression of the child’s internal competencies on the Rel-Q. In rating children on social skills measures like the T-CRS, teachers may think good behavior consists of obedience and not causing difficulty, even if the child’s level of relational competence is low. On the other hand, children may have higher levels of social awareness but act up in class in ways that lower the teacher’s evaluation of their social adjustment. The very modest size of the correlation between the Rel-Q and the T-CRS suggests that the Rel-Q constructs overlap only somewhat with constructs of more traditional social skills measures, which represent culturally-driven, adult-centered evaluations of culturally-defined, appropriate behavior or social adjustment. The Rel-Q, in contrast, measures a related but quite different construct of developmentally-defined relationship awareness or psychosocial maturity that is sensitive to context.
There are a number of threats to the validity of the measure, as expected when assessing complex psychological processes with a multiple-choice instrument. Subjects can fill out the measure without thinking carefully about their responses, especially when it is administered in a group setting, such as a classroom. Although subjects can also be dismissive on an interview, the multiple-choice questionnaire format for assessing relationship maturity is much more subject to a lack of authentic engagement than an in-depth interview format. Though it may be less useful for individual assessment or diagnosis unless administered one-on-one, across large samples the measure successfully differentiates subjects in theoretically predicted ways.
The sample in this study was limited to urban, low social class populations because the data were collected in the course of the evaluations of prevention and character education programs in inner city schools. Research with the 4-12 version of the Rel-Q demonstrated that higher socioeconomic status (SES) suburban populations scored at higher levels of psychosocial maturity than lower SES urban populations; future research is needed to investigate whether this pattern would hold for the K-3 Rel-Q. Another limitation in the present study is that the developmental properties of the measure were examined solely through its correlation with grade. Further studies should explore whether children who do better on the measure actually have more mature relationships. Past research with interview and observational measures of interpersonal development based on social perspective coordination has found that mature social perspective coordination capacity is necessary but not sufficient for mature social behavior: children with low psychosocial maturity (measured as both interpersonal understanding and interpersonal negotiation strategies) have uniformly low level social behavior, whereas those with high psychosocial maturity may or may not have higher level social functioning (Selman, 1980; Selman & Schultz, 1990).
The Rel-Q can help evaluate the effectiveness of character education programs that aim to promote fairness, reciprocity, and other moral issues because social perspective coordination and hence psychosocial competence is inherent in these issues: if students lack the capacity to take the perspectives of others, they will fail to treat them fairly and with respect. Schultz, Selman, and LaRusso (2003) found that psychosocial maturity as measured by the Rel-Q is significantly correlated with moral reasoning measured with the Defining Issues Test (Rest, 1986) and, as discussed earlier, negatively associated with risky and antisocial behaviors such as fighting and criminal acts, providing evidence that psychosocial development is an important protective factor and resiliency process in character development. The 4-12 Rel-Q has shown great promise for character education and violence prevention program evaluation—for example, in a study of the Facing History and Ourselves program (Schultz, Barr, & Selman, 2000). The K-3 Rel-Q offers researchers an assessment tool that can differentiate children from kindergarten through third grade on a crucial aspect of social development—their level of psychosocial maturity or relationship awareness, providing a valuable new resource for the evaluation of character education programs for younger elementary-age children, for whom few measures of social development exist.
Note that, as described below, the awareness of personal meaning competency is not measured on the picture-based (K-3) version of the Rel-Q, though it is with the reading-based (4-12) version. Shared experience, one of the interpersonal skills, is not measured with either version of the Rel-Q.
These character education programs were the Early Childhood Prevention Project (Watts, Murphy & Nikitopoulos, 1997) and the Voices of Love and Freedom (Walker, 1997).
Research assistants reported that the participation rate of each class seemed to be dependent on the diligence of the teachers in connecting with the students’ parents or guardians more than to resistance to the study on the caretakers’ parts.
Personal meaning awareness, or relationship valuing, is defined as the process by which individuals connect their behavior in relationships to their own life histories, which involves a developing capacity to appreciate consciously and express explicitly the implicit embeddedness of behavior in the complex fabric of past and present relationships (Levitt & Selman, 1996; Selman, Levitt & Schultz, 1997). This competency—although operative—can not be differentiated from interpersonal understanding and skills at this age with this methodology.
The means for psychosocial maturity and interpersonal negotiation in kindergarten suggest that if the sample size were larger for this grade, the gender difference may have been significant.
The root mean square error of approximation (RMSEA) and comparative fit index (CFI) fit indices are resistant to the size of the sample. The RMSEA (Steiger, 1990) is a measure of the discrepancy per degree of freedom, with values of .05 or less indicating very close fit and values approaching .08 representing reasonable errors of approximation. The CFI (Bentler, 1989) compares improvement of fit of the model to the baseline of the null model, where all of the items are independent and no common factors are possible. This index ranges from 0 to 1, with values above .90 generally accepted as representing an acceptable fit, and those between .80 and .90 indicating a more moderate fit of the model to the data.
The three-factor oblique second-order model is identical to the third-order Rel-Q model because in models with three factors, a higher order factor is just-identified, that is, the number of correlations among the lower order factors is exactly equal to the number of parameters needed to define the higher order factor (Marsh & Hocevar, 1985). Even though the higher order model is statistically indistinguishable from the lower order model, the higher order model is represented because the overall relationship maturity score is used regularly in practice and because this model conceptually represents the least restrictive model within which the other models are nested.
The comparisons involved two versions of the three and nine-factor models (Models 2 and 3) that differed on the degree to which correlations between the first-order factors were constrained, one in which they are orthogonal (uncorrelated) and one in which they are oblique (correlated).
Furthermore, because higher order factors are merely trying to explain variation in lower order factors in a more parsimonious way, even when the higher order model is explaining this covariance effectively, the fit can never surpass that of the first-order model (Marsh & Hocevar, 1985).

