


The Social and Character Development (SACD) research program was designed to evaluate the effectiveness of seven elementary-school-based programs developed to promote social and emotional competence, positive behavior, a positive school climate, and academic achievement, and to decrease negative behavior. Procedures undertaken by the SACD Consortium to optimize the outcome measures used in the multiprogram evaluation are described. Preliminary analyses of the reliability and validity of the original scales, largely selected from previous research, suggested that a smaller set of outcome measures with stronger psychometric properties could be derived. The factor structure of these measures was examined using exploratory and confirmatory factor analyses to distill the child outcome measures into a more parsimonious and practicable set of measures for these programs. Support was found for a 5-, 3-, and 10-factor solution for the teacher, primary caregiver, and child reports, respectively, which were stable across three assessment times, robust to different statistical assumptions, and invariant across gender, race/ethnicity, and program site. A multitrait, multimethod analysis confirmed construct convergence across reporters but also indicated significant reporter effects. In addition to the measures’ utility in evaluating the effects of the SACD program, the process used and knowledge gained are discussed to offer guidance to others who design and conduct evaluations of school-based programs. These include the importance of using multiple reporters of data, assessing actual performance of a measure even if previously published, and including measurement of altruistic behaviors as a unique feature of children’s behavior.
All too often, large-scale policy or program initiatives lack an evaluation component to assess their success in preventing or promoting the intended outcomes (Koplan, Liverman, Kraak, & Wisham, 2007; Lyons, Palmer, Jayaratne, & Scherpf, 2006). Without such information, the extent to which initiatives should be continued, altered, or discontinued cannot be appropriately determined (Elliott & Tolan, 1999). Rigorous evaluation that includes valid, reliable measurement is thus needed to inform decision makers and practitioners about program effectiveness. This article describes the process by which a team of researchers selected, developed, and validated measures used to assess the effects of the interventions in the Social and Character Development (SACD) research program on student outcomes.
As detailed by Haegerich et al. and Flay et al. (both in this volume), the SACD research program was designed to evaluate the effectiveness of seven different school-based interventions to promote social and emotional competence, increase prosocial behavior, decrease problem behavior, promote a positive school climate, and support student academic achievement. Although the approaches used by each of the seven programs varied, they consistently focused on accomplishing these outcomes. Thus, in addition to specific, independent evaluations of each program, the SACD research study also included a multiprogram evaluation based on a common set of measures to determine the overall effects of the seven programs combined and programspecific effects on these outcomes.
Prior to implementation, the SACD Consortium (composed of representatives from the funding agencies, the contracted evaluator, and each of the seven funded sites) collaborated to design the SACD conceptual model (see Haegerich et al. this volume for the full model, and Figure 1 for the model simplified to constructs included in this article). The complex conceptual model of the SACD research program reflects a number of factors including: (a) the growing empirical understanding of the factors that contribute to children’s behavioral functioning and the interrelatedness of these factors (Haegerich et al. this volume); (b) the recognition of the importance of program evaluations to include methodically sound measures of the program’s intended behavioral outcomes and mediators of those outcomes, such as children’s attitude, knowledge, and competencies (Eddy, Dishion, & Stoolmiller, 1998); and (c) calls for the design and evaluation of programs that simultaneously address both positive and negative behavioral outcomes (Catalano, Berglund, Ryan, Lonczak, & Hawkins, 2002; Greenberg, 2004). The SACD conceptual model guided the selection of a common set of surveys to address the main outcomes of interest, as well as the proposed mediators and moderators, for the multiprogram evaluation.
As shown in Figure 1, the SACD conceptual model posits that the seven programs will increase students’ social-emotional competence, instill a more supportive school climate, increase students’ positive behaviors, decrease negative behaviors, and improve academic achievement. Within each of these domains, more specific constructs were identified as important measurable outcomes of the SACD research program. Positive behaviors included taking responsibility for one’s own actions, self-regulation, and behaviors that indicate active interest in getting along with others, such as cooperative and prosocial behaviors. Negative behaviors included aggression and school-related disruptive and delinquent behaviors that inhibit students’ ability to learn. Academic behaviors included academic competence and student engagement in the learning process. Together, these behaviors provide a comprehensive picture of the expected impact of the programs on student behavioral outcomes.
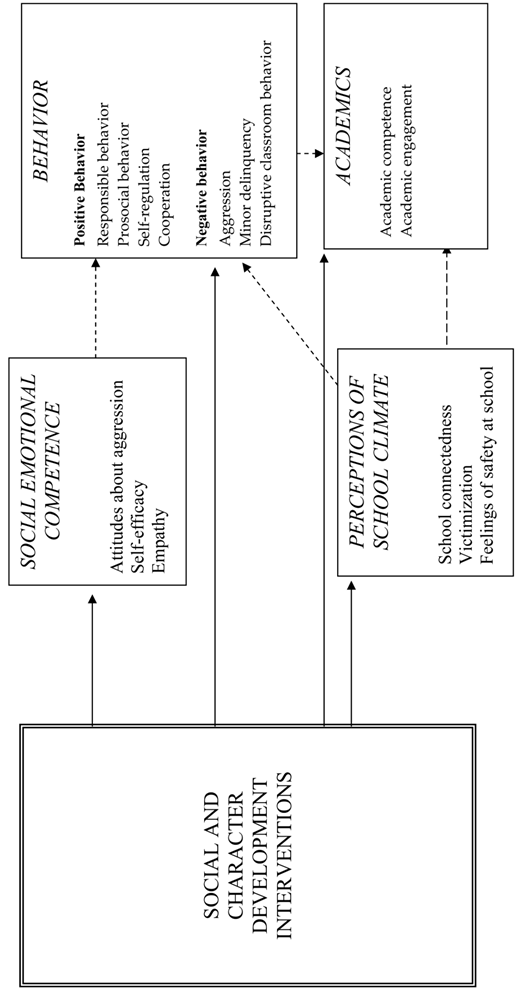
Conceptual model for the Social and Character Development program simplified to constructs examined in measurement model.
Conceptual model for the Social and Character Development program simplified to constructs examined in measurement model.
Social-emotional competence and school climate were included both as likely proximal outcomes of the SACD programs (see Flay et al., this volume, for individual program descriptions) and as potential mediators of change in students’ negative, positive, and academic behaviors. Within the domain of social-emotional competence, children’s beliefs about the acceptability of aggression were identified for their documented association with aggressive behaviors (e.g., Guerra, Huesmann, Tolan, VanAcker, & Eron, 1995). Empathy was the second competence selected, as it has been shown to relate to both negative and positive behaviors (e.g., Schultz, Izard, & Bear, 2004). These two constructs relate mostly to children’s motivation to engage in negative or positive behaviors, but do not necessarily address children’s ability to enact desirable behaviors. Thus, children’s perceived self-efficacy for engaging in social interaction was also identified as an important outcome. These social-emotional competencies, hypothesized to be gained as a result of program exposure, were expected to translate into behavioral changes by providing students the skills and tools to be successful in their social and academic endeavors.
Within the domain of school climate, three specific outcomes were included to determine the extent to which the SACD programs increased the warmth, caring, and safety of the school’s social environment. School connectedness entails the degree to which individuals feel like an integral part of a cohesive, supportive, school community and is likely to contribute to increased academic performance and positive behaviors and decreased negative behaviors (e.g., Battistich, Solomon, Watson, & Schaps, 1997). Conversely, the degrees to which students feel unsafe or are actually victimized by peers are likely to decrease academic performance and positive behaviors and increase negative or defensive behaviors (e.g., Orpinas & Horne, 2006). By increasing positive and decreasing negative experiences at school, the programs were expected to enhance students’ social and academic behavioral outcomes.
Each SACD program site administered a core set of common measures (described below and in Table 1), largely derived from previous research, to assess the key child outcome domains of interest. Whenever possible, surveys validated with elementary-school-aged children were selected, as were measures that have been used to evaluate the effects of other interventions. In order to reduce the impact of potential reporter bias and increase confidence in the obtained results, reports of child behavior were elicited from multiple sources. By assessing different reporters’ perspectives of a child’s behavior and academic competence and by assessing those behaviors in different settings, a multi-informant approach offers a more complete picture of child behaviors (Kraemer et al., 2003; Noordhof, Oldehinkel, Verhulst, & Ormel, 2008). Surveying the students directly was included to provide otherwise unobtainable data on self-perceptions of attitudes and behaviors. This comprehensive core set of measures, used at all seven sites, was intended to allow for conclusions about the social and character development model across a variety of specific program approaches.
Child Outcome Measures Selected for Inclusion in the Cross-Site Evaluation, by Domain of the SACD Program Model
| Outcome Domain Measure | Measure Source | Respondent(s)a | Number of Itemsb | Cronbach’s Alpha at Baseline |
|---|---|---|---|---|
| Social-Emotional Competence | ||||
| Normative Beliefs About Aggression | Huesmann & Guerra (1997) | C | 8 | .82 |
| Children’s Self-Efficacy for Peer Interactions Scale | Wheeler & Ladd (1982) | C | 22 | .83 |
| Children’s Empathy Questionnaire | Funk, Elliott, Jenks, Bechtoldt, & Tsavoussis (2001) | C | 16 | .80 |
| School Climate | ||||
| Sense of School as a Community Scale | Roberts, Horn, & Battistich (1995) | C | 14 | .84 |
| Feelings of Safety at School | Created by SACD Consortium | C | 5 | .73 |
| Victimization Scale | Orpinas, Horne, & Staniszewski (2003) | C | 6 | .86 |
| Positive Behaviors | ||||
| Social Competence | Conduct Problems Prevention Research Group (1991) | PC/T | 19 | .86/.96 |
| Altruism Scale | Solomon, Battistich, Watson, Schaps, & Lewis (2000) | C/PC/T | 8 | .88/.88/.89 |
| Responsibility Scale | Created by SACD Consortium | PC/T | 8 | .81/.91 |
| Negative Behaviors | ||||
| Aggression Scale | Orpinas & Frankowski (2001) | C | 6 | .83 |
| BASC Aggression Subscale | Reynolds & Kamphaus (1998) | PC/T | 13/14 | .77/.94 |
| BASC Conduct Problems Subscale | Reynolds & Kamphaus (1998) | PC/T | 11/10 | .59/.67 |
| Frequency of Delinquent Behavior | Dunford & Elliott (1984) | C | 7 | .71 |
| Attention-Deficit/Hyperactivity Disorder (ADHD) Symptomology | Inattention/Overactivity items from Loney & Milich (1982) and items adapted from ADHD criteria from American Psychiatric Association (2000) per Pelham et al (1992) | T | 10 | .91 |
| Academic Behaviors | ||||
| Academic Competence and Motivation | Adapted items from Achenbach (1991) and Gresham & Elliott (1990) | T | 5 | .96 |
| Student Behavioral Engagement Subscale of the Engagement vs. Disaffection with Learning Scale | Furrer & Skinner (2003) | C | 10 | .67 |
a C = child, PC = primary caregiver, T = teacher.
b The number of items from the original measure selected for inclusion in the pilot assessment package. Following pilot testing of the measures, 10 items from the Children’s Self-Efficacy for Peer Interactions scale and 1 item from the Frequency of Delinquent Behavior scale were dropped.
When designing the evaluation of the SACD model, several methodological challenges and considerations were recognized by the SACD Consortium. For instance, validated surveys that measured some proposed model variables (e.g., responsibility-taking behavior) were not available, and new measures had to be developed. The psychometric properties of even well-established measures of other variables required examination because measures validated for one population may not be applicable or methodically sound when used with different populations (Farrell, Meyer, Kung, & Sullivan, 2001; Joreskog & Sorbom, 2001; Okazaki & Sue, 1995). Additionally, most of the model variables and selected measures had not previously been used in concert with each other. Though the use of multiple informant reports for similar behaviors was a potential strength of the study, it necessitated a thorough examination of the convergent and discriminant validity of the measures and method effects (Campbell & Fiske, 1959; Eid et al., 2008; Lance, Noble, & Scullen, 2002). This article describes how these challenges were addressed in developing valid and optimal measures (Floyd & Widaman, 1995; Reise, Waller, & Comrey, 2000) to evaluate the effects of the SACD program.
Initially, a comprehensive assessment battery was developed from a combination of published and newly developed instruments and was administered to students and their teachers and primary caregivers. Baseline data collected from this assessment battery were then examined through a series of exploratory and confirmatory factor analyses to develop a parsimonious, practicable, and analytically sound set of outcome measures for this SACD multiprogram evaluation. The results provide not only a description of a psychometrically validated set of outcome measures, but also lessons to guide future evaluations of similar programs.1
Methods
Participants
The seven research teams recruited a total of 84 public elementary schools (42 intervention and 42 control schools) into the study and began the baseline data collection in fall 2004. The average school enrollment was 567 students, and 61% of students at the participating schools were eligible for free or reduced-price lunch. The average number of full-time teachers per school was 39. Over half of the schools (56%) were located in urban areas, 27% were in suburban areas, and 17% served rural areas. Informed consent (for primary caregivers and teachers) and assent (for children) procedures were followed per the protocols approved by each site’s Institutional Review Board. Approximately 65% of primary caregivers consented to having their Grade 3 child and child’s teacher participate in survey administration, of which 94% of the child surveys and 96% of the teacher surveys were completed. Primary caregivers’ own consent rate was 63%, with 92% of those consented returning completed surveys.
The vast majority of primary caregivers (86%) were mothers and stepmothers, with an average age of 36 years. More than half of primary caregivers (57%) were married. The educational attainment of primary caregivers was relatively high, with 61% having attended some college or obtained a bachelor’s or higher degree. A total of 847 third-grade teachers completed surveys, most of whom were female (88%) and White, non-Hispanic (75%). These teachers had an average of almost 13 years of teaching experience. The baseline data included in the analyses of this article represent approximately2 4,000 child self-reports, primary caregiver reports for 3,780 children, and teacher reports for 4,100 children collected at intervention and control schools. As can be seen from the demographic information on students in Table 2, there was considerable variability across sites with respect to race/ethnicity and household income, indicating a diversity of student populations included in the SACD study.
Primary Caregiver Reported Demographic Information of Sample at Baseline (Fall, 2004).
| Total Sample (n = 3770) | Site 1 (n = 490) | Site 2 (n = 420) | Site 3 (n = 500) | Site 4 (n = 620) | Site 5 (n = 590) | Site 6 (n = 590) | Site 7 (n = 570) | |
|---|---|---|---|---|---|---|---|---|
| Child’s Gender | ||||||||
| Male | 47.5 | 48.3 | 42.5 | 50.1 | 48.0 | 50.4 | 46.3 | 46.9 |
| Female | 52.5 | 51.7 | 57.5 | 49.9 | 52.0 | 49.6 | 53.7 | 53.1 |
| Child’s Race/Ethnicity | ||||||||
| White, non-Hispanic | 42.1 | 5.3 | 56.1 | 32.7 | 64.9 | 82.9 | 6.0 | 46.6 |
| Black, non-Hispanic | 31.0 | 40.5 | 22.3 | 41.2 | 21.1 | 6.6 | 51.1 | 34.5 |
| Hispanic | 19.2 | 45.9 | 11.5 | 17.3 | 7.9 | 4.7 | 37.4 | 9.9 |
| Other | 7.7 | 8.3 | 10.1 | 8.8 | 6.1 | 5.8 | 5.5 | 9.1 |
| Total Household Income | ||||||||
| Less than $20,000 | 33.2 | 51.7 | 29.1 | 40.7 | 24.1 | 2.2 | 55.4 | 29.1 |
| $20,000 to $39,999 | 24.4 | 25.9 | 18.3 | 34.0 | 22.4 | 10.1 | 28.1 | 31.7 |
| $40,000 to $59,999 | 15.1 | 9.9 | 17.2 | 16.2 | 19.9 | 11.2 | 10.2 | 21.2 |
| $60,000 or higher | 27.3 | 12.5 | 35.5 | 9.1 | 33.5 | 76.5 | 6.3 | 18.0 |
Note: All cell values represent percent (%) of a sample reporting that category. Sample sizes reported are rounded to the nearest ten, per SACD Restricted Data Use Agreement.2
Measures
Social-Emotional Competence. Previously published and validated measures were readily available for the three social-emotional competencies identified in the SACD conceptual model. Specifically, children’s attitudes about the acceptability of aggression were assessed by the eight General Approval of Aggression items from the Normative Beliefs about Aggression scale (Huesmann & Guerra, 1997). These items (e.g., It is okay to yell at others and say bad things; It is wrong to get into physical fights with others) ask children to rate the degree to which they feel that verbal and physical aggression are appropriate.
With respect to children’s self-efficacy, although a number of general measures were available, the specific form of self-efficacy most relevant to the SACD model and programs was a child’s sense of how capable they feel interacting with peers. The Self-Efficacy for Peer Interactions Scale (Wheeler & Ladd, 1982) was thus selected. This scale asks children to rate how hard or easy it is to assert themselves in 22 peer interaction situations. Two types of peer-interaction situations are included: conflict and nonconflict. For example, one conflict situation item asks how hard or easy it is to tell another child to stop teasing a friend. One nonconflict item asks how hard or easy it is to ask to sit with a group at lunch.
To assess children’s empathy, the 16-item version of the Children’s Empathy Questionnaire (Funk, Elliott, Jenks, Bechtoldt, & Tsavoussis, 2001) was selected for its use of concrete situations to assess empathic reactions. The measure describes situations likely to be encountered frequently by children and asks children to respond whether they experience a particular emotion associated with each situation (e.g., When I’m mean to someone, I usually feel bad about it later; When I see someone who is happy, I feel happy too).
School Climate. The Sense of School as a Community Scale (Roberts, Horn, & Battistich, 1995) was selected to assess general aspects of school climate. For this scale, children respond with their extent of agreement with 14 statements about respect, caring, and support within their school (e.g., Teachers and students treat each other with respect; The students in this school don’t really care about each other; I can talk to the teachers in this school about things that are bothering me). Children were also asked to respond to a shortened, 6-item version of the Victimization Scale (Orpinas, Horne, & Staniszewski, 1995) to assess the frequency with which they experienced verbal, physical, or relational aggression at the hands of their peers. A final aspect of school climate (i.e., perceptions about personal safety) lacked readily available and validated measures for elementary grade children beyond single-item assessments used in previous research. Thus, the SACD Consortium designed a new measure for this evaluation, which is called the Feelings of Safety at School scale. For this measure, children were asked to rate their agreement or disagreement with five statements about how safe students perceive the school to be. Three statements were about generally feeling safe or afraid at school, and two were specific to feeling afraid that someone would bully or tease them at school.
Positive Social Behaviors. To assess self-regulation, prosocial behavior, cooperation, and responsible behavior, a combination of previously validated and newly developed scales was included. The Social Competence Scale (Conduct Problems Prevention Research Group, 1991) was selected to tap into aspects of children’s positive social interactions and control over their emotional and behavioral responses. To maintain consistency across reporters and provide outcome data on the same child behaviors, the Emotion Regulation Skills and Prosocial/Communication Skills subscales from the Teacher Version were administered to both teachers and primary caregivers. These two reporters responded to 19 descriptions of discrete behaviors (e.g., Resolves peer problems on her/his own; Copes well with failure; Acts friendly towards others) on how often the child exhibits each self-regulatory or socially appropriate behavior. To assess the extent to which children exhibit prosocial behaviors that more explicitly foster others’ success and well-being, a specific measure of altruistic behaviors was included. The Altruism Scale (Solomon, Battistich, Watson, Schaps, & Lewis, 2000) describes nine situations of physical or emotional helping behaviors, and asks how often a child has engaged in those behaviors. For example, the prosocial situations include: cheered up someone who was sad, helped someone who fell down, and helped a younger child who was lost. All three reporters (children, primary caregivers, and teachers) reported on children’s altruistic behaviors using this scale. One item, stopped someone from hurting an animal, was omitted from this evaluation due to concerns that it might be disturbing to participants.
The final hypothesized positive behavior of the SACD programs was the child’s expressed degree of responsibility-taking for his/her actions. As a literature search produced no previously published measures that had been successfully used with children this young, it was necessary to create a new scale for the SACD multiprogram evaluation. Working from how the construct had been previously measured with older children (e.g., Wentzel, 1991), the SACD Consortium first generated a list of behaviors that would be considered socially responsible (e.g., keeping promises, taking care of borrowed materials, asking permission, taking responsibility). A decision was made to use parent and teacher reports of children’s responsible behaviors, and thus selected behaviors from the list that would be readily observable.
The final set of items for the Responsibility Scale described six routinely available opportunities for children to exhibit accountability and conscientiousness (i.e., asks before borrowing or taking something, takes responsibility for one’s actions, apologizes when s/he has done something wrong, takes care of borrowed belongings, returns borrowed belongings, and takes care of own things) and two irresponsible behaviors (i.e., denies wrongdoing even when confronted with evidence, and tries to get away with things s/he knows are wrong). These items not only represented situations in which the failure of a child to act responsibly would initiate action by primary caregivers or teachers (e.g., returning an item borrowed without permission; taking away materials not being treated appropriately), but were also behavioral indicators of the child’s internalization of social agreements and conventions. Primary caregivers and teachers rated the frequency with which children engaged in each behavior.
Negative Social Behaviors. Aggressive behaviors, minor delinquency, and disruptive behaviors were assessed by a series of published measures. Specifically, children were asked to report on their own aggressive behaviors using a 6-item version of the Aggression Scale (Orpinas & Frankowski, 2001). These items include verbal (e.g., teasing, name-calling), physical (pushing/shoving/hitting), and relational (e.g., making up rumors) aggression. Children also indicated how often they engaged in rule-breaking behaviors using the Frequency of Delinquent Behavior scale (Dun-ford & Elliott, 1984). To minimize overlap with the Aggression Scale, only seven items of the Frequency of Delinquent Behavior scale were selected and modified to reflect delinquent behavior in school, such as being sent home from school, stealing at school, and skipping class.
For teacher and primary caregiver reports of children’s disruptive and oppositional/defiant behaviors, the Aggression Subscale from the Behavioral Assessment System for Children (BASC; Reynolds & Kamphaus, 1998) was selected. The 14-item teacher-report and 13-item primary-caregiver-report versions include items that measures verbal (e.g., threatening) and physical (e.g., hitting) aggression and other disruptive behaviors (e.g., complains about rules). The BASC Conduct Problems Subscale (Reynolds & Kamphaus, 1998) was also included to assess the frequency with which teachers and caregivers observe children breaking rules or not adhering to social conventions. The 10 teacher-reported and 11 primary-caregiver-reported behaviors ranging from relatively minor (e.g., showing a lack of concern for others feelings) to very serious (e.g., being suspended from school or in trouble with the police).
To assess the degree to which children had difficulty sustaining their attention and controlling their impulses, symptoms of attention deficits, impulsivity and hyperactivity were gauged with a set of teacher-reported items from two sources. First, the five Inattention/ Overactivity items from the IOWA Conners Teacher’s Rating Scale (Loney & Milich, 1982) were selected. To augment the IOWA Conners items, five items based on diagnostic criteria for Attention-Deficit/Hyperactivity Disorder (ADHD) from the Diagnostic and Statistical Manual for Mental Disorders, Fourth Edition (DSM; American Psychiatric Association, 2000) were added. These items have been shown to have the highest Positive Predictive Power for ADHD diagnoses in school settings (Pelham, Gnagy, Greenslade, & Milich, 1992). The final set of 10 items assessed a range of symptoms of ADHD, such as inattention, distractibility, verbal and physical impulsivity, losing things, and difficulty organizing activities. Although respondent burden considerations prohibited the use of an entire DSM-based list of ADHD symptoms, a recent review documents that brief symptom lists, such as that utilized in this evaluation, are as effective as longer, DSM-based lists in identifying ADHD (Pelham, Fabiano, & Massetti, 2005).
Academic Behavior. Five items from the Social Skills Rating System (Gresham & Elliott, 1990) and the Teacher Report Form of the Child Behavior Checklist (Achenbach, 1991) were adapted to assess students’ school performance and motivation for school success. Teachers were asked to rate each child’s performance in reading and math and overall intellectual and academic performance relative to grade-level standards and to rate each child’s motivation to succeed academically relative to the average student. In order to assess children’s self-perceptions of commitment to learning, the Student Behavioral Engagement subscale of the Engagement versus Disaffection with Learning Scale (Furrer & Skinner, 2003) was selected. This subscale contains 10 child-reported items to assess the extent of effort and attention that children expend in their school work (e.g., When I’m in class, I listen very carefully; I don’t try very hard at school).
To simplify administration, scales were grouped by the nature of the items (e.g., attitudinal statements, descriptive scenarios with questions) and by the type of response required (e.g., degree of agreement, frequency of behavior). Items from different scales were then interspersed within groups. This format simplified the number of different possible response sets and different instructions, thereby likely reducing measurement error, especially for the child self-report. Children were asked to respond based on the “past couple of weeks.” For primary caregivers and teachers, the time frame given was the past 30 days. A 4-point frequency scale of Never, Sometimes, Often, or Almost Always was used for the teacher and primary caregiver report of responsible behavior, social competence, aggression, and conduct problems, and for the teacher report of ADHD symptomology. A 4-point frequency scale of Never, Once or Twice, A Few Times, or Many Times was used for all three respondents’ reports of altruistic behavior, and for children’s reports of aggression, minor delinquency, and victimization at school. Children’s reports of empathy were assessed with a 3-point scale of Yes, Sometimes, and No. For self-efficacy in peer interactions, the four response options were Really Easy, Sort of Easy, Sort of Hard, and Really Hard. For acceptability of aggression, the four response options were Really Wrong, Sort of Wrong, Sort of Ok, and Perfectly Ok. School connectedness, engagement with learning, and feelings of safety at school were assessed with a 4-point scale that ranged from Disagree a Lot to Agree a Lot. Teachers’ reports of academic competence and motivation were rated on 5-point scales. For academic competence, the lowest and highest options were Far Below Grade Level and Far Above Grade Level, respectively. For academic motivation, the lowest and highest options were Extremely Low and Extremely High, respectively.
Procedures
Baseline administration of the assessment package occurred in the fall of 2004, when students were beginning the third grade. Surveys were group-administered to students with a proctor reading the directions, items, and responses aloud as children followed along in their survey booklets during a 50-minute classroom session. Teacher surveys were self-administered and took approximately 15 minutes for each consented student in their classroom. Primary caregivers either self-administered the surveys or were contacted by a researcher and completed the surveys with a computer-assisted telephone interview. Primary caregiver surveys took approximately 15 minutes to complete. Postintervention data were collected in the spring of 2005 and spring of 2006.
A pilot test of the measures and procedures was conducted in December 2003. Based on data and respondent feedback, a number of revisions were made. Most changes were minor, such as slight rewording or restructuring of items to improve respondent understanding. Due to respondent fatigue concerns, the relatively long (22-item) Self-Efficacy for Peer Interactions scale was shortened to 12 items, which were selected based upon preliminary analyses of the scale’s psychometric properties. One additional item, taking things from school without paying for them, such as food from the lunchroom, was dropped from the Frequency of Delinquent Behavior scale. Pilot assessors reported that several children who receive free lunch at school had difficulty with this item. The SACD Consortium agreed that, given the schools recruited into the study, a sizeable number of students were likely to have the same difficulty. The item was therefore deleted from the assessment protocol.
Results
Reliability and Validity of Original Scales
Examination of the internal consistency of the scales administered at baseline revealed that although most performed adequately (i.e., Cronbach’s alphas ≥ .80, see Table 1), six scales did not. Three evidenced unacceptable internal consistency (i.e., Cronbach’s alphas < 0.70). In addition, several scales were highly inter-correlated, especially those from the same informant (e.g., the correlation between teacher report on the Responsibility Scale and the Social Competence Scale was .90). These indicators suggested that the selected scales as originally defined might not represent the most efficient set of child outcome instruments.
Construction of a New Measurement Model
Because of the low internal consistency of some measures and strong relationship between some scales, the SACD Consortium conducted a set of increasingly rigorous analyses to derive a more parsimonious set of outcome measures with better psychometric characteristics. The SACD Consortium determined that the best approach would be to conduct those analyses beginning at the individual item level, irrespective of the scale of origin, separately for each reporter. The analytic plans involved an exploratory analysis to empirically derive a measurement model with one randomly selected half-sample, followed by a series of confirmatory analyses to validate the model on the remaining half-sample and with increasingly conservative sets of validation parameters and criteria.
As a first step, principal axis factor analyses were conducted using SPSS to identify the underlying structure of the measurement tool.3. Individual items, rather than composite scale scores, were analyzed, using data from a randomly selected half of the baseline sample, and analyses were conducted via listwise deletion of missing values. Although a small number of measures were administered to more than one respondent group, most of the measures were administered to only a single group of respondents (see Table 1). Thus, teacher-report, primary-caregiver-report, and child-report items were factor analyzed separately. Theoretical (e.g., factor comprehensibility) and empirical (i.e., eigenvalues and scree plots) criteria were used to examine the solutions for each reporter generated using Promax rotation. Based on those examinations, different numbers of factors were extracted and those different solutions and item assignments to factors inspected. In comparing alternate factor solutions, consideration was given to conceptual clarity of the factors (i.e., whether the factors in a solution made intuitive sense), the nature and extent of cross-loading of items (i.e., how many and which items were assigned to more than one factor), whether some factors were defined by a very small number of items (or single items), and parsimony (i.e., the absence of multiple factors appearing to assess the same basic construct).
On the basis of these comparisons, the 75 teacher items, 59 primary caregiver items, and 91 child items were optimally represented by 5, 3, and 10 underlying factors, respectively. The five-factor teacher-report model resulted in an eigenvalue of 2.52 and accounted for 57.85% of the variance of the items. Selection of this solution was based on a clear visual break in the scree plot (and corresponding discontinuity in eigenvalues), and because this solution minimized the number of cross-loading items (i.e., items with a loading of .30 on more than one factor; Field, 2005) while keeping conceptually similar items within the same factor. For example, in the four-factor solution, items purportedly measuring ADHD symptoms were split across several other factors in a way that was not supported by previous literature. The three-factor primary caregiver-report model was selected for clarity of the factors, a minimized number of items that did not load strongly on any factor, and for a lack of cross-loaded items. For the three-factor model, the eigenvalue of 2.90 and the cumulative variance accounted for (34.90%) represented a clear break in the scree plot. The ten-factor child-report model represented the last clear break in the scree plot with an eigenvalue of 1.48 and variance accounted for (44.00%). Although an eigenvalue > 1.00 cutoff would have suggested 18 factors, the incremental increase in variance explained in each factor between 10 and 18 was extremely small. As well, the 10-factor solution had no conceptual anomalies (e.g., theoretically unrelated items loading onto the same factor), unlike other solutions examined. Based on those empirical and conceptual criteria, these factor solutions were considered to have the strongest justification to guide further measurement modeling.
A small number of items were dropped from the new measurement model at this stage because they did not produce a standardized coefficient ≥ 0.30 on any factor (Field, 2005). These were three teacher-rated and five primary-caregiver-rated conduct problem items, one primary-caregiver-rated aggression item, five child empathy items, two engagement with learning items, and one school connectedness item. Another small number of items (e.g., being suspended from school) had very low frequency of occurrence. As a result, these items had somewhat lower correlations with other items on the same factor. However, such items were retained if they loaded only on a single factor, were conceptually congruent with other items on the factor, and contributed to the reliability of the measure (i.e., their omission would not have increased the measure’s estimated internal consistency). The nine items that cross-loaded on multiple factors (i.e., items with standardized coefficients ≥ 0.30 on more than one factor) were included on the factor for which the loading was stronger. Seven of those items were from the teacher report (one aggression item, four ADHD symptomology items, and two social competence items). Two cross-loaded items came from the child’s report of school connectedness.
Factors representing two constructs (Altruistic Behavior and Problem Behavior) were identified for all three respondent groups. A factor representing a third construct (Positive Social Behavior) was identified for both teachers and primary caregivers, and a factor representing two highly related constructs was identified for children and teachers (Engagement with Learning and Academic Competence and Motivation, respectively). The remaining identified factors were specific to each respondent group: teacher-reported ADHD Symptomology and child-reported Approval of Aggression, Self-Efficacy for Peer Interactions, Empathy, Positive School Orientation, Negative School Orientation, Students Afraid at School, and Victimization at School. Each new factor, sources of items and internal consistency coefficients are shown in Table 3. Cronbach’s alphas for the 18 scales (given scale construction via equal weighting of each relevant item) ranged from 0.78 to 0.97, suggesting that the factor solutions produced scales with high internal consistency. Thus, the pool of items from the 22 original scales could be distilled into a smaller set of 18 coherent factors, with psychometrically problematic items removed and measurement error reduced.
Stability of the New Measurement Model
The exploratory nature of the above analyses raises the question of whether the identified set of empirically derived factors is specific to the randomly selected half of the baseline sample or provides a stable and reproducible measurement model. To address this question, a series of confirmatory analyses were undertaken to validate these factors with other samples and subsamples. First, the potential outcome measures identified in the exploratory analyses were subjected to confirmatory factor analyses in LISREL using the remaining half of the baseline data (the “validation” sample), again separately by reporter and employing listwise deletion of missing data.4 Following conventional measurement modeling techniques (e.g., Kline, 1998), each analysis estimated the fit of the proposed measurement structure to the validation sample’s data, including item loadings from the respective latent variables, correlations among latent variables, and error terms for the items. For example, the results for the primary caregiver survey reveal the degree to which the three factors (Positive Social Behavior, Problem Behavior, and Altruistic Behavior) explain variability in the 53 child behavior items to which the caregivers were asked to respond.
Results for each of the three confirmatory models tested indicated that the hypothesized factor structures provided a good fit to the validation sample’s data. Three indices of model fit available are reported here: the χ2/df ratio (for which smaller values indicate better fit; Kline, 1998) the Comparative Fit Index (CFI; for which values above 0.90 represent good fit; Bentler, 1990) and the Root-Mean-Square Error of Approximation (RMSEA; for which values less than 0.10 are desirable; Browne & Cudeck, 1992). For the 71 items in the teacher survey, the confirmatory factor analysis of five latent factors yielded a χ2/df ratio of 10.20, a CFI of 0.98 and an RMSEA of 0.090 (90% confidence interval [CI] = 0.089, 0.091). For the 53 primary caregiver items, the confirmatory factor analysis of three latent factors yielded a χ2/df ratio of 10.09, a CFI of 0.94 and an RMSEA of 0.087 (90% CI = 0.086, 0.088). For the 83 child items, the confirmatory factor analysis of 10 latent factors yielded a χ2/df ratio of 7.18, a CFI of 0.91 and an RMSEA of 0.060 (90% CI = 0.059, 0.061)5. These results confirm that the exploratory models (i.e., the 5-factor teacher, 3-factor primary caregiver, and 10-factor child models) generated using one half of the baseline data were also appropriate to explain relationships among item responses from the validation sample. Thus, the new factors appear to represent the data well across both halves of the baseline sample.
At this stage we also examined the patterns of intercorrelation among latent factors. For the five teacher-report factor the highest intercorrelations (ranging from absolute values of .36 to .87) were among Positive Social Behaviors, Problem Behaviors, Academic Competence and Motivation, and ADHD Symptomology. The Altruistic Behavior Scale was less strongly related to each of those (with correlations ranging from absolute values of .10 to .22). The Altruistic Behavior Scale behaved similarly in the primary caregiver report, with results suggesting minimal correlations (correlation < .15) with Positive and Negative Behavior. These two latent factors had a strong correlation of -.71. With a 10-factor child report solution, and 45 intercorrelations among latent factors, patterns are more difficult to discern. The strongest correlations (with absolute values ranging from .55 to .68) involved the Positive and Negative School Orientation factors and Engagement with Learning. Once again, the Altruistic Behaviors factor evidenced the least overlap with the remaining factors, correlating moderately (absolute value >.30) with only two factors: Empathy and Victimization at School.
Although some of the original selected measures had previously been extensively validated with different demographic groups (e.g., the BASC), most of the measures had not. The exploratory and confirmatory tests of the new measurement model above might mask potentially important differences in model fit for different subgroups or different program sites. In other words, the new measurement model might or might not work equally well with different populations. Given the demographic variability across sites (see Table 2), a series of multigroup comparisons were next conducted to examine the appropriateness of the measurement model for different groups defined by gender, race/ethnicity, and site-specific sample.
These comparisons were conducted via multigroup confirmatory factor analysis, which separates a sample into subsamples (e.g., boys and girls) and simultaneously tests the proposed measurement model on each group to determine whether the model fits each group’s data equally well. Following conventional methods (Bentler, 1995; Joreskog & Sorbom, 2001), these analyses were conducted by testing a series of nested models in which three different sets of estimated parameters (i.e., the factor loadings onto individual items, the covariances among latent factors, and the error variances) were constrained to be equal across groups. The most conservative model (i.e., in which all estimated parameters are constrained to be equal across groups) is considered to be overly restrictive and is unlikely to achieve adequate fit (e.g., Byrne, 1998). The fit of slightly less restrictive models, such as those that require only the factor loadings and factor covariances to be equal across groups, are considered more realistic indicators of measurement invariance across groups. The series of results is then inspected to determine the point at which the factor structure achieves adequate fit across subsamples. Each of the three reporter-specific models (teacher, parent/caregiver, and child) was examined separately using multigroup comparisons on groups defined by gender, race/ethnicity, and program site, resulting in nine multigroup confirmatory factor analyses.
As an example, the five-factor teacher-report model was tested for invariance across race/ethnicity (i.e., non-Hispanic White, non-Hispanic Black, Hispanic, and other). The completely restrictive model (which tests the model fit if all parameters are constrained to be equal for the four race/ethnicity groups), was a relatively poor fit to the validation sample data. Although the χ2/df ratio for that model was 5.93, the CFI was 0.69 and the RMSEA was 0.14. The next model tested was the slightly less conservative, but more realistic, model in which the factor loadings onto items and factor covariances were constrained to be equal (i.e., the error variances were allowed to vary across groups). This model evidenced adequate fit to the data, with a χ2/df ratio of 0.48, a CFI of 1.00 and an RMSEA of < 0.01. The χ2-difference between the two models was significant [χ2 (213) = 54,940.73, p < .001], indicating an improvement in fit with the release of the unrealistic restriction. Thus, the five teacher-report factors represented the data from children of different racial/ethnic groups equally well, allowing for measurement error to vary across those groups.
In all nine of the multigroup comparisons, this pattern was found, and thus the measurement models were found to adequately represent the data across the variety of subgroups tested. In summary, while a completely restrictive model did not fit the data well, the more realistic model in which all factor loadings and factor covariances were constrained to be equal (but error variances were allowed to differ across groups) was a significant improvement over the completely restrictive model and provided a good fit to the multigroup data (all χ2/df ratios were < 3.90, all CFIs were > 0.92 and all RMSEAs were < 0.08 for the less restrictive second models, and all χ2-difference tests were significant between first and second models). The basic measurement model therefore proved to be invariant across child gender, across child race/ethnicity, and across sites.
Finally, we examined the stability of the measurement model over time by comparing the confirmatory factor and multigroup confirmatory analyses from data at baseline with data collected 9 months later (in the spring of 2005, after one academic year of intervention) and 21 months later (in the spring of 2006, after two academic years of intervention). The confirmatory factor analyses revealed that the measurement model fit the baseline, 9-month, and 21-month data equally well. Multigroup analyses also indicated that, as with the baseline data, the measurement model tested using the 9-month and 21-month data were robust across subsamples based on child gender and race/ethnicity, and program site. In summary, these multigroup comparisons provide strong evidence that the factor structure does not vary significantly across the different demographic and geographic characteristics of the population represented by the sample in this study.
Convergent Validity
The 18 scales shown in Table 3 represent the final set of child outcome measures as reported by the children, their primary caregivers, and their teachers. As can be seen, a few similar outcome constructs (e.g., Altruistic Behavior, Positive Social Behavior, and Problem Behavior) were identified from more than one respondent group. The next step was to investigate the extent of construct convergence across respondents in the commonly measured outcomes. In other words, is the primary caregiver report of altruistic behavior assessing the same construct as the child report of altruistic behavior? A multitrait, multimethod confirmatory factor analysis (Marsh & Grayson, 1995) was thus designed to identify the commonalities across reporters. Such an analysis would not only further validate the measurement model by showing similarity of constructs, but would also distinguish construct variance (i.e., variability in children’s scores due to actual differences in children’s behavior) from systematic variance due to the respondent (e.g., primary caregivers’ general perceptions of their child) and random measurement error.
Outcome Measures Derived From Item-Level Exploratory Factor Analyses (by Reporter) of Baseline Data
| Reporter Factor | Source of Items | Cronbach’s alpha |
|---|---|---|
| Child Self Report | ||
| Altruistic Behavior | 8 items from Altruism Scale | 0.88 |
| Problem Behavior | 6 items from Frequency of Delinquent Behavior scale and 6 items from Aggression scale | 0.86 |
| Engagement with Learning | 4 items from Engagement vs. Disaffection with Learning Scale | 0.84 |
| Approval of Aggression | 8 items from Normative Beliefs About Aggression scale | 0.83 |
| Self-Efficacy for Peer Interactions | 12 items from Children’s Self-Efficacy for Peer Interaction scale | 0.83 |
| Empathy | 11 items from Children’s Empathy Questionnaire | 0.78 |
| Positive School Orientation | 9 items from Sense of School as a Community and 1 item from Feelings of Safety at School | 0.86 |
| Negative School Orientation | 4 items from Engagement vs. Disaffection with Learning scale and 4 items from Sense of School as a Community scale | 0.78 |
| Students Afraid at School | 4 items from Feelings of Safety at School scale | 0.79 |
| Victimization at School | 6 items from Victimization scale | 0.86 |
| Primary Caregiver Report | ||
| Altruistic Behavior | 8 items from Altruism Scale | 0.88 |
| Problem Behavior | 12 items from BASC Aggression subscale, 6 items from BASC Conduct Problems subscale, and 2 items from the Responsibility scale | 0.86 |
| Positive Social behavior | 6 items from Responsibility Scale and 19 items from Social Competence scale | 0.93 |
| Teacher Report | ||
| Altruistic Behavior | 8 items from Altruism scale | 0.89 |
| Problem Behavior | 14 items from BASC Aggression Subscale, 7 items from BASC Conduct Problems Subscale, and 2 items from Responsibility scale | 0.95 |
| Positive Social Behavior | 6 items from Responsibility scale and 19 items from the Social Competence scale | 0.97 |
| Academic Competence and Motivation | 5 items from Academic Competence and Motivation scale | 0.95 |
| ADHD Symptomology | 5 items from DSM-IV Criteria for ADHD and 5 items from IOWA-Conners | 0.91 |
Of the 18 outcome measures derived from the exploratory and confirmatory analyses above, only those assessing observable child behaviors, for which multiple reporters were possible, were appropriate for inclusion. Measures of children’s personal attitudes, affective states, and perceptions of the school environment were not appropriate, leaving 11 behavioral scales to be analyzed in a multitrait, multireporter model. This analysis tested the fit of the data from the 11 scales to a model including “Reporter” latent variables (child, primary caregiver, and teacher) to represent variability common across child behaviors assessed by the same respondent, and “Construct” latent variables (Problem Behavior, Positive Social Behavior, and Altruistic Behavior) to represent variability common across respondents about the same child behaviors. Each of the scales would have two paths, one from the relevant Reporter latent variable and one from the relevant Construct latent variable.
Despite repeated attempts and providing starting values for the iterative estimation procedures, we were unsuccessful at achieving convergence on a solution for a completely explanatory model. However, convergence and acceptable fit were attained with a model that included the three Construct latent variables and two of the three Reporter latent variables and allowed the error variances of the teacher-reported measures to be correlated.6 This model produced acceptable fit statistics (χ2/df ratio = 2.26, CFI = 0.99, RMSEA = 0.03). In addition, all path weights were significantly different from zero and in the expected direction. Inspection of the relative influence of Construct and Reporter latent variables on the measures revealed no discernable pattern. For some measures, the Reporter path value was greater than the Construct path value; for other measures, the reverse was true. No reporter’s influence appeared to dominate across all three Construct latent variables. Thus, measures of child behavior were affected by both the behavior construct being assessed and by the person reporting on that behavior.
Discussion
To evaluate the effects of the seven SACD programs, a comprehensive assessment battery was developed from a combination of published and newly developed instruments and administered to elementary school students and their teachers and primary caregivers. A series of increasingly rigorous analyses, which included the examination of the scales’ psychometric properties and exploratory and confirmatory factor analyses, were conducted to validate and optimize the reliability of the outcome measures. These analyses distilled the individual items from 22 scales of children’s attitudes, perceptions, and behaviors into a set of 18 reliable and valid outcome measures. The original assessment battery that included 75 teacher items, 59 primary caregiver items, and 91 child items was optimally represented by 5, 3, and 10 underlying factors, respectively.
These measures thus provide empirical benchmarks by which outcomes of the school-based SACD initiative on elementary school students can be monitored. Specifically, the outcomes identified and validated were measures of children’s: problem behaviors; altruistic and other positive social behaviors; symptoms of inattention, overactivity, and impulsivity; academic competence, motivation, and engagement; positive and negative school orientation; empathy; perceptions of school safety and connectedness; and beliefs about the acceptability of aggression. These outcome measures may be of interest to school administrators and other school-based programs intending to promote social and emotional competence, increase positive behavior, decrease negative behavior, promote a positive school climate, and support student academic achievement (Greenberg et al., 2003; Mansfield, Alexander, Farris, & Westat, 1991).
This process and the resulting measures also offer new knowledge and lessons learned to others who are involved in evaluating similar programs. In the exploratory analyses, 17 of the original 225 items were dropped from remaining analyses due to lack of consistency with other items even from the same original scales. While the dropped items only represent 7.5% of the total, for some measures the dropped items represented 30-50% of the items from the original full scale. The other notable change from the measures as previously published was that 8 of the 18 validated factors contained items from multiple scales. This suggests a degree of redundancy among the measures originally selected or created. The extent to which items were dropped or combined with items from other scales to form the final validated factors means that most of the measures required some adjustment during this validation process.
The SACD Consortium’s evaluation strategy and subsequent analyses suggest that while it is considered good science to select outcome measures based on previously published and validated scales whenever possible, such choices do not guarantee that a measure will be appropriate in its entirety, for a particular situation, or in combination with other closely related scales. Although we are not suggesting that school-based program evaluations routinely incorporate the level of analytic examination described here or pick and choose items from previously validated measures, basic steps to investigate the utility and validity of existing measures for the population and intervention of interest can usually be undertaken. At minimum, internal consistency coefficients for groups of items and bivariate correlations among measures should be computed with baseline data. If there are noticeable discrepancies with previously published validity and reliability estimates for measures, or correlations suggest unexpected patterns of relationships or a substantial degree of overlap, further investigation is warranted. The inclusion of a large number of measures that tap a variety of constructs may be necessary to fully assess a complex model that guides the development and evaluation of interventions, such as the SACD programs. However, sizable assessment batteries have a cost in terms of project resources, a school’s ability and willingness to continue participation across time, and participant fatigue. More efficient measurement of outcomes will allow programs to optimize resources spent on evaluation.
This process also highlights the value in obtaining data from multiple reporters of constructs whenever possible. Consistent with the examination by others (Kraemer et al., 2003; Noordhof et al., 2008), the results from the multitrait, multimethod analysis suggest that reports of child behaviors are influenced not only by the behavior being reported upon, but also by the reporter. It is important to acknowledge that we cannot know from the current analyses what the variance attributable to reporter truly represents. Reporter variance might represent unwanted reporter bias, such as if children felt compelled to give socially desirable responses, if primary caregivers reported based on a particular positive or negative view of their children, or if teachers reported based on only the salient behaviors that rise to their attention over and above the behaviors of the child’s classmates. Alternatively, variance attributable to reporter might reflect real behavioral differences associated with the different types of information available to each respondent when rating behaviors (Coie, Lochman, Terry, & Hyman, 1992; Keiley, Bates, Dodge, & Pettit, 2000). For example, primary caregivers and teachers likely differ in their overall familiarity with the child, in the amount of time they spend directly observing the child, and in the nature of the situations in which they are able to observe the child’s behavior. These differences in available information are quite likely to influence their judgments about the child’s characteristics and how they rate the child’s behavior. Thus, systematic variance between respondents may not necessarily be indicative of error in observation, recollection, or reporting, but may represent actual differences in child behavior across multiple contexts. Single-respondent reports of child behavior are unlikely to capture accurately the complexity of different child behavior types in different situations and under different circumstances, and therefore unlikely to assess the potential full impact of an intervention.
This process unexpectedly revealed an important finding regarding the inclusion of measurement of altruistic behaviors. Such behaviors are included in evaluations of child behavioral interventions less often than aggressive, delinquent or disruptive behaviors. Our collective experience suggests this is partially due to the historically prevailing deficit-based approach to prevention, and partially due to a relatively common belief that prosocial behaviors are merely the converse of antisocial behaviors. Based on the consistently low correlations of the Altruistic Behavior factors (in child, primary caregiver, and teacher report) with other factors, we have documented that prosocial behaviors, such as helping or sharing, are a distinct set of behaviors. These results provide strong evidence that by not including measurement of prosocial behaviors, evaluations of child behavioral interventions will miss an important, unique aspect of children’s behavior and possible program effects.
As with any study, limitations exist in the data and in the analyses conducted to model those data. The data included here are representative of students in public schools similar to those that each funded site successfully recruited into an evaluation of school-based SACD programs. The data also reflect the characteristics and behaviors of third-grade students whose primary caregivers provided informed consent to participate in the research. While the site-specific samples appear to be relatively diverse demographically, we cannot know the extent to which these results generalize beyond the population represented by the sample included here.
Although observational measures of school and classroom-level variables were included in the overall SACD evaluation, they were not used in the assessment of individual child behavioral outcomes. Thus, the process described here includes only a set of surveys administered to children, primary caregivers and teachers. We do not know the extent to which the results would generalize to other common modes of data collection for children in this age range, such as naturalistic observation, laboratory tasks, or peer reports. However, the final model tested using all three reporters’ data suggests only a moderate degree of correlation among child behavioral ratings obtained from self report, teacher report and primary caregiver report. Future research could include other modes of data collection to help elucidate the degree to which reporter differences are based on actual behavioral differences in different contexts (e.g., home vs. school) or on biased reporting.
With respect to the analyses, we acknowledged and took into consideration the controversy over the use of exploratory analytic methods (e.g., Fabrigar, Wegener, MacCallum, & Strahan, 1999; Hurley et al., 1997). We specifically designed the extensive set of confirmatory analyses to overcome many of the concerns and limitations of data-driven strategies. The measurement model was first validated on a sample whose data were collected concurrently with the data from the exploratory analyses, to assure that the model was not specific to a particular sample. Next, measurement invariance was confirmed across subgroups defined by gender, race/ethnicity, and program site. The confirmatory and multigroup confirmatory analyses were then repeated using data collected at 9 and 21 months after baseline. Analyses were also conducted to rule out anomalous findings with respect to different statistical assumptions regarding treatment of missing data and decisions made based upon the use of different statistical software packages. Finally, more complex multitrait, multimethod analyses investigated the extent of convergent validity of the constructs across reporter and highlighted the influence of reporter on child behavior outcome measures. Few single scales receive this degree of statistical scrutiny, and we are aware of no equally rigorous examination of a collection of scales. The typical arguments against exploratory analyses, such as the question of generalizability (or specificity) of the results, are believed to have been adequately addressed by the confirmatory analyses.
As highlighted by recent guides and reviews (e.g., U.S. Department of Education, 2002; Hahn et al., 2007), school-based interventions have the potential to improve some children’s social, behavioral, and academic functioning. Without valid and reliable indicators of outcomes, school systems cannot determine whether intervention resources are being invested wisely. Accordingly, the use of theoretically meaningful and empirically sound assessments in the evaluation of these interventions is essential to monitoring outcomes and informing modifications of the programs. Relying on a measure’s performance in past research, may not provide the most valid, reliable, or efficient method for assessing outcomes.
Authorship Notes
The findings reported here are based on research conducted as part of the Social and Character Development (SACD) Research Program funded by the Institute of Education Sciences (IES), U.S. Department of Education, under contract ED-01-CO0039/0006 to Mathematica Policy Research (MPR), Princeton, NJ, in collaboration with the Centers for Disease Control and Prevention’s Division of Violence Prevention (DVP), and the recipients of SACD cooperative agreements. The SACD Consortium consists of representatives from IES, DVP, and the national evaluation contractor (MPR), and each cooperative agreement site participating in the evaluation. Research institutions in the SACD program (and principal researchers) include: IES Amy Silverman, Edward Metz, Elizabeth Albro, Caroline Ebanks; DVP Tamara M. Haegerich (previously, IES), Corinne David-Ferdon, Le’Roy Reese (Moorehouse School of Medicine; previously DVP); MPR Karen Needels, John A. Burghardt, Heather Koball, Laura M. Kalb, Peter Z. Schochet, Victor Battistich (University of Missouri—St. Louis); Childrens Institute Deborah B. Johnson, Hugh F. Crean; New York University J. Lawrence Aber, Stephanie M. Jones (Harvard University), Joshua L. Brown (Fordham University); University at Buffalo, The State University of New York William Pelham, Greta M. Massetti (CDC), Daniel A. Waschbusch; Oregon State University Brian R. Flay, Carol G. Allred (Positive Action), David L. DuBois (University of Illinois at Chicago), Michael L. Berbaum (University of Illinois at Chicago), Peter Ji (University of Illinois at Chicago), Vanessa Brechling, (University of Illinois at Chicago); University of Maryland Gary D. Gottfredson, Elise T. Pas, Allison Nebbergall; University of North Carolina at Chapel Hill Mark W. Fraser, Thomas W. Farmer (Penn State University), Maeda J. Galinsky, Kimberly Dadisman; and Vanderbilt University Leonard Bickman, Catherine Smith.
The authors wish to thank the Consortium reviewers who commented on earlier drafts of this article. The findings and conclusions in this report are those of the authors and do not necessarily represent the official position of the Institute of Education Sciences, Centers for Disease Control and Prevention, Mathematica Policy Research, Inc., or every Consortium member, nor does mention of trade names, commercial products, or organizations imply endorsement by the U.S. Government.
Notes
Data analyses for all 3 years of the SACD evaluation will be reported in a publication authored by the SACD Research Consortium and released by Institute of Education Sciences (IES), U.S. Department of Education. Slight variation in the reported data and statistics in this article and a future publication may result from small differences in the dataset used for this article and the final dataset for this multisite evaluation.
Per the SACD Restricted Data Use Agreement, all unweighted, disaggregated samples sizes are reported as rounded to the nearest 10 (e.g., 194 would be rounded to 190).
We thank an anonymous reviewer for the suggestion that the extent of clustering (i.e., by classroom or school) could be examined and accounted for by reanalysis with currently available software. While we are unable to do so for the measurement model, potential effects of the clustering of data are being accounted for in the actual outcome analyses (articles in process).
Although missing responses to individual survey items were infrequent (≤ 5% of responses were missing for any item), and missing item-response data did not appear to vary systematically, missing data might have influenced the results of the confirmatory model testing in unknown ways. Thus, the confirmatory analyses were also conducted with a dataset in which missing item responses were imputed using the Expectation-Maximization (EM) algorithm (Dempster, Laird, & Rubin, 1977), which calculates the most likely response to a missing item based on how that respondent answered other items. As expected, in each of the confirmatory analyses the use of EM imputation resulted in a fit as good as, or better than, models that were tested using listwise deletion.
The fit index values reported throughout were obtained via LISREL. For the same model and same data, LISREL and EQS (Bentler, 1995) will produce the same normal theory chi-squared and RMSEA values, but produce different measures of relative fit (such as the CFI), which are calculated based on the independence model (Schumacker & Lomax, 1996). To investigate the effects of this assumption, confirmatory analyses were repeated via EQS, resulting in similar conclusions of adequate fit of the models to the data. Thus, the measurement models were robust to the different statistical techniques used and assumptions employed by these two software packages.
The only difference between this successful model and the ideal model is whether the common variance shared only by teacher-reported child behaviors (i.e., not attributable to latent behavioral constructs) is attributable to a single source (modeled by a single Teacher Report latent variable in the ideal model) or to multiple sources (modeled by multiple intercorrelated error variances in the successful model). Although this distinction is important in a full structural model, it makes little difference for the purpose of examining common construct variance among the outcome measures to be used in the SACD evaluation.

