This social network study explores the formation and evolution of partnerships for designing equity-focused principal preparation programs (PPPs), “connecting the dots” across various stakeholders. Using the Equity-Centered Pipeline Initiative (ECPI) in the United States as a case context, the study documents how diverse actors from school districts, universities, state education agencies and community organizations developed relational infrastructures to co-design programs that advance educational equity.
Primarily guided by boundary crossing and social network perspectives, this exploratory study examines longitudinal data collected in three waves from 2022 to 2023. Specifically, we use descriptive and inferential techniques, including sociograms, cohesion and centrality metrics, and stochastic actor-oriented models (SAOM), to map the structure and dynamics of the ECPI network.
The ECPI network evolved from a loosely connected set of early partnerships, largely between university representatives and technical assistance providers, into a more cohesive, inclusive and interconnected system. Over time, district actors emerged as central brokers. The findings also show increasing network density, reduced fragmentation and the growing integration of state agencies and community organizations. SAOM results underline the influence of both endogenous/internal factors (e.g. reciprocity, transitivity) and exogenous/external ones, particularly role homophily (i.e. individuals with the same role tended to collaborate with each other), in shaping partnership dynamics.
While the purposive sampling strategy used in this study captures central organizational actors, it may have excluded the voices of underrepresented groups, particularly those from community organizations. This study's quantitative approach illuminates structural patterns but cannot fully account for relational depth, such as trust or power dynamics. Future research should integrate qualitative data to enrich the understanding of cross-sector collaboration. Nonetheless, this exploration captures how partnerships within a professional network formed and evolved.
The current study advances scholarship on educational leadership preparation by integrating social network perspectives with boundary-crossing concepts. It conceptualizes PPPs as boundary objects that mediated collaboration across professional domains and institutions. This exploration provides empirical evidence on how cross-role relationships were cultivated and developed to understand the structural and relational capacities shaping educational equity reforms.
Introduction
Educational reform efforts increasingly rely on cross-sector partnerships to address complex challenges such as educational inequity. In the United States, as schools confront persistent disparities, there is growing recognition that sustainable improvement requires collaborative efforts across institutional boundaries (Finnigan and Daly, 2012; Herman et al., 2022; Awaludin, 2025b). However, this work is challenging because partners must navigate differing institutional logics, accountabilities and resource dependencies (Friedland, 1991; Pfeffer and Salancik, 2015). Meaningful interaction across professional domains, i.e. a process known as boundary crossing, thus becomes essential. It enables diverse actors to co-create shared problem definitions and coordinate expertise, thereby fostering the collective action necessary to advance equity goals (Awaludin, 2025b).
Drawing on boundary crossing and social network perspectives (Borgatti and Halgin, 2011; Akkerman and Bruining, 2016), this study examines how diverse actors engage in such collaborative work within the Equity-Centered Pipeline Initiative (ECPI). We argue that its principal preparation programs (PPPs) function as boundary objects, shared artifacts that facilitate a common space for school districts, universities and state agencies to co-construct equity-focused programming. While research (e.g. Molle et al., 2025) has shown that partnerships can be pivotal for systemic change, we know relatively little about the underlying relational dynamics that enable them to form, evolve and function over time.
To investigate these dynamics, this research uses social network analysis (SNA) as its analytical lens. Although prior scholarship demonstrates how network analyses can reveal hidden dimensions of educational leadership (Pitts and Spillane, 2009; Liou and Daly, 2018), the approach remains underutilized in leadership preparation research in that less than 1% of the scholarship used SNA (Awaludin, 2024). This study addresses that methodological gap by using network perspectives not merely as a descriptive tool, but as an explanatory framework to map the structural development of the relationships that underpin systemic reforms.
The primary question of this study is: How did relationships among different actor roles within the ECPI network form and evolve to support the co-design of equity-centered principal preparation programs? The sub-questions include: Where were school district and university actors positioned within the network? How did they cross role boundaries to connect with others from different organizations? Given the initiative's emphasis on district-university collaboration (Molle et al., 2025), we focus particularly on how actors from these two institutional types were positioned and connected. Using longitudinal social network data from 2022 to 2023, we analyze network cohesion, centrality and co-evolution to trace how collaborative ties developed. The findings provide empirical insight into the relational mechanisms of educational change, thus contributing to both organizational theory and network scholarship.
Research setting
The ECPI is funded by the Wallace Foundation in the United States and aims “to support districts, working with their university and state partners … to develop principal pipelines that can produce and support equity-centered school leaders” (Wallace Foundation, 2021, p. 1). This initiative incorporates a framework of seven domains, including (1) evidence-based leader standards, (2) principal preparation programs, (3) selective principal hiring and placement, (4) evaluation and support, (5) growth-oriented supervision, (6) leader tracking systems and (7) sustainability mechanisms (Wallace Foundation, 2021). For the current study, however, we focus on the second domain only: principal preparation programs.
The ECPI included eight urban school districts across Washington, D.C. and seven states: California, Kentucky, Maryland, North Carolina, Ohio, Oregon and Texas. They worked with 16 regional universities to co-develop equity-based PPPs. Together with state education agencies, Wallace Foundation officers, technical assistance (TA) providers and community organizations, they formed a 70-organization network that spanned 21 states. School districts led implementation as grant recipients, universities contributed program avenues, state agencies ensured policy alignment and scaling, TA providers supported implementation and evaluation, community groups secured local relevance and the Foundation managed grants and learning networks. Collectively, these actors formed “district partnership teams” (DPT), an ecosystem where policy, practice, research and community voices converged.
Conceptual underpinnings
This study provides an explanatory account of the network capacities among actors in the ECPI by tracking how their collaborative relationships formed and evolved. To achieve this, we employ a conceptual framework centered on organizational theories as our primary analytical lens. While we draw on high-level concepts of inter-organizational boundaries, our primary goal is to establish the context in which these networks operated.
The inter-organizational context: a landscape of boundaries and dependencies
Partnerships like the ECPI are complex inter-organizational systems. Each participating entity (e.g. university, district, community organization) operates according to its own institutional logic, a distinct set of guiding principles, values and norms that shape its goals and practices (Friedland, 1991). For instance, a university's logic often prioritizes research and teaching timelines, as well as theoretical rigor, while a school district's logic is driven by immediate practical applications and accountability metrics. This diversity creates boundaries that refer to “sociocultural differences that give rise to discontinuities in interaction and action” (Akkerman and Bakker, 2011, p. 139). These are not abstract barriers but tangible hurdles that complicate communication and goal alignment.
However, the existence of these boundaries is counterbalanced by a powerful incentive to collaborate: resource interdependence. Resource dependency theory posits that organizations are not self-sufficient and must engage in exchanges with their environment to acquire necessary resources (Pfeffer and Salancik, 2015). In the ECPI, the partners are mutually dependent. Universities require districts for access to aspiring leaders and for the practical application of their research. Districts need universities for their expertise in program design and leadership development. Both may rely on foundations for funding, political capital and legitimacy. This mutual dependency compels organizations to engage with one another despite the friction caused by their differing institutional logics (Pfeffer and Salancik, 2015). This complex context, which is continuously shaped by both the divisive force of institutional boundaries and the unifying pull of resource interdependencies (Pfeffer and Salancik, 2015), is the necessary starting point for analyzing the network of relationships that bridges them.
Within this context, we focus on observable relational activities. We use the term “boundary crossing” to refer to the general act of individuals navigating across different professional or organizational domains (Akkerman and Bakker, 2011). In addition, we are interested in “boundary spanning,” a strategic behavior that involves linking different groups and transferring information between them (Williams, 2002). Individuals who frequently engage in this behavior are “boundary spanners” or brokers. In a network analysis, these individuals are not identified by their titles but by their structural position in the web of relationships (Rawlings et al., 2023). Another locus we explore is “boundary objects,” shared tools, documents or goals; they can be understood as focal points that facilitate and sustain ties between otherwise disconnected actors (Star and Griesemer, 1989). These concepts provide a vocabulary to describe the functions of the network ties we aim to measure.
Social networks: explaining the structure and evolution of collaboration
While organizational concepts help frame the setting, social network perspectives provide the explanatory power for our study. This conceptual approach allows us to move beyond anecdotal descriptions of collaboration to a quantitative analysis of its underlying structure. By mapping the patterns of interaction, we can explain how the ECPI network developed its capacity for information sharing and joint work (Daly, 2010; Molle et al., 2025). The core premise is that the structure of relationships, not just the attributes of individuals, is a primary driver of outcomes in a system (Borgatti and Halgin, 2011). Our study uses this lens to construct a structural and dynamic account of the PPP partnership, an area that has gained growing scholarly attention in the last 6 decades (Awaludin, 2025a).
To do this, our quantitative analysis focuses on three key dimensions derived from social network lenses:
Cohesion: This approach measures the density and interconnectedness of the network. It allows us to explain the overall level of collaboration and potential for information to flow efficiently through the system (Moody and White, 2003).
Centrality: This measure identifies the structural prominence of specific actors. By calculating centrality scores, we can quantitatively identify the key boundary spanners who are essential for holding the network together and connecting disparate groups of participants (Das et al., 2020).
Co-evolution: This analysis is the core of our explanatory approach in that it allows us to model the evolution of the network structure and identify periods of growth, stabilization or fragmentation in the collaborative effort (Daly and Finnigan, 2011). Through dynamic network analysis, we can track how relationships form and change over time (Snijders, 2017).
In summary, this study uses organizational concepts of boundaries as a contextual backdrop while its main analytical work is done through social network concepts; they provide the tools to quantitatively describe and explain how the ECPI network was structured and how that structure evolved. This approach allows us to assess the partnership's network capacities by focusing directly on its measurable relational dynamics.
Methods
This social network study uses an exploratory design because it examines a newly convened partnership network created through this initiative, not because partnership networks are conceptually new. Exploratory research is appropriate when relationships are forming and unsettled (Stebbins, 2001). In this evolving network, districts, universities and support organizations are configuring how to coordinate, share expertise and sustain equity-focused work.
Data
We designed an original social network survey asking the ECPI actors with whom they worked when designing equity-centered principal preparation programs. The surveys were administered in March 2022 (Time 1/T1), January–March 2023 (T2) and October 2023 (T3). Our sampling strategy is purposive in that we targeted key, knowledgeable individuals in the network (Creswell and Clark, 2017), informed by the Wallace Foundation and district project leaders. We chose this strategy to track the evolving structure of the network by capturing the dynamic nature of collaborations within and across district-university partnerships. This approach gave us a longitudinal view of how the network evolved across periods.
At T1, 110 participants took the survey across all organizations; these participants represented various roles, including school district administrators, university professors, TA providers, program officers and community organization members. Furthermore, at T2, there were 139 participants. And, finally, at T3, there were 194 participants. This increasing number of participants indicates the growth of the ECPI. The response rates were 71%, 62% and 89%, respectively, which align with norms for targeted sampling approaches used in collecting egocentric network data and are considered adequate for conducting SNA (Perry et al., 2018).
Originally, the survey consisted of 14 items encompassing the seven ECPI pipeline domains. For this study, we used two of them related to this study's domain of interest: PPPs, resulting in two network datasets; the items read: (1) “Who did you work with to systematically improve candidate access to principal preparation programs?” and (2) “Who did you work with to strengthen the emphasis on equity in principal preparation programs?” Other items are on the larger pipeline work domains beyond PPPs, such as principal hiring, supervision, and tracking system. The survey item draft was consulted with practitioners and experienced district administrators to improve its face validity and contextual relevance. Furthermore, when taking the survey, the respondents were given a list of actors in a respective organization and a drop-down name list (name generator), including all identified leaders in the ECPI network. This type of survey is called a constrained-saturated model (Scott, 2013), wherein every participant was given a roster containing the names of the ECPI actors.
Analytical strategy
Here, we detail the analytical methods to examine the structural dynamics and interactions within the ECPI network. As the data comes from two interrelated survey items, resulting in two network datasets, we combined the two into one; this way gave us one unionized network. Descriptive and inferential approaches were used to assess network sociogram, cohesion, centrality and co-evolution over the three periods from 2022 to 2023. The remaining part explains how these network measures inform the broader inquiry into boundary crossing.
Firstly, we created sociograms or network graphs to visualize the network structure and interactions, which provide graphical abstractions of the boundary-crossing relationships among ECPI actors. These visualizations illustrated the network's evolution to map the presence of clusters and connectivity patterns (Scott, 2013). Secondly, we calculated network cohesion metrics to measure the network's interconnectedness and structural characteristics. In this analysis, following Woodland and Mazur's (2019) and Hatch et al.’s (2020) approaches, we included basic network attributes, such as the number of organizations, actors and connections, alongside density (proportion of realized ties among all possible), clustering (extent to which nodes form tightly knit groups) and fragmentation (extent to which the network splits into disconnected components).
Thirdly, we employed network centrality measures to examine the prominence and roles of individual actors (Freeman et al., 1991). These measures show how school district and university actors positioned themselves and influenced boundary-crossing interactions. Eigenvector centrality identifies actors tied to other influential nodes, signaling their importance in maintaining network structure. Betweenness centrality measures how actors brokered connections across the network. Degree centrality captures the frequency of dyadic interactions between roles (e.g. university-district ties).
Lastly, for inferential analysis, we used the stochastic actor-oriented models (SAOM) to explore the co-evolution of the network. For this, we followed Daly and Finnigan's (2011) and Hatch et al.’s (2020) strategies that also used SAOM. Co-evolution refers to the simultaneous and interdependent evolution of a network and an individual-level attribute (in this case, organization and role) (Snijders, 2017). The analysis is to reveal changes in network evolution rates across the three observation periods. Furthermore, we examined both endogenous and exogenous factors that influence network dynamics. Endogenous factors, such as reciprocity, transitivity, outdegree and out-isolate, capture internal structural patterns and actor interactions. On the other hand, exogenous factors, including organization and role homophily or similarity effects, assess how external characteristics of actors influence partnership formation. By examining these factors, researchers and practitioners alike can gain insights into how the ECPI actors cross traditional role-based or organizational boundaries. Together, these analytical methods provided a useful approach to understanding the ECPI network's evolution and the dynamics of its interactions.
Results
Descriptive statistics
Regarding descriptive statistics, we used three main analyses. First, we constructed sociograms to visualize boundary-crossing activities among ECPI actors. Second, we calculated network cohesion measures, including attributes (number of organizations, actors, connections), density, clustering and fragmentation. Lastly, we examined network centrality using eigenvector, betweenness and degree centrality.
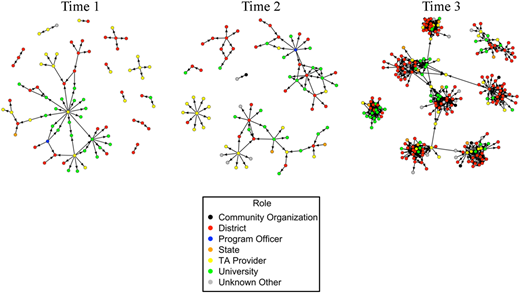
Sociogram. Figure 1 presents sociograms across the three periods. Over time, red and green bubbles, representing school district and university actors, dominated the network. At Time 3, the network clustered into eight groups, corresponding to the eight district partnership teams.
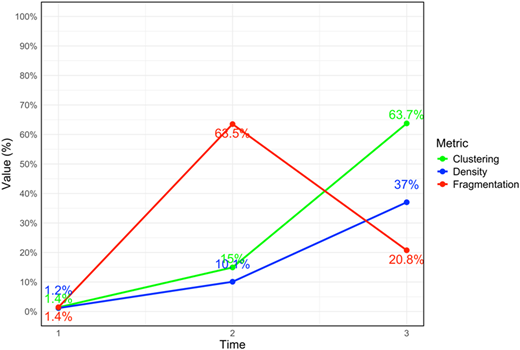
Cohesion. Initially, at Time 1, the network comprised 44 organizations with 81 actors and 76 connections (Mean = 1.877 connections, Max = 15 connections, Min = 1 connection, SD = 2.088 connections; note: the dominator is actors); this indicates a nascent collaboration stage. The network exhibited low density (1.2%), suggesting limited actor connections. Similarly, clustering was minimal at 1.4%, reflecting a low tendency for actors to form tightly knit groups. The network's fragmentation was also at 1.4%, highlighting a relatively dispersed structure. By Time 2, the number of organizations and actors decreased to 31 and 80, respectively. Still, the network became slightly more interconnected, with connections increasing to 90 (Mean = 2.25, Max = 10, Min = 1, SD = 2.161), the density at 10.1% and the clustering rising to 15%. This made the network more tightly knit compared to the previous periods. However, fragmentation increased significantly to 63.5%, suggesting the network had become more divided with isolated clusters.
Finally, at Time 3, the network expanded substantially to include 57 organizations, 236 actors and 804 connections (Mean = 6.814, Max = 31, Min = 1, SD = 6.779). The density continued to increase to 37%, and the clustering also jumped to 63.7%. Moreover, the fragmentation decreased to 20.8%. These metrics indicate a significantly more interconnected, cohesive and less fragmented network. During this period, we also found that the diversity of partnerships increased because of more interactions with actors from community organizations and state agencies. Taken collectively, these cohesion metrics showed that there was growing cohesiveness, interconnectedness, and fragmentation in the ECPI network, which had been reduced over time (Figure 2).
Centrality. We further measured the network centrality by focusing on the eigenvector, betweenness, and degree (see Table 1). Using these measures, we examine shifts in influence, brokerage roles and boundary-crossing connections across three periods. The results show how districts, universities, state agencies and community organizations shaped the network's evolution.
Popularity. The analysis of eigenvector centrality reveals shifts in influence among key actors. Throughout the periods, school district and university actors emerged as highly central players. Particularly, at Time 1, they had eigenvector scores of 23 and 21, respectively. This indicates that actors in these roles were well-connected to other influential actors. At Times 2 and 3, district and university actors contributed to connecting with influential actors. However, by Time 3, state agencies began to emerge as moderately central actors (2.097).
Brokerage. Furthermore, we calculated the network's betweenness centrality to locate who played the network's brokerage or boundary spanner roles. District actors, initially nonspanners with a betweenness score of 0, gradually took on more significant bridging roles, with their score increasing to 0.037 by Time 3. This evolution suggests that district actors became critical intermediaries by facilitating connections among other organizations as partnerships matured. Actors from state agencies, similarly, began to exhibit brokerage potential at Time 3 (0.012).
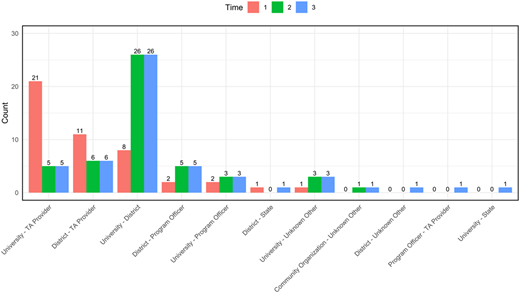
Dyad. Finally, we examined boundary crossing among actors from different roles using degree centrality measures by counting the number of connections within each dyad (Figure 3). In general, university and school district actors played central and enduring roles over the course of three periods by engaging in sustained boundary-crossing interactions. The university-district partnerships were consistently strong, maintaining 26 connections at Times 2 and 3, showing their foundational role in the ECPI network. Early reliance on TA providers facilitated initial boundary crossing, as reflected in the university-TA provider partnerships (21 connections) during Time 1; however, this collaboration sharply declined to 5 connections at both Times 2 and 3, indicating a shift in network dynamics. Meanwhile, emerging collaborations with community organization actors, with 3 connections at Times 2 and 3, demonstrated evolving boundary-crossing efforts to diversify and expand stakeholder involvement in equity-centered principal preparation.
This descriptive analysis reveals a clear evolution of the ECPI network toward greater cohesion and inclusivity over time. Sociograms show that district and university actors consistently dominated the network. Systematically, cohesion metrics indicate that the network grew from a loosely connected, fragmented structure at Time 1 into a more densely interconnected and clustered system by Time 3. Centrality measures highlight the sustained influence of district and university actors, both in popularity and brokerage roles, while state agencies gradually became more central. Lastly, degree centrality further underscores the enduring strength of university–district partnerships, alongside the emergence of collaborations with community organizations. This evidence marks a shift toward broader boundary-crossing engagement.
Inferential statistics
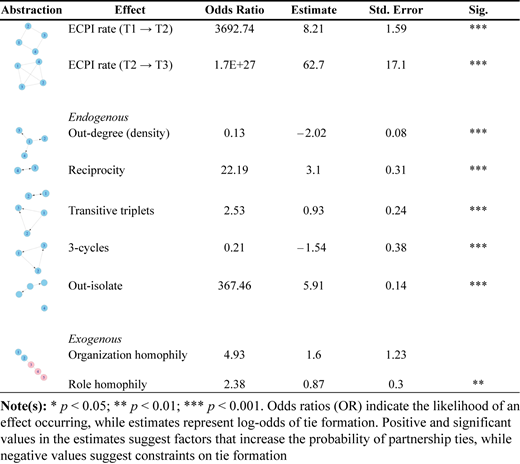
Co-evolution. In addition to the descriptive statistics results, we modeled the network from the three periods to analyze its co-evolution using the SAOM analysis (Table 2). Here, we included both endogenous and exogenous factors in the model. The results are as follows.
Endogenous. We found that several important endogenous factors determined partnership formation within equity-centered PPPs. First, the strong negative out-degree effect (OR = 0.13) indicates that the actors were highly selective with fewer ties sent from one period to another. Reciprocity was in fact notably positive and also important in that the ECPI actors were about 22 times more likely to form mutual ties as the initiative progressed. These findings indicate increasing mutual trust in the network. Transitive triplets existed at a rate of 2.53 (OR), reflecting a tendency toward clustered and triadic relationships. This cluster contributed toward network cohesion, adding the descriptive results. Conversely, the 3-cycles’ negative effect (OR = 0.21) means closed loops were around 80% less likely to form, so outward network expansion was favored. Lastly, the out-isolate effect (OR = 367.46) stressed efforts to incorporate previously disconnected people, which reinforced the network's more inclusive and integrative dynamics over time.
Exogenous. Furthermore, exogenous influences such as boundary crossing through organizational and role-based homophily appeared to influence the collaboration. Across the three periods, ECPI actors were twice as likely to form ties with others in similar roles, suggesting a preference for familiar or functionally aligned collaborators rather than engaging across different roles. Although organizational homophily showed a positive association (OR = 4.93), it was not statistically meaningful, indicating the limited influence of institutional affiliation. These findings raise concerns that, despite the initiative's equity-focused goals, partnership formation might have been shaped more by convenience and existing role-based alignment than by efforts to foster broader, cross-boundary collaboration.
Together, the inferential analysis shows that partnership formation in equity-centered PPPs was shaped by both endogenous and exogenous factors. Endogenously, actors were selective in forming ties, favored mutual and clustered relationships, and increasingly integrated previously isolated individuals; this could mean growing inclusivity and trust among individuals. Exogenously, partnerships were more likely among actors with similar roles, while organizational similarity was less influential; this suggests that shared functions and skills might play a more crucial role than institutional affiliation in driving collaboration.
Discussion and conclusion
In this section, we draw on the conceptual foundations and prior research to frame the discussion. We examine the findings and address the challenges that could emerge. The section concludes with study limitations and reflective questions for future research.
Formation and evolution of boundary-crossing relationships
The current study reveals a dynamic development of boundary-crossing relationships in that it demonstrates how ECPI actors navigated their respective roles to govern the initiative. In this context, we argue that the ECPI's PPPs themselves functioned as a boundary object: a shared endeavor robust enough to unite actors from different organizations, yet flexible enough for each to engage (Star and Griesemer, 1989). This shared object created a common ground where the initial network, dominated by universities and TA providers, could form.
The network's subsequent expansion to include school districts, state agencies and community organizations signifies a broader engagement with this boundary object and, in turn, a widening of their collective interdependence. This expansion, while challenging due to the possible friction of crossing institutional logics (Friedland, 1991; Akkerman and Bakker, 2011), represents a significant step toward a more robust collaborative infrastructure. This progression aligns with research-practice partnerships (RPPs), which emphasize long-term, mutual engagement across diverse stakeholders to drive systemic educational improvement. As Penuel et al. (2021) explain, RPPs are “intentionally organized to connect diverse forms of expertise and to ensure that all partners have a say in the joint work,” with the goal of supporting “mutual learning of partners to change practice” (p. 45).
Despite the structural growth, the network's tendency toward role-based homophily in partnerships indicates ongoing challenges in achieving deep, cross-boundary collaboration. This is shown in the SAOM's role-based homophily results (Table 2). Such patterns suggest that while the network has become more interconnected, intentional efforts are still needed to promote relationships that transcend traditional roles and institutional boundaries. Building on the principles of social network perspectives, which emphasize the role of relational ties in facilitating change (Daly, 2010), future strategies in such initiatives should focus on cultivating diverse, role-based connections to enhance the network's capacity for educational transformation.
The shifting centrality of key actors
Another insight from this study in addressing the sub-question on actor positioning is the shifting centrality of school districts and universities, indicating the strengthened RPPs. Initially, districts held a structurally significant yet functionally limited position. As the network evolved, universities emerged as central brokers. By the final period, however, districts assumed a more active boundary-spanning role, reflected in their increased brokerage. This shift is consistent with resource dependency theory; that is, influence is renegotiated as the value of each partner's unique resources, such as the district's access to aspiring leaders and deep contextual knowledge, becomes more critical to the partnership's success (Pfeffer and Salancik, 2015).
These results show the role adaptation in boundary-crossing and boundary-spanning networks. Molle et al.’s qualitative ECPI study (2024) highlights how districts and universities navigated role ambiguities and power dynamics within partnerships. While universities often began with an advantage due to their established structures and expertise in leadership preparation (Orr, 2023), districts, as this research shows, gained influence over time as they assert themselves in shaping leadership pathways. This approach could actually align the universities more closely with local equity goals (Grooms et al., 2024). This shift may indicate a transition from universities as sole knowledge producers to a more reciprocal relationship where districts actively contribute to knowledge co-creation and programmatic direction.
Additionally, the evolution of districts from limited roles to key boundary-spanning connectors aligns with previous studies emphasizing the importance of strengthening relational ties for successful educational reform. For instance, Daly and Finnigan (2011) wrote, “Increasing the amount of intergroup sharing may enhance the overall capacity of the district to increase performance through increased social capital, collective learning, and synergy, thereby making successful change more likely” (p. 69). Lastly, the findings further complement prior research on the critical role of districts in bridging stakeholders and advancing systemic equity reforms, as the ECPI intended (Wallace Foundation, 2021; Molle et al., 2024, 2025). Taken together, these insights underline the district's evolving role as a strategic hub in educational networks that might be crucial not only for fostering collaboration but also for sustaining equity-driven, systemic change.
Future direction for sustainability
The one-and-a-half-year duration of this study provides a promising snapshot of a growing collaborative network, but is insufficient to claim long-term sustainability. The network's expansion and engagement of significant actors represent a promising start, but its true endurance has yet to be proven. This limitation, however, offers a clear implication for further research. The central question shifts from if the network is sustainable to what is required to make it so. The financial, structural and relational challenges must be addressed to foster longevity. Future research should investigate what aspects of the network remain and evolve and how those aspects are impacted by its design.
Financial and Structural Imperatives. A primary obstacle to long-term collaboration is securing resources beyond initial grant funding. It is a well-documented challenge that innovative projects struggle to continue after seed money expires (Orr et al., 2010). To avoid backsliding, participating organizations must proactively plan for the institutionalization of core program components, such as securing internal funding for follow-ups.
Beyond finances, sustainability hinges on institutionalizing collaborative structures. This includes formally assigning individuals to act as brokers or “boundary spanners” who facilitate communication and bridge gaps between different roles, schools and organizations. Hatch et al. (2020) suggest that,
districts can create strategic opportunities for interaction among those who are in different roles, in different schools or are engaged in different aspects of work. For example, districts might be able to designate particular individuals to serve as formal “hubs” and “brokers,” responsible for facilitating communications across roles and for connecting conversations on instruction, equity and race (p. 86).
Similarly, Molle et al. (2024) emphasize that sustainability depends on structural mechanisms that institutionalize collaboration beyond the lifespan of grant funding. Some main conditions include formally designated boundary spanners who mitigate role ambiguity and foster cross-sector engagement. This process is crucial for embedding the partnership's activities within the ongoing institutional logics of the participating organizations. Partnerships are more likely to thrive when they move beyond transactional arrangements, such as universities providing services to districts, toward more transformative models of co-leadership.
Navigating Network Dynamics and Power Imbalances. The flexibility of boundary-spanning roles, though beneficial, can also introduce challenges. These roles risk becoming ambiguous or unsustainable without clear definitions or institutional backing (Browne-Ferrigno, 2011; Molle et al., 2024, 2025). Moreover, while quantitative SNA can reveal structural patterns, it does not reveal the full depth of collaboration quality or the negotiation of power and influence within relationships. Moreover, while generally associated with stronger ties, network cohesion can also lead to the formation of tightly knit subgroups or “cliques” (Moody and White, 2003). These cohesive clusters may facilitate trust and rapid diffusion of norms within the group, but they can simultaneously reduce openness to new or peripheral actors, thereby limiting the diversity of perspectives and innovation (Moody and White, 2003). What appears as strong connectivity may, in some cases, mask unequal participation or unresolved tensions.
Research shows that in networks with strong hierarchies, those in higher positions, such as large universities, state agencies or well-funded institutions, tend to both share and receive more information than others (Whetsell, Kroll and DeHart-Davis, 2021). This information flow can reinforce their central role and give them greater influence over key decisions. For example, a prominent university may dominate discussions about policy directions or priorities in preparation programming simply because it communicates more frequently and is seen as an authoritative voice. As a result, the final decisions often align with the university's interests rather than what is actually needed by the grassroots (e.g. school districts). This dynamic, predictable from a resource dependency perspective, means that actors controlling critical resources (like funding or institutional legitimacy) often become central nodes, which can reinforce existing power imbalances (Pfeffer and Salancik, 2015).
Therefore, while the ECPI network shows signs of strengthening collaboration, sustained success will require ongoing attention to inclusion, role clarity, and influence distribution. By institutionalizing collaborative structures and remaining mindful of these potential pitfalls, partnerships can move from short-term, grant-dependent initiatives toward enduring models of equity-centered reform. This is the hope.
Limitations
While this social network study offers important insights into the evolution of partnerships, it has several methodological limitations. The use of purposive sampling may have led to underrepresentation. Some actors, particularly those from community organizations who joined the initiative but did not respond to the survey, may have been excluded, potentially omitting influential voices. Although descriptive and inferential SNA techniques captured structural and temporal patterns, this quantitative approach does not fully reveal the deeper relational and contextual dimensions of partnerships, such as trust, power or the quality of collaboration. To address these gaps, future research needs to incorporate qualitative data from interviews, focus groups and/or document analysis to better understand the dynamics shaping equity-focused collaborations.
This research is exploratory in nature and should be seen as an initial step in mapping and analyzing large-scale professional learning networks. Future studies should extend their focus beyond network structure to empirically assess the mechanisms, factors and power relations underlying networked collaboration. One could ask: What mechanisms sustain or inhibit authentic collaboration across institutional boundaries? What organizational and personal factors facilitate and impede organizational learning within a professional network? How does power circulate in networked reforms, and whose voices shape the direction of change? These questions prompt a deeper inquiry that links structure with lived experiences and perceived impacts, informing future investigations into how educational leaders connect the dots in equity-focused reforms.
The views and opinions expressed in this article are those of the authors and do not necessarily represent the views of the funder, the Wallace Foundation. We are grateful to all participants for their time and commitment to this study. We also thank Dr. Stacey J. Lee, Dr. Yi-Hwa Liou, Dr. Kevin Lawrence Henry, Jr., Dr. Daniella Molle and Dr. Christopher Saldaña for their thoughtful feedback on earlier drafts of the manuscript.