This study investigates the differences between fixed and time-varying weights in the Monetary Conditions Index (MCI) and their implications for the effectiveness of repo rate. The aim is to assess the impact of incorporating time-varying weights on the MIC and monetary policy response.
The analysis uses a rolling VECM and Markov-switching VAR on quarterly data Q1 2000 to Q3 2024 to examine regime-dependent effects and the dynamic impact of MCI components on the repo rate.
Results indicate that fixed-weight MCIs provide stability but may fail to capture evolving economic conditions. In contrast, time-varying weights allow for a more adaptive monetary policy. Specifically, in Regime 1, increases in the fixed-weight MCI lead to a noticeable rise in the repo rate, whereas in Regime 2, the effect is minimal. For the time-varying MCI, the impact in Regime 1 is very small, but in Regime 2, a slight decrease in the repo rate is observed, signaling potential policy easing under restrictive conditions. The time-varying MCI enhances the effectiveness of repo rate adjustments by reflecting shifting economic conditions, even if the effects are modest in some regimes.
The study provides empirical evidence on the benefits of incorporating time-varying weights into the MCI, highlighting its practical relevance for the South African Reserve Bank (SARB). By capturing dynamic and regime-dependent effects, the findings improve the assessment of monetary policy stance and offer actionable insights for enhancing the responsiveness and effectiveness of repo rate decisions.
1. Introduction
Monetary policy serves as a cornerstone of macroeconomic management, playing a critical role in stabilizing the economy and influencing key variables such as inflation, output exchange and overall economic performance (Zanfack et al., 2024; Klose, 2024; Mlangeni and Buthelezi, 2024). The mandate of the South African Reserve Bank (SARB), as per Section 224 of the Constitution, is to protect the currency's value for balanced, sustainable economic growth. Its primary goal is maintaining low, stable inflation within a 3% to 6% target to support economic growth (SARB, 2025a, b). Reserve banks use various tools and frameworks, often guided by monetary policy rules, to achieve their mandates (Buthelezi, 2023b). These rules include indicators like the Monetary Conditions Index (MCI), which evaluates monetary policy by combining changes in interest rates and exchange rates to measure economic pressure holistically (Arnold, 2024; Memon and Jabeen, 2018). The MCI framework is reflected in Equation (1).
where is the real interest rate; is the neutral real interest rate; is the exchange rate; is the nominal exchange rate at a neutral level; and and are weights indicating the relative importance of the real interest rate and the exchange rate in determining monetary conditions, respectively (Freedman, 1994; Arnold, 2024; Memon and Jabeen, 2018). A positive MCI indicates a hawkish stance, with high rates and a strong currency slowing growth and reducing inflation. In this case, reserve banks may lower rates to boost activity. On the other hand, a negative MCI signals a dovish stance, where low rates and a weak currency encourage growth but risk inflation. Reserve banks may respond by raising rates to control inflation (Ericsson et al., 1997). The main problem that identified with the current MCI, Equation (1), is its use of fixed weights for the interest rate and exchange rate , ignoring their dynamic nature. This rigidity limits policymakers' ability to assess monetary conditions accurately, obscures the changing effectiveness of tools under varying economic conditions and reduces utility during uncertainty or rapid transitions. Static weights can generate misleading signals and suboptimal decisions. The proposed MCI with time-varying weights for analysis is as shown in Equation (2).
The introduction of time-varying weights for → ∥Δ∥→ interest rates and ∥Δ∥→ exchange rates, allowing for real-time adjustments based on shifting economic conditions and the changing impact of these variables on aggregate demand and inflation. Eika et al. (1996) define the MCI as a weighted sum of short-term interest and exchange rate changes from a baseline year, used by reserve banks of Canada, Sweden and Norway to assess monetary policy. The effectiveness of the MCI depends on linking economic activity and inflation to interest and exchange rates. Memon and Jabeen (2018) use Principal Component Analysis (PCA) and vector autoregressive (VAR) to assess its impact on CPI and GDP. Mupunga (2022) finds that exchange rates dominate Zimbabwe's monetary conditions (weights 1:1.54). Odeniran et al. (2023) show that the Narrow MCI is more stable than the Broad MCI and aligns with Nigeria's policy stance. Diallo and Konte (2022) find the MCI a reliable tool for West African central banks. Collectively, these studies confirm that MCIs integrate interest rate and exchange rate changes to evaluate monetary policy. Firdous et al. (2023a) use Principal Component Analysis and an autoregressive distributed lag (ARDL) model with cointegration to determine MCI weights, providing insights into monetary transmission. Trinh and Kim (2015) develop an MCI for Vietnam using interest rates, exchange rates, credit and stock prices, selecting the best index based on causality with output, short-run explanation and out-of-sample forecasting. Guillaumin and Vallet (2017) construct a Swiss inflation forecasting index using an AD equation and VAR impulse responses. Kabundi and Mbelu (2021a) estimate South Africa's FCI with 39 series using a dynamic factor model and time-varying loadings. Collectively, these studies highlight the use of MCIs and FCIs to aggregate financial variables and assess links to output or inflation.
The gap in time-varying MCI weights has key implications for monetary policy. Most MCIs assume fixed relationships between interest rates, exchange rates and outcomes like inflation and GDP, yet these vary with economic cycles, market shifts and central bank actions. Ignoring time-varying weights can misrepresent policy effectiveness. A time-varying MCI captures evolving impacts, allowing exchange rates to dominate during instability and interest rates in stable conditions. In restrictive regimes, it reduces reliance on repo rates, emphasizing exchange rate channels, improving inflation control and enhancing policy efficiency. The research question of this study is: How do time-varying MCI weights affect monetary policy across different inflation regimes?
The time-varying weights in the MCI have no significant effect on the effectiveness of monetary policy actions across different inflation regimes.
The time-varying weights in the MCI significantly affect the effectiveness of monetary policy actions across different inflation regimes.
This study contributes to monetary policy measurement and transmission in several ways. First, it provides novel evidence for South Africa by comparing fixed- and time-varying MCIs, allowing interest rate and exchange rate importance to evolve. Using rolling VECMs and MS-VARs, it captures regime-dependent effects often missed in static MCIs. Second, time-varying MCIs offer responsive indicators for inflation targeting and policy, while fixed weights may obscure key dynamics. Third, the study challenges the perceived stability of fixed-weight MCIs, showing that time-varying weights account for structural breaks, shocks and regime shifts, providing a flexible framework relevant for small open and emerging economies. This study examines the impact of fixed versus time-varying weights in the MCI on interest rate policy. Using a rolling VECM and MS-VAR with data from 2000Q1–2024Q3, results show that fixed weights provide stability but may not capture evolving conditions, whereas time-varying weights enable a more adaptive policy. In one regime, changes in the fixed MCI significantly affect the repo rate, while in another, the effect is negligible. The time-varying MCI shows minimal impact in the first regime but reduces the repo rate in the second, suggesting potential easing. Adopting a time-varying MCI can improve policy responsiveness and interest rate effectiveness.
2. Literature review
The literature on MCIs (Cespedes et al., 2015; Mna and Younsi, 2018; Kassem, 2024; Arnold, 2024; Batini and Turnbull, 2002) highlights debates on their construction, applicability and effectiveness across economies. Cespedes et al. (2015) use a Bayesian VAR to build a conditional MCI for Brazil, enhancing predictive power, while Mna and Younsi (2018) emphasize exchange rates in Tunisia. Kassem (2024) integrates bank credit with interest and exchange rates, broadening the MCI but raising endogeneity concerns. Arnold (2024) shows policy transmission evolves over time, highlighting heterogeneity and Batini and Turnbull (2002) critique fixed-weight MCIs for failing to capture structural shifts. Knedlik (2006) finds that interest rates dominate exchange rates (1.9:1) in South Africa. Overall, static weights limit adaptability and risk misleading assessments, underscoring the need for tailored, dynamic MCIs suited to each economy. Nucu and Anton (2018a), Siklos (2000), Eika et al. (1996), Memon and Jabeen (2018) and Bui and Kiss (2021) examine the links between interest rates, exchange rates and outcomes like inflation and GDP, noting challenges such as market confusion and the “price puzzle.” Nucu and Anton construct an MCI for CEE nations (2005–2015) using a VEC model, showing strong influence from Eurozone policy. Siklos (2000) warns that overly responsive MCIs may confuse markets. Eika et al. (1996) define MCI as a weighted sum of interest rate and exchange rate changes, emphasizing its link to economic activity and inflation. Memon and Jabeen (2018) use PCA and VAR to show MCI's impact on CPI and GDP, while Bui and Kiss (2021) highlight its role in addressing the price puzzle in emerging economies.
The relative importance of exchange rates and interest rates in the MCI depends on the economic context (Ossouna, 2024; Qayyum, 2002; Hasan et al., 2021; Mupunga, 2022; Odeniran et al., 2023). Ossouna (2024) shows that combining the MCI with the structural primary balance supports price stability in CEMAC. Qayyum (2002) highlights Pakistan's critical exchange rate–interest rate ratio, while Albania exhibits a 3.8:1 ratio, showing interest rate impact on the exchange rate. Hasan et al. (2021) report a 1.86:1 ratio, indicating comparable effects on aggregate demand. Mupunga (2022) finds that exchange rates dominate in Zimbabwe (1:1.54), and Odeniran et al. (2023) show Nigeria's Narrow MCI is more stable, but both versions reflect the central bank's stance. Diallo and Konte (2022) use VAR analysis to show that the MCI reliably captures monetary conditions in West Africa, highlighting the importance of region-specific approaches. Firdous et al. (2023a) apply PCA and ARDL with co-integration to determine MCI weights, offering insights transferable to other economies. Trinh and Kim (2015) construct a Broad MCI for Vietnam using interest rates, exchange rates, credit and stock prices, selecting the optimal index based on output causality, short-run dynamics and forecasting performance. Guillaumin and Vallet (2017) develop a Swiss inflation forecasting index using AD equations and VAR impulse responses. Kabundi and Mbelu (2021a) estimate South Africa's FCI with PCA and Kalman smoothing to capture financial conditions. Collectively, these studies demonstrate the MCI's utility, but gaps remain regarding comparative effectiveness across regions, dynamic adaptation to structural changes and integration with fiscal and external indicators for a more comprehensive assessment of monetary policy.
In Central and Eastern Europe (CEE), domestic monetary conditions are highly sensitive to external developments, especially Eurozone policy. Nucu and Anton (2018b) show that CEE economies are strongly influenced by Eurozone interest rates and exchange rates, with Granger causality confirming the dominance of external shocks. Stawasz-Grabowska and Stawska (2025) find that ECB policies have time-varying, country-specific effects on inflation and output using PCA-based factors and rolling VARs. Similar patterns appear in emerging economies: Diallo and Konte (2022) show MCIs capture policy stance in ECOWAS countries but with heterogeneous effectiveness, while Firdous et al. (2023b) find the interest rate channel weak in Pakistan. Parallel FCI research (Kabundi and Mbelu, 2021b; Aikman et al., 2021) shows financial conditions exert asymmetric, time-varying effects, highlighting that ignoring regime dependence and time variation can mislead policy, particularly in small open economies exposed to global financial cycles.
The literature shows that MCIs are effective tools for summarizing monetary policy across advanced and emerging economies, capturing the combined influence of interest rates and exchange rates on inflation and output more comprehensively than single-instrument approaches (Eika et al., 1996; Memon and Jabeen, 2018; Bui and Kiss, 2021). Evidence from CEE, Africa, South Asia and Latin America highlights the importance of external conditions, especially in small open economies (Nucu and Anton, 2018b; Diallo and Konte, 2022; Stawasz-Grabowska and Stawska, 2025). While some studies find the interest rate channel dominant (Cespedes et al., 2015; Qayyum, 2002), others report stronger exchange rate effects in financially open or constrained economies (Mna and Younsi, 2018; Mupunga, 2022), showing context-dependent transmission. Traditional MCIs with fixed weights enhance transparency but fail to capture structural breaks or regime shifts (Batini and Turnbull, 2002; Siklos, 2000), whereas PCA, DFM, VAR, VECM and ARDL approaches improve empirical relevance (Kassem, 2024; Diallo and Konte, 2022; Firdous et al., 2023a). Yet, most still assume time-invariant relationships. FCIs further highlight that financial and monetary effects are asymmetric, nonlinear and state-dependent (Kabundi and Mbelu, 2021b; Aikman et al., 2021; Akdeniz, 2021). Overall, empirical integration of time-varying and regime-dependent dynamics into MCIs remains limited, particularly across countries, representing a key gap for improving monetary policy assessment in open and emerging economies.
3. Methodology
This study examines fixed versus time-varying weights in the MCI and their impact on interest rates. We adopt a rolling vector error correction model (RVECM) [1] and Markov-switching vector autoregression (MS-VAR) [2] with data from Q1 2000 to Q3 2024. For RVECM and MS-VAR, GDP and exchange rates were log-transformed; non-stationary series first-differenced; inflation and interest rates annualized. MCI components are measured as gaps from equilibrium, and potential output is estimated with the Hodrick–Prescott filter to isolate trends. These steps ensure stationarity, interpretability and accurate estimation of short- and long-run dynamics. The RVECM and MS-VAR are well-suited for capturing time-varying and regime-dependent dynamics in South Africa's MCI. RVECM allows coefficients on interest and exchange rates to evolve over time, while MS-VAR models discrete regimes, distinguishing normal versus crisis periods. Fixed-parameter VECMs, standard VARs or OLS ignore structural shifts and regime changes, potentially misrepresenting monetary transmission.
3.1 Theoretical framework
The first objective of the study is to examine how the time-varying and state-dependent weights of interest rates, as well as exchange rates, affect the MCI. First, we will calculate of the MCI using the Taylor Rule, as reflected in Equation (4).
We will derive the Taylor Rule with respect to r∗, as shown in Equation (5).
where πt is the current inflation rate; is the target inflation rate 3%–6%; is the real GDP; is the potential real GDP at full employment; and and are coefficients that represent the sensitivity, following Steinbach et al. (2009), Bold and Harris (2018) and Gupta and Sun (2024). In the effort to get the from the Taylor Rule, we will use HP filter of Hodrick and Prescott (1997) as reflected in Equation (6).
where is the sum of squared deviations between the original series and the trend and is the penalty term for the smoothness of the trend Hodrick and Prescott (1997). We will follow Bold and Harris (2018) λ = 1,600 as a smoothing parameter. Second, the external component of the MCI, , is constructed using the real exchange rate framework shown in Equation (7).
where denotes US inflation, used as an external anchor because global prices and financial conditions are dollar-based. While China and India are key import sources, most imports are priced in dollars, transmitting cost shocks to South Africa through US prices. Following this, there are two unknowns in the MCI in Equation (3), which are . This highlights the need for time-varying weights to capture evolving economic conditions, necessitating the adoption of the RVECM.
3.2 Rolling vector error correction model (RVECM)
The Rolling VECM captures long-run equilibrium and short-run dynamics among non-stationary variables, using rolling windows to allow time-varying parameters (Papaioannou et al., 2018; Wahab, 1997; Engle and Granger, 1987), as shown in Equation (8).
where are economic variables of interest in an n-dimensional vector of non-stationary variables at time t. While is the first difference of the endogenous variables, ensuring stationarity reflects the long-run impact matrix. While the reflect the short-run coefficient matrices capturing the impact of lagged differences . The c0 ∈ Rn is the vector of deterministic constant terms is the matrix of deterministic terms Dt, including seasonal dummies, time trends or exogenous variables. The is the vector of innovations (error terms) with zero mean and covariance matrix Σu (Papaioannou et al., 2018). The term Πyt−1 is the error correction term of Equation (9).
where is the cointegrating relationship of yt−1 that are stationary; α indicates how deviations from equilibrium () are corrected (Granger and Weiss, 1983). The RVECM uses a 20% rolling window (19 of 94 quarters), letting MCI weights vary over time to reflect changing roles of interest rates and exchange rates amid structural shifts. The data is partitioned into overlapping windows indexed by Equation (10).
where K is the total number of windows. For each window τk, this is then factored into the rolling VEC model reflected in Equation (11).
Key features are Π(τk) = α(τk)β(τk)', which reflect the rolling estimates of the long-run matrix; γi(τk) is the rolling estimates of short-run coefficients; and the parameters α(τk) and β(τk) reflect time-varying long-run dynamics (Inoue et al., 2017; Papaioannou et al., 2018). In the context of this study, the RVECM is presented in Equation (12).
The introduction of time-varying weights for β(τk)→∥ w1→∥Δ∥→ w1,t interest rates and . These time-varying weights are then put into the MCI as reflected in Equation (13).
3.3 Markov-Switching vector autoregression (MS-VAR)
The Markov-Switching Vector Autoregression (MS-VAR) model allows parameters to shift between discrete regimes following a first-order Markov chain. MS-VAR is effective for analyzing the regime-dependent dynamics of the dependent variable, Yt, conditional on state-dependent factors. The model captures structural breaks or regime shifts (Kim, 1994; Uzoma and Florence, 2016), as outlined in Equation (14).
where Yt is the dependent variable; Xt is the vector of explanatory variables; αSt is the state-dependent intercept, capturing regime-specific effects; and βSt is the vector of state-dependent coefficients for Xt. The St is an unobserved discrete state variable representing the regime at time t (St ∈ 1,2, …, M) (Buthelezi, 2023a; Pomorski and Gorse, 2023). While is a is the regime-specific variance of the error term and εt is an independently and identically distributed error term. The state variable St follows a first-order Markov process, characterized by the transition probabilities (Uzoma and Florence, 2016) in Equation (15).
The transition probabilities are summarized in the matrix 16.
The error terms for each regime are defined as for Regimes 1 and 2 and are reflected in Equations (17) and (18).
Table 7 reflects the two-regime MS-VAR captures distinct states in South Africa's monetary policy. Regime 1 represents periods of low volatility with stable interest rates and exchange rates, while Regime 2 reflects high volatility during shocks or active policy interventions. The AIC 231.45 and BIC (258.72) indicate that the two regime specification balances fit and parsimony. The six parameters correspond to regime-specific coefficients and transition probabilities, allowing the model to capture the magnitude and persistence of regime shifts. The model also reflects the impulse response functions (IRFs), which illustrate the impact of a shock in one variable on the other variables in the system over time. For each regime , the IRF for variable at horizon can be calculated as shown in Equation (19).
Assuming the VAR representation, the response of the system can be computed iteratively as reflected in Equation (20).
Therefore, the IRF for two variables and is reflected in Equation (21).
We perform Cholesky decomposition of the residual covariance matrix for each regime in Equation (22).
for variable j at the horizon h for regime i in Equation (23).
We will then factor in these factors in Equation (24).
where St is the regime or state at time , governed by a Markov process . The is the regime-dependent natural rate of interest. The is the regime-dependent inflation responsiveness. The is regime-dependent output gap responsiveness, and is the MCI, regime-dependent and time-varying.
4. Results
Table 1 states that the real interest rate averages 7.54% with moderate volatility of 2.53%, while output growth is lower at 1.11% but more volatile at 1.45%. The natural rate of interest shows a high variation of 4.79%, reflecting macroeconomic shifts. Inflation averages 5.57%, with its first difference at −0.43%, indicating occasional disinflation. The detrended output is relatively stable, 0.31% deviations. The monetary conditions indices and differ significantly. The constant-parameter MCI, has a near-zero mean of −0.0043 with low variation of 0.22, while the time-varying fluctuates more 8.46%. Most variables show low skewness, except for , 0.82, indicating occasional high values. Kurtosis values suggest no extreme outliers, but normality tests indicate deviations, especially for output growth and the time-varying MCI.
Table 2 clearly shows that the real interest rate. negatively correlates with output growth , −0.1360 and the natural rate , −0.2353, indicating contractionary policy slows growth. The strong inverse link between and inflation; πt, −0.9063 reflects the policy trade-off. Inflation πt and its first difference are perfectly correlated at 1.0000 and positively linked to rt 0.6234, suggesting a pro-cyclical stance. Inflation's weak negative correlation with output yt, −0.1697 aligns with Phillips curve intuition. Detrended output correlates positively with rt∗ 0.3446 and negatively with inflation −0.3803, reinforcing the output-price trade-off. The monetary condition indices show weak links, except for moderate correlation with inflation, with the values of 0.4527, suggesting some policy influence.
Table 3 shows that the unit root test indicates all variables are I(1), showing non-stationarity in levels but stationarity in first differences. This is essential for the Error Correction Model (ECM) and Markov-Switching VAR (MS-VAR). The ECM captures short-run dynamics and long-run equilibrium through an error correction term, while the MS-VAR analyzes structural changes. Transforming I(1) variables into stationary data allows both models to address non-stationarity and make valid inferences.
Table 4 outlines that the optimal lag length is 4, with a log-likelihood (LL) of 924.112 and a significant likelihood ratio (LR) of 1336.2 p ¡ 0.05. The Final Prediction Error (FPE) is minimized at 3.6e−16, along with the lowest Akaike Information Criterion (AIC), Hannan-Quinn Information Criterion (HQIC) and Schwarz Bayesian Information Criterion (SBIC) values at this lag. These findings indicate that a lag length of 4 effectively captures the data dynamics.
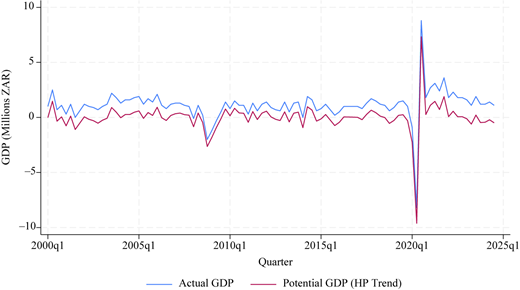
Figure 1 illustrates the application of the HP filter in estimating the output gap, as specified in Equations (5) and (6).
Table 5 presents the parameter values used in Equation (5). These parameter values are based on the methodologies and estimations provided in Carvelli et al. (2024) and Liu et al. (2009), ensuring consistency with existing empirical research. By adopting these parameters, the analysis aligns with established macroeconomic modeling approaches, enhancing the robustness and comparability of the results.
The traditional method of MCI with fixed weights of 0.0667474 to the interest rate and 0.0013434 to the exchange rate. The assigned weight of 0.0667474 to the interest rate indicates a significant emphasis on the influence of interest rate changes on overall monetary conditions. This reflects the predominant role that interest rates play in the monetary policy transmission mechanism, where adjustments to the policy rate can have substantial effects on consumption, investment and ultimately, economic growth. Conversely, the smaller weight of 0.0013434 assigned to the exchange rate suggests a relatively limited impact on the MCI, which may imply that exchange rate fluctuations have a less pronounced effect on monetary conditions in the current economic context. This disparity in weights raises critical questions about the effectiveness of monetary policy tools and the underlying economic environment. In contrast, the low weight for exchange rates suggests a limited impact on the MCI, raising questions about the effectiveness of monetary policy tools. Eika et al. (1996) note that the MCI, used by central banks in Canada, Sweden and Norway, integrates short-term interest and exchange rate changes. The MCI's effectiveness depends on its ability to link economic activity and inflation to these rates. For instance, Memon and Jabeen (2018) employ PPCA and VAR to analyze the MCI's effects on the CPI and GDP, while Mupunga (2022) argues that exchange rates influence monetary conditions in Zimbabwe more than interest rates. Moreover, Odeniran et al. (2023) find the Narrow MCI to be more stable than the Broad MCI, reflecting the Central Bank of Nigeria's policy stance and Diallo and Konte (2022) confirm the MCI's reliability in West Africa.
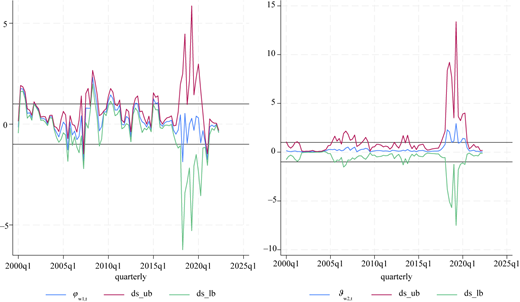
Figure 2 shows that the contributions of the real interest rate and the exchange rate to the MCI vary substantially over time, reflecting the dynamic nature of monetary policy transmission. The results indicate that the influence of interest rates on monetary conditions is unstable, fluctuating between positive and negative values. In Figure 2, graph (a), sharp increases of 2.36317 and declines of −1.98836 highlight the sensitivity of the MCI to interest rate adjustments. By contrast, the exchange rate shows a predominantly positive contribution, with notable spikes such as 2.40897, suggesting a stronger role in shaping monetary conditions. Figure 2, graph (b), further indicates an increasing reliance on exchange rate movements, particularly in later periods where contributions peak at 2.96806. This suggests that external currency shocks increasingly drive the MCI, potentially outweighing domestic interest rate effects. The volatility in interest rate contributions reinforces the growing importance of global financial conditions and exchange rate dynamics. These findings imply that in small open economies, relying solely on interest rate adjustments may be insufficient and policymakers should incorporate both interest rate and exchange rate channels when managing monetary conditions.
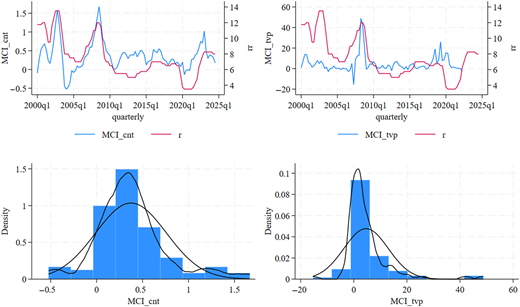
Figure 3 shows notable fluctuations in monetary policy reflecting macroeconomic conditions and central bank responses. Between 2000Q1 and 2004Q4, the MCI indices were volatile. increased from 0.70 in 2000Q1 to 15.52 in 2000Q4, indicating a restrictive policy stance to control inflation, before declining to −2.92 by 2003Q4, signaling a shift toward accommodative policy. From 2005 to 2008, monetary tightening intensified, with peaking at 49.57 in 2008Q2 amid rising inflation and strong global growth. Following the 2008–2009 Global Financial Crisis, fell sharply from 19.85 in 2008Q4 to −1.33 in 2009Q1, reflecting expansionary policy to stabilize the economy, which persisted until 2012. From 2015 to 2019, remained relatively stable, while spikes in in 2018Q3 19.45 and 2019Q2 (26.08) reflected responses to inflationary pressures. The COVID-19 shock in 2020 increased volatility, with declining to −0.13 in 2020Q2, indicating policy easing. The gradual movement of MCI_tvp from −0.02 in 2021Q4 to 0.17 in 2024Q3 suggests cautious policy normalization as the central bank balances recovery and inflation control.
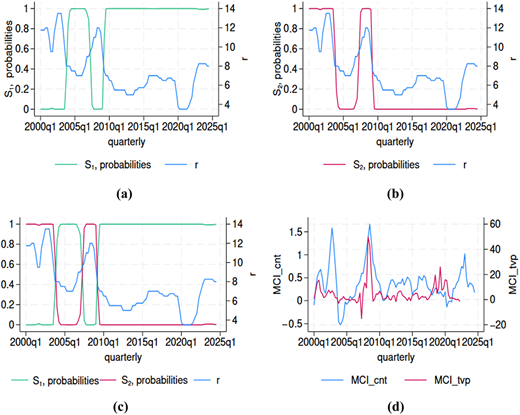
The identification of two distinct repo rate regimes in Figure 4 reflects structural shifts in monetary policy responses to prevailing macroeconomic conditions. The higher mean repo rate of 11.25%, observed in Regime 1, 2004Q3 to 2007Q2 and post 2009Q1, suggests a period of monetary tightening aimed at curbing inflationary pressures, stabilizing capital flows or mitigating external imbalances. This phase aligns with periods of strong global economic expansion and heightened inflation expectations, necessitating a restrictive monetary stance to anchor inflation and maintain financial stability. Conversely, the lower mean repo rate of 6.32% in Regime 2 from 2000 Q3 2004 Q2 and 2007Q4 to 2008Q4 indicates a more accommodative monetary policy stance, likely implemented to support economic activity amid weak aggregate demand or financial instability. The return to Regime 1 in 2009Q1 reflects post-crisis policy adjustments to restore stability and credibility. These shifts show countercyclical monetary policy, where interest rates respond to macroeconomic conditions. The persistence of the higher-rate regime to 2024Q3 suggests continued inflation pressures or a preference for positive real interest rates.
Table 6 interprets regime-switching dynamics in the SARB repo rate by linking policy regime shifts to major macroeconomic and institutional shocks. Panel A shows that transitions to the high-volatility regime (S = 2) occur during periods when the SARB faces trade-offs between price stability, financial stability and exchange-rate management. The 2008–2009 Global Financial Crisis triggered a shift to the crisis regime as external demand collapsed and financial conditions tightened. Similarly, the 2015–2017 episode followed the dismissal of the Finance Minister and falling commodity prices, which intensified capital outflows and exchange-rate pressures. The COVID-19 pandemic produced the most extreme shift, with rapid policy easing amid a severe economic contraction. More recently, the 2022–2023 period reflects continued stress due to persistent electricity supply disruptions and an aggressive tightening cycle to anchor inflation expectations. Panel B indicates that the low-volatility regime lasts about 43 quarters, reflecting gradual and predictable repo rate adjustments in the normal policy environment. In contrast, the high-volatility regime lasts around 18 quarters, suggesting that aggressive monetary responses are shorter but economically significant. Wide confidence intervals, especially in the crisis regime, highlight uncertainty under systemic shocks. Overall, South African monetary policy is generally stable, though the SARB responds strongly during crises, underscoring the importance of modeling regime-dependent dynamics.
Table 7 presents the Markov-Switching results, and it is found that the repo rate increased by 1.01% in Regime 1, Column 1, and 1.03%, for a 1% increase in the natural rate of interest . These findings corroborate the evidence in De Simone (2024), which identifies the long-term determinants of saving and investment as key drivers of the natural rate, thereby emphasizing the critical role of monetary policy in influencing r∗. Furthermore, Williams (2023) highlights the time-varying nature of the natural rate and the inherent challenges in its estimation, underscoring the necessity for policymakers to accurately gauge r∗ when designing effective monetary interventions. According to the Liquidity Preference Theory, the interest rate is determined by the supply and demand for money. An increase in the natural rate of interest, denoted as suggests a higher demand for money. This heightened demand prompts the central bank to raise the repo rate, to maintain monetary equilibrium. The significant response of rt to changes in aligns with this perspective (Spahija, 2016). From a theoretical perspective, the Liquidity Preference Theory posits that interest rates are determined by the equilibrium between the demand and supply of money. An increase in the natural rate, r∗, reflects higher money demand, which prompts the central bank to adjust the repo rate, rt, upward to restore monetary equilibrium. The statistically significant responsiveness of rt, to variations in observed in the results is fully consistent with this theoretical framework (Spahija, 2016).
Examining the inflation gap, under the constant-weighted monetary conditions index , Columns 1–2, a 1% increase raises the repo rate by 0.04% in Regime 1 and 0.005% in Regime 2, whereas under the time-varying MCI, Columns 3–4, the effect is statistically insignificant. This suggests that short-term deviations from the inflation target have a relatively muted impact on policy in Regime 2, where other factors, such as output gaps or external shocks, may dominate decision-making. Similarly, the output gap, increases rt by 1.43% in Regime 1 under the constant MCI, but insignificantly in Regime 2; under MCI_tvp, the corresponding responses are 4.85% and 2.79% for Regimes 1 and 2, respectively. These results indicate that the monetary authority reacts more strongly to output fluctuations when policy is flexible and regime-dependent. The interest rate, rt, is found to increase by 2.50% and 2.58% in Regime 1, Column 1 and Regime 2, Column 2, respectively, for a 1% increase in πt under a constant MCI environment. Under a time-varying MCI, increases by 2.63% in Regime 1 and 2.47% in Regime 2 for a 1% increase in . The slightly higher coefficient in Regime 2 suggests that the SARB reacts more aggressively during periods of heightened inflation. The positive and significant coefficients 2.50%, 2.58%, 2.63% and 2.47% exceed the conventional Taylor rule coefficient of 1.5, indicating a highly aggressive stance on inflation stabilization (Steinbach et al., 2009; Bold and Harris, 2018; Gupta and Sun, 2024).
Further analysis of the MCI itself indicates a regime-dependent relationship with the policy rate. In Regime 1, characterized by a low repo rate of 6.32%, a 1% increase in the contact-weighted MCI, , induces a modest 0.10% increase in rt, suggesting that monetary conditions exert a measurable, though limited, influence on policy rates when interest rates are low. Conversely, in Regime 2, where the repo rate reaches 11.25%, the effect of becomes statistically insignificant, indicating that under restrictive monetary conditions, adjustments in the policy rate are less responsive to changes in the MCI. These findings are consistent with Memon and Jabeen (2018) and Diallo and Konte (2022), who emphasize the heterogeneous responsiveness of monetary policy to MCI under varying economic conditions. Finally, the negative but insignificant coefficient of in Regime 1 under the time-varying framework Column 3 suggests that there are periods in which monetary conditions exert minimal direct influence on policy rates, potentially due to dominant external factors, such as exchange rate volatility, as highlighted by Mupunga (2022) in the context of Zimbabwe. Collectively, these results underscore the importance of regime-dependent policy analysis and highlight that both the macro-financial environment and the design of monetary indices critically shape central bank decision-making.
Interestingly, in Regime 2, Column 4, the time-varying parameter MCI, , is found to reduce the repo rate by −0.0156%, suggesting that under restrictive monetary conditions, the central bank responds by lowering interest rates to counteract the tightening effect of financial conditions. This result is consistent with the work of Firdous et al. (2023a), who emphasize the role of monetary transmission mechanisms in shaping central bank responses, as well as Trinh and Kim (2015), who demonstrate that broader MCI frameworks capturing multiple financial indicators, including credit and stock market prices, offer deeper insights into monetary policy effectiveness. The findings also echo Guillaumin and Vallet (2017), who argue that indices such as MCI can serve as effective tools for inflation forecasting through their interaction with aggregate demand. However, the present study's results contrast with Kabundi and Mbelu (2021a), whose estimation of South Africa's Financial Conditions Index (FCI) using a broader range of financial variables suggests that financial conditions may have a stronger and more persistent effect on monetary policy than conventional MCIs.
The estimated coefficients on oil prices reveal a regime-dependent effect on the repo rate. Under the constant MCI, , oil prices exert a small but statistically significant negative influence in Regime 1, 0.001, suggesting that in low-rate environments, higher oil prices marginally reduce the repo rate. Conversely, under the time-varying MCI, , the effect becomes positive, though economically modest, indicating that the interaction between credit conditions and time-varying monetary policy adjustments modulates the impact of commodity price shocks. This evidence suggests that SARB's policy response to oil price fluctuations is conditional on the prevailing interest rate regime: in low-rate environments, the central bank may partially accommodate oil-driven inflationary pressures to support output stabilization before initiating tightening measures. The COVID-19 pandemic variable exerts a statistically significant negative effect on the repo rate in low-rate regimes 0.115, consistent with a deliberate policy easing to mitigate the economic shock induced by the pandemic. In contrast, the effect is statistically insignificant in high-rate regimes, reflecting limited monetary space for further accommodation. These results highlight the countercyclical stance adopted by the SARB during the pandemic, aligning with global central banking practice where policy was actively eased to support economic activity in periods of severe exogenous shocks.
The results reinforce the broader literature that highlights the heterogeneity in the relationship between monetary conditions and policy rates across different regimes and economic contexts. While previous studies provide strong empirical support for the effectiveness of MCI in capturing the monetary stance, the findings here suggest that its influence on policy rates is conditional on prevailing economic conditions and monetary policy regimes. This underscores the importance of adopting flexible, time-varying approaches, as suggested by Firdous et al. (2023a) and Trinh and Kim (2015), to ensure that MCIs remain robust tools for monetary policy assessment across diverse macroeconomic environments. Shaheen (2020) examines the impact of monetary policy tools on macroeconomic variables through a nonlinear specification of threshold structural vector autoregression (TVAR). The study finds that monetary policy effects vary depending on credit market conditions, highlighting that in certain regimes, policy tools like the reverse repo rate have significant impacts.
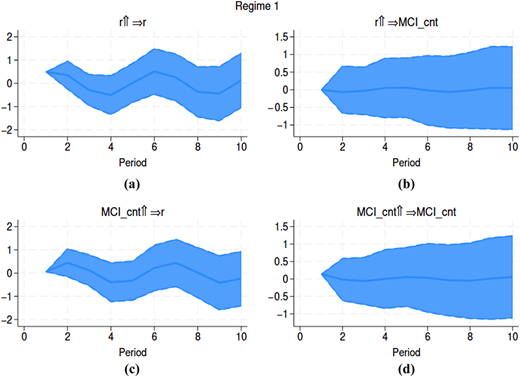
Figure 5 outline that, as depicted in Figure 5 graph (a), a shock to rt induces cyclical fluctuations, oscillating between a negative rate of 0.5% and a positive rate of 0.5%. These results underscore the transmission dynamics of monetary policy within this regime. The oscillatory nature of the response suggests the presence of a persistent adjustment process, potentially indicative of underlying frictions such as interest rate smoothing or expectations-driven policy reactions. The temporary deviations from equilibrium highlight the sensitivity of the repo rate to exogenous perturbations, reflecting the short-term volatility in monetary conditions. Moreover, the symmetric response pattern suggests that monetary policy adjustments in this regime may not exhibit strong asymmetries, implying a balanced reaction to contractionary and expansionary impulses. Conversely, Figure 5 graph (b) demonstrates that a shock to MCI_cnt results in an initial decline of 0.11% in the repo rate rt. Over time, rt follows a cyclical trajectory, gradually converging back to its equilibrium level by the tenth quarter. A similar response pattern is observed in Figure 5 graph (c), where a shock to rt elicits movements resembling those in Figure 5 graph (a). Meanwhile, Figure 5 graph (d) illustrates that a shock to MCI_cnt results in a sustained decline in MCI_cnt, indicating a prolonged downward adjustment following the shock. The sustained adjustment of MCI_cnt suggests that policy inertia or market frictions could amplify the persistence of monetary shocks, necessitating a carefully calibrated approach to interest rate adjustments to enhance monetary policy effectiveness.
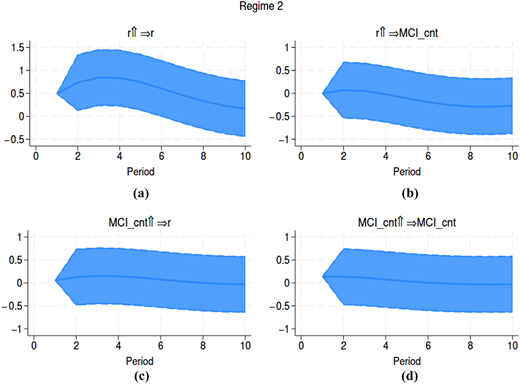
Figure 6 outline that, as illustrated in Figure 6 graph (a), a shock to rt initially induces an upward movement in rt over four-quarters. However, following this temporary increase, rt subsequently declines, falling below its initial equilibrium level. The result suggests the presence of nonlinearities in monetary policy transmission. The initial increase following an interest rate shock implies that monetary authorities respond actively to exogenous perturbations. However, the subsequent decline below equilibrium may reflect policy inertia or delayed adjustment mechanisms, potentially due to forward-looking central bank behavior or the constraints imposed by financial market rigidities. Such patterns align with theoretical models incorporating interest rate smoothing, where central banks avoid abrupt policy reversals to minimize market volatility. Similarly, Figure 6 graph (b) reveals that a shock to MCI_cnt generates a modest increase of 0.1% in rt, yet this effect is short-lived, as rt subsequently declines and stabilizes below its equilibrium level. Furthermore, Figure 6 graph (c) demonstrates that a shock to rt leads to a gradual and sustained decline in MCI_cnt. Meanwhile, Figure 6 graph (d) shows that a shock to MCI_cnt induces a steady and persistent decrease in MCI_cnt, suggesting a prolonged downward adjustment in response to the shock. These results highlight the dynamic interactions between the repo rate and MCI_cnt under a constant MCI_cnt environment, underscoring the asymmetric and persistent effects of exogenous shocks on both variables. This finding suggests that adverse shocks to monetary conditions generate persistent effects, possibly due to expectations-driven mechanisms where market participants anticipate prolonged financial tightening. Theoretical models incorporating rational expectations and endogenous monetary policy responses suggest that such persistence could be mitigated through credible forward guidance and countercyclical policy interventions.
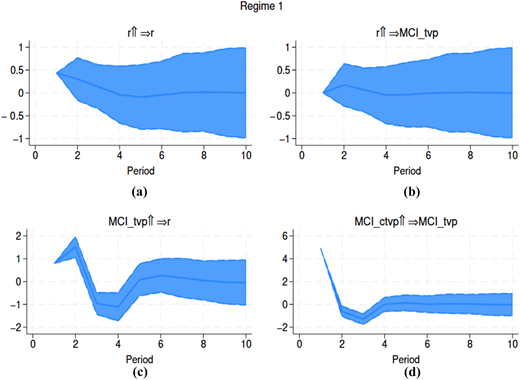
In Figure 7, it is clear that as depicted in Figure 7 graph (a), a shock to the repo rate rt results in a sustained decline over time. However, rather than reverting to its equilibrium level, it remains persistently below its initial state. Conversely, Figure 7 graph (b) indicates that a shock to MCI_tvp leads to a temporary increase in the repo rate rt by 0.3% in the second quarter. The gradual decline, with the repo rate returning to its initial level by the fourth quarter and subsequently stabilizing through the tenth quarter. According to monetarist theories of Brunner and Meltzer (1972), monetary policy primarily influences inflation expectations and has a uniform impact over time. The regime-dependent results suggest that monetary transmission is subject to structural shifts, contradicting the classical view of monetary neutrality in the long run. Furthermore, Figure 7 graph (c) demonstrates that a shock to rt initially drives an increase in MCI_tvp by 1.6% in the second quarter. However, this is succeeded by a sharp contraction to −1%, after which MCI_tvp exhibits a gradual upward adjustment, eventually stabilizing at 0.3%. Similarly, Figure 7 graph (d) reveals that a shock to MCI_tvp triggers an initial decline from 5.3% in the first quarter to −1.3% in the second quarter. Thereafter, MCI_tvp follows a path of stabilization, converging to a steady state at 0.2%. These findings underscore the dynamic and nonlinear responses of both the repo rate and MCI_tvp to exogenous shocks. If expectations were fully rational and forward-looking, a shock should lead to a more stable and predictable path of adjustment. The observed nonlinear and oscillatory behavior in MCI_tvp suggests either myopic expectations or financial market frictions that cause temporary overcorrections.
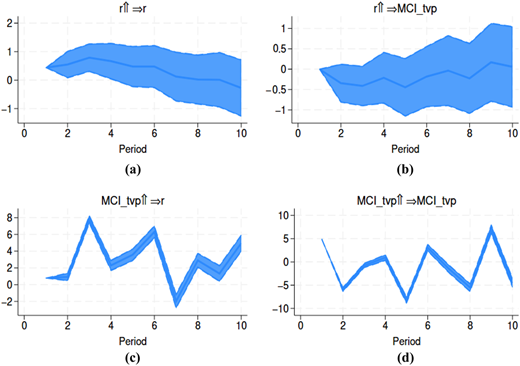
In Figure 8 graph (a), a shock to the repo rate rt initially leads to an increase in rt over the first three-quarters. However, this rise is followed by a gradual decline, which continues until the tenth quarter. Similarly, Figure 8 graph (b) shows that a shock to MCI_tvp causes an initial decline during the first three-quarters. Thereafter, it exhibits a cyclical upward movement, eventually stabilizing at a new equilibrium above its initial level. Furthermore, Figures 8 (c) and (d) reveal that shocks to rt and MCI_tvp produce distinct M- and W-shaped patterns in MCI_tvp, respectively, highlighting the nonlinear dynamics of the system [3].
4.1 Variance decomposition
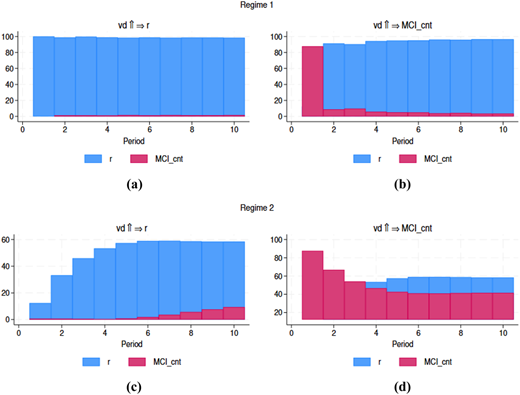
In Regime 1, as shown in Figure 9 graph (a), rt initially explains 100% of its own variance, indicating that repo rate (RR) is predominantly driven by its historical behavior in the short run. Economically, this suggests that external shocks from MCI_cnt exert minimal influence on RR during the early periods. In contrast, Figure 9 graph (b) demonstrates that the variance of MCI_cnt is largely self-driven, accounting for 87.68% initially. However, this proportion declines over time, reaching approximately 3.42%–3.53%, signifying an increasing influence of external shocks, particularly from rt. Correspondingly, the contribution of RR to MCI_cnt variance rises from 12.32% to a dominant 96.46%–96.58%, underscoring its growing role in shaping MCI_cnt fluctuations. In Regime 2, Figure 9 graph (c) illustrates that rt initially explains over 16% of its own variance, reflecting relative stability with minimal external influence. Although this dominance diminishes over time, it remains a significant factor. The impact of MCI_cnt on rt begins at a marginal 0.60% but gradually increases to 9.32%, indicating a growing external influence on rt variability. Figure 9 graph (d) reveals that MCI_cnt initially accounts for 87.68% of its own variance, suggesting that its fluctuations are primarily self-driven. However, this proportion steadily declines to 41.55% in later periods, signifying that external factors increasingly shape its movements. Conversely, rt initially explains only 12.32% of the variance in MCI_cnt, indicating a limited immediate impact. Over time, however, the influence of RR increases steadily, reaching 58.45% in later periods. This shift suggests that RR emerges as the dominant driver of MCI_cnt fluctuations as the time horizon extends.
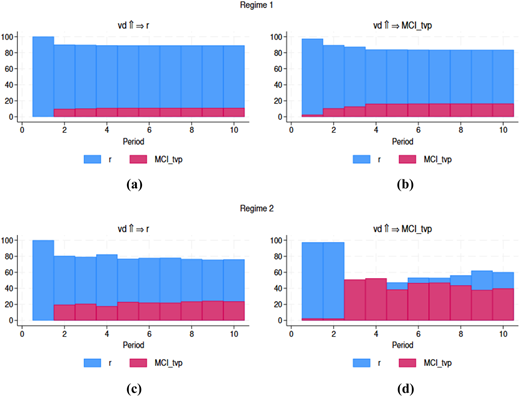
In Regime 1, Figure 10 graph (a) shows that rt explains 100% of its own variance, indicating it is entirely self-driven. As time progresses, this dominance decreases slightly, stabilizing around 88.99%, meaning rt remains largely influenced by its own past values. The MCI_tvp impact starts at 0% but gradually increases to approximately 11.01%, showing a small but growing influence on rt fluctuations. This suggests that while rt remains mostly self-determined, MCI_tvp starts playing a minor role in explaining its variations. Figure 10 graph (b) reflects that initially, MCI_tvp explains 97.49% of its own variance, indicating strong self-dependence. However, its influence gradually declines over time, stabilizing around 83.57%, showing that external factors start playing a role. The rt contribution starts at 2.51% and increases to approximately 16.43%, suggesting that rt impact on MCI_tvp grows over time, though MCI _tvp remains predominantly self-driven. Figure 10 graph (c), initially, rt explains 100% of its own variance, indicating complete self-dependence. Over time, its explanatory power declines, reaching around 76.28%, suggesting growing external influences. The MCI_tvp contribution starts at 0% but increases to approximately 23.72%, highlighting its increasing role in explaining rt fluctuations over time. Figure 10 graph (d), initially, MCI_tvp explains 97.49% of the variance in rt, indicating a strong external influence. Over time, rt contribution increases, reaching about 50.90%–52.57% before declining again. This suggests rt gains explanatory power but remains significantly influenced by MCI_tvp, stabilizing around 60%–62% influence from MCI _tvp in the later periods.
The findings have important implications for South African monetary policy and the communication strategies of the South African Reserve Bank (SARB). The contrast between the constant-parameter MCI_cnt and the time-varying MCI_tvp highlights the dynamic nature of monetary conditions in an emerging market context, where external shocks and domestic vulnerabilities frequently necessitate state-dependent policy responses. The observed spikes in MCI_tvp, particularly during the 2008 Global Financial Crisis, the 2015–2017 political and commodity shock episode, and the COVID-19 pandemic, indicate that the SARB's policy stance is highly responsive to both domestic and international economic disturbances. This responsiveness underscores the importance of transparency and clear communication, as stakeholders – financial markets, businesses and households require timely and credible signals regarding the central bank's intentions to guide expectations and behavior. The aggressive coefficients on inflation and output gaps in the MS-VAR results suggest that the SARB often adopts a more hawkish stance than the conventional Taylor rule would prescribe, particularly in high-volatility regimes. While Taylor-type rules provide a benchmark for systematic interest rate setting, the evidence here indicates that rigid adherence may not adequately capture the state-dependent realities faced by the SARB, especially in periods of heightened uncertainty or financial stress. In such cases, reliance on a static MCI or simple Taylor-type prescriptions could understate the role of external shocks, such as exchange rate volatility, in shaping monetary conditions. The time-varying MCI provides a more realistic and flexible framework, capturing the evolving weights of interest rate and exchange rate contributions to monetary policy transmission, which aligns with SARB's actual operational approach.
From an implementation perspective, the findings emphasize the feasibility and utility of integrating time-varying indicators into monetary policy frameworks. The SARB could consider publishing or communicating a time-varying MCI as part of its regular monetary policy reports to enhance transparency. Doing so would provide markets with a forward-looking gauge of overall monetary conditions, facilitating more informed expectations and reducing the risk of misaligned private sector responses. Moreover, the regime-dependent effects highlighted by the Markov-Switching results suggest that policy tools, such as the repo rate, should be flexibly adjusted in response to both domestic cyclical conditions and external shocks, rather than mechanically following static rules. This flexible, state-dependent approach supports the SARB's dual objectives of price stability and sustainable growth while maintaining credibility during periods of volatility. Finally, the variance decomposition and IRF results indicate that the repo rate remains a dominant driver of monetary conditions, but the influence of exchange rates and external shocks grows in high-volatility periods. This finding reinforces the importance of a holistic monetary policy strategy that combines interest rate adjustments with vigilant monitoring of financial and currency market developments. Policymakers should therefore treat the MCI not only as a measurement tool but also as a decision-support framework that captures the nuanced interplay between domestic and external drivers of monetary conditions, guiding both operational implementation and forward-looking communication.
5. Concussion
This study elucidates the dynamic nature of monetary policy transmission mechanisms in South Africa, revealing that the weights assigned to interest rates and exchange rates within the MCI are not static but vary over time. This variability underscores the necessity for policymakers to adapt their strategies in response to shifting economic conditions, recognizing that the influence of interest rates and exchange rates on overall monetary conditions is not uniform across different periods. The analysis highlights a significant sensitivity of the MCI to changes in interest rates, with substantial positive and negative contributions from real interest rates that emphasize the critical role of interest rate policies in shaping economic outcomes. Furthermore, the findings indicate a rising importance of exchange rate fluctuations in influencing monetary conditions, particularly in the latter periods of the analysis. This trend accentuates the need for policymakers to incorporate exchange rate dynamics into their monetary policy frameworks, especially in a small open economy where external factors wield considerable influence.
The Markov-Switching results suggest that the South African Reserve Bank (SARB) adopts an aggressive policy stance in response to inflationary pressures, as indicated by coefficients that exceed those typically seen in the Taylor rule. This aggressive approach suggests a prioritization of price stability, with a readiness to implement significant interest rate adjustments to stabilize inflation expectations, thereby reinforcing the SARB's credibility. Additionally, the analysis reveals that the effects of output gaps on interest rates vary across different regimes, with a more pronounced responsiveness of the repo rate during periods of external volatility. The impulse response functions further illustrate the asymmetric and persistent effects of shocks to the repo rate and MCI, underscoring the need for a nuanced understanding of the interactions between monetary policy instruments and economic indicators. These shocks may lead to prolonged adjustments rather than immediate equilibria, suggesting that relying solely on interest rate adjustments may prove inadequate in managing monetary conditions.
Author contributions
R.C.N.: Conceptualization, manuscript writing and analysis. E.M.B.: Main supervisor, methodology and estimation. A.M.: Co-supervisor and analysis.
Notes
RVECM estimates evolve across economic phases, showing the economy's adjustment to equilibrium.
An MS-VAR model accounts for shocks or crises, showing that interest and exchange rates can have stronger effects during unstable periods than in normal times.
A time-varying approach to MCI tvp management allows for a more flexible assessment of the evolving macroeconomic landscape. Given the persistent and nonlinear responses in Regime 2, a dynamic MCI framework would better capture shifts in financial conditions and provide a more responsive policy tool. Such an approach aligns with modern monetary policy frameworks emphasizing state-dependent responses, where central banks adjust policy parameters in real-time based on evolving macro-financial conditions.