Skip to article sections
Purpose

The Nobel Prize is widely regarded as the pinnacle of scientific, literary and humanitarian achievement; yet, the institutional and funding mechanisms associated with this recognition remain poorly understood. This study examines how institutional affiliations, collaboration networks and major public research funding programmes are associated with Nobel Prize outcomes.

Design/methodology/approach

The study develops a data-driven framework that integrates large-scale structured datasets with publicly available biographical information on institutional affiliations, doctoral training, nominations and geographic trajectories. The resulting dataset comprises 20,126 nominations, 963 laureates and extensive institutional linkages. Statistical testing, network analysis, changepoint detection, time series modeling and institutional effectiveness indicators, including prizes per nomination, are used to identify institutional and temporal patterns.

Findings

Results show a significant association between university affiliations and Nobel recognition, with marked differences in institutional effectiveness. Temporal analyses reveal structural shifts in affiliation patterns over time. Evaluation of the European Framework Programmes, particularly Horizon initiatives, indicates increased Nobel activity after 2014, following a prolonged period of stagnation. The findings highlight the importance of institutional environments, geographic concentration and sustained research funding in supporting scientific excellence.

Originality/value

This study integrates nomination-level data, institutional networks, statistical modeling and funding programme analysis within a unified empirical framework. By linking Nobel outcomes to institutional, geographic and policy contexts, it provides a comprehensive perspective on the factors associated with scientific excellence.

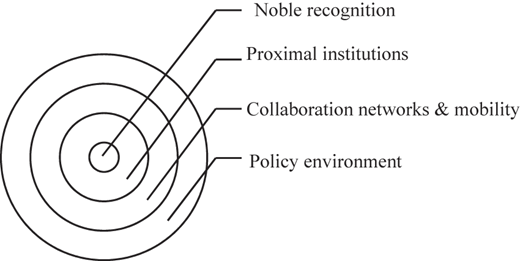
Advancing human knowledge and fostering innovation are central to societal progress. Research and development efforts within educational institutions, are important in addressing global challenges. The mechanisms that enable individuals and institutions to achieve groundbreaking outcomes remain an open question. Understanding these dynamics is important for designing policies and nurturing environments that maximize the potential for high-impact research. However, its awarding is not merely a function of individual brilliance; rather, it is shaped by a web of interconnected factors. Universities, for instance, provide the intellectual infrastructure, resources and networks that can catalyze discoveries. Groundbreaking findings are celebrated as awards such as the Nobel Prize. A recent study by von Zedtwitz et al. (2025) introduced the concept of the “Nobel ‘Pride’ Phenomenon,” highlighting how institutions and countries often claim undue credit for laureates despite significant geographic and temporal disconnects between discoveries and awards. The research findings reveal that over 80% of Nobel discoveries are concentrated in five countries and 30% of laureates were immigrants who frequently changed institutions between discovery and recognition (Figure 1). Recent evidence further suggests that major scientific breakthroughs are frequently enabled by the development of new scientific methods and research instruments. Krauss (2026), analyzing more than 750 Nobel and major non-Nobel discoveries, argues that transformative discoveries often emerge through access to novel observational and analytical tools, reinforcing the importance of institutional environments and funding systems capable of sustaining advanced research infrastructures and experimentation. Therefore, countries with robust R&D funding mechanisms, favorable academic environments and strong institutional support are more likely to produce Nobel laureates: this study aims at analyzing this statement.

Collaboration networks play an important role beyond institutional affiliation. Laureates operate within academic circles where mentorship and co-authorship are essential. These networks, often spanning countries and disciplines, amplify the reach of innovative ideas. Krauss (2024a, b) reports that 54% of Nobel Prize discoveries come from interdisciplinary scientists with degrees in multiple fields. The study also finds that 30% of major discoveries originate from 25 universities, highlighting institutional prestige. It is also seen that older scientists contribute fewer breakthroughs, and recognition delays are increasing, indicating a need to better support interdisciplinary and early-career researchers. Han et al. (2024) identify similar patterns in international mobility among elite scientists. The geographic distribution of laureates further reflects broader societal and economic shifts, including the rise of American institutions and the continued relevance of European centers of excellence. Americans historically account for most Nobel Prize winners (Neikirk et al., 2024).

More recently, European Union-funded researchers have gained visibility, exemplified by the 2024 Nobel Prize in Chemistry awarded to a recipient supported by Horizon Europe and European Research Council (ERC) funding (Ministry of University Research, 2024). This outcome highlights the role of EU programs in promoting research excellence and enabling transformative discoveries. Horizon programmes emerged in response to stagnation in EU innovation indicators (Veugelers et al., 2015). Horizon 2020, in particular, introduced unprecedented funding for R&D and innovation. The EU operates as a consortium of member states, unlike centralized systems in the United States and China. Historically, the EU has struggled to compete with the US, while competition from China has intensified, as reflected in innovation indicators (Hu et al., 2024). This leads to emerging economies that now dominate through efficient R&D investment, advanced infrastructure and large talent pool. Such conditions prompted strategic interventions such as Horizon 2020 and Horizon Europe within the EU. Horizon programs have strengthened the EU research landscape through substantial funding for multidisciplinary and collaborative projects. Recently, several awardees of Nobel Prize are affiliated with institutions in Horizon-participating countries, and the 2024 Chemistry Nobel further illustrates their role in improving European competitiveness. However, limited research examines these patterns in depth. Most existing studies rely on indicators such as the h-index, which presents methodological limitations, or other studies that focus on implications of the awarding and new directions for the scientific progress (Ali, 2026). Addressing these challenges requires statistical methods and network analysis to capture the relationship between affiliations, career trajectories and prize outcomes. This study contributes by analyzing these dynamics to better understand laureate pathways and inform potential future policies that support high-impact research. The paper proceeds as follows: Section 2 reviews the literature, Section 3 outlines the methodology and dataset, Section 4 presents the findings and Sections 5 and 6 discuss policy implications and conclusions.

The distribution of Nobel Prizes across countries has evolved over time, particularly regarding the institutions associated with laureates. A clear shift shows the United States surpassing Europe as the leading region for Nobel-affiliated researchers. This change is partly linked to a more adaptable US research environment that attracts scholars from diverse backgrounds into academic and non-governmental institutions (Zhang and Zhang, 2023). Although based mainly on descriptive statistics, the evidence highlights strong US dominance, especially in Physics, Chemistry, Medicine and Economics. A key driver is the country’s sustained ability to attract international talent, which has significantly advanced American research (Stephan, 2012). Per capita evidence indicates a peak in US Nobel achievements during the 1970s, reinforcing its historical leadership (Royal Society, 2018). Recent studies emphasize the importance of interdisciplinary collaboration, supported by institutions such as the National Institutes of Health and the National Science Foundation, which have enabled both basic and applied research (Veugelers et al., 2020). Moreover, innovation process has shifted and now increasingly requires deeper specialization, reflected in longer training periods, delayed first contributions and larger research teams (Jones, 2009).

Schlagberger et al. (2016) examined the educational backgrounds of Nobel laureates but relied on a limited sample of 155 cases and descriptive measures, reducing generalizability. Their findings identify institutions such as UC Berkeley, Columbia University and Massachusetts Institute of Technology as producing “stable” laureates who remain affiliated throughout their careers. In contrast, prize-winning work often occurs at institutions like Cambridge University, UC Berkeley and organizations such as AT&T Bell Laboratories (Schlagberger et al., 2016). More evidence shows that the United States and United Kingdom frequently depend on internationally educated talent, while Germany plays a key role in training laureates, particularly in physiology and medicine (Heinze and Fuchs, 2022). National trends do not always align with institutional patterns. Princeton reflects a broader US decline in Nobel-level education, whereas Cambridge shows increasing output, diverging from overall UK trends (Gingras and Wallace, 2010). Another strand of literature examines cross-country disparities among laureates. Networks surrounding prize winners often correlate with geographic origin, and both mentorship lineage and nationality influence the probability of receiving a Nobel Prize. Scientists from developing countries generally require more time to achieve major breakthroughs compared to those from developed nations (Rodríguez, 2022; Chariker et al., 2017; Tol, 2022). Even among industrialized nations, notable variations persist. Chan and Torgler (2015) examine award distributions before and after the Nobel Prize, identifying a pattern of increasing recognition followed by decline. Their findings highlight disciplinary and geographic differences. Laureates educated in the United Kingdom tend to accumulate more awards at peak recognition, whereas those trained in the United States reach their highest acclaim after receiving the Nobel Prize. Domestic availability of prestigious awards also shapes these patterns. Researchers in the United States secure a larger share of major honors, a trend partly reflected in UK physics, although differences in means are not statistically significant (Chan and Torgler, 2015). Several studies adopt bibliometric approaches to analyze publication patterns among Nobel laureates. These works focus on individual attributes or discipline-specific characteristics. Chemistry is examined by Tong and Ahlgren (2017), Jewish laureates by Kissin (2011), economics by Bjork et al. (2014) and Krauss (2024a, b), physics and chemistry by Gingras and Wallace (2010), physics by Zhang et al. (2019), physiology or medicine in Italy by Padrini et al. (2021) and Ukrainian scientists by Nazarovets (2020). Other studies take a broader perspective. Zhou et al. (2014) analyze impact factors, while Molina et al. (2021) and Huang et al. (2023) use difference-in-differences models to compare citation trajectories of laureates and collaborators. Erkol et al. (2023) investigate general publication strategies. Another strand of research examines network dynamics among laureates, focusing on institutional affiliations at the time of the award and during doctoral training. Chan et al. (2015) analyze collaboration patterns after prize receipt. Other studies explore how ideas diffuse within elite networks, as shown by Eubanks et al. (2016) and Kim et al. (2015). The literature shows that both individual characteristics and institutional environments shape the likelihood of receiving a Nobel Prize. In the European Union, research funding mechanisms have played a key role in supporting high-impact science. Since 1984, the EU Framework Programmes have evolved into Horizon 2020 and Horizon Europe, launched in 2021 with a €95.5 billion budget running until 2027. These initiatives aim to support groundbreaking research across member states. This study examines whether EU programmes have increased the number of European Nobel laureates compared to earlier periods.

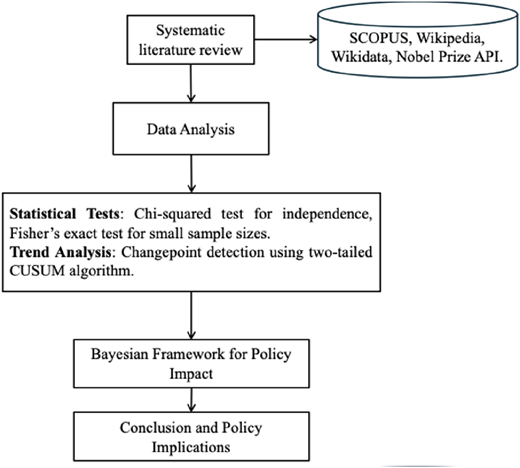
The methodology employed involves collecting data that is analyzed through both quantitative and qualitative lenses to derive meaningful insights, with statistical analysis serving as the central component in the methodology (Figure 2). To examine the relationship between Nobel Prize attainment and institutional affiliation, a chi-squared test was utilized, while Fisher’s exact test addressed instances with smaller sample sizes. The study covers the period from 1970 to 2024, allowing for a detailed exploration of long-term patterns in institutional prestige and award distribution. Given that nomination data is only publicly available from 1970 onwards, the statistical focus remained on institutional affiliations at the time of receiving the award rather than during earlier career stages. Temporal trends and shifts in laureate affiliations were also explored using changepoint detection, implemented through an enhanced two-tailed cumulative sum (CUSUM) algorithm (Basseville and Nikiforov, 2013). This method allowed for identifying changes in the distribution of Nobel affiliations over time, with a focus on long-term trends. There were examined differences in the mean number of laureates before and after the initiation of the Horizon research funding programs in 2014.

The data are from official source, that is the Nobel Prize application programming interface (API), and unofficial repositories like Wikipedia and Wikidata. The details of the collected data are mentioned in Table 1. The process of data collection involved compiling comprehensive datasets, including variables such as laureate affiliations, doctoral education, geographic details and nominations. The nomination records are publicly released only after a 50-year embargo. Analyses using nominations are limited to cohorts for which records are available and are reported separately from 1970 to 2024 award trends. Missing data were addressed through an algorithm that assigned universities to laureates based on available contextual information, enhancing the dataset’s completeness and reliability. Institutional affiliations were extracted from multiple sources, including the Nobel Prize API, Wikidata and Wikipedia, and subsequently harmonized through a multi-step cleaning procedure. This process involved standardizing institution names to account for variations in spelling, language and historical naming conventions. In cases where multiple affiliations were reported for a single laureate, priority was assigned to the affiliation listed at the time of award. When this information was incomplete or ambiguous, additional contextual information, such as biographical records and employment histories, was used to assign the most relevant institution.

Given the restricted availability of nomination data, which was publicly accessible only up to 1970, the statistical tests focused primarily on affiliations at the time of receiving the award rather than earlier career nominations. The award analyses use 1970–2024 laureate data. The nomination-based analyses use the declassified records available after the 50-year embargo and are reported separately; institution-level nomination counts are computed only within those restricted cohorts. A detailed description of the statistical framework for this analysis, including the specification, assumptions and limitations of both the chi-squared test of independence (Appendix 1) and Fisher’s Exact Test (Appendix 2), is provided in the online appendix. The chi-squared test was employed to assess overall dependence between institutional affiliation and Nobel Prize success across a large contingency table, while Fisher’s Exact Test was subsequently applied to smaller subsamples where expected cell counts violated chi-squared assumptions. Together, these complementary approaches ensure robustness in identifying non-random patterns of institutional representation across Nobel Prize categories. The results of the Fisher’s Exact Test indicated differences in the likelihood of Nobel Prize success across institutions. In particular as seen in Appendix Table A1, Princeton University was found to be significantly underrepresented in Nobel laureates in Medicine despite its prominence in other scientific fields. Conversely, the Washington School of Medicine had exclusively produced laureates in Physiology or Medicine, reinforcing the idea that some institutions maintain a narrow but highly productive disciplinary focus. These results indicate that as in the case of some universities that do not merely produce Nobel laureates at random but rather tend to concentrate within specific disciplines, a trend that was initially suggested by the chi-squared test but further validated using Fisher’s Exact Test. The test also agrees upon the broader institutional strategies, where institutions with longstanding research focus on fundamental sciences, such as Caltech and ETH Zurich, exhibited high overall success rates, producing laureates across multiple disciplines. This finding aligns with earlier observations that Nobel production often reflects institutional specialization and disciplinary clustering (Freeman et al., 2024; Novosad et al., 2024). In contrast, universities with strong medical research programs tended to dominate in Physiology or Medicine but had limited influence in other prize categories, suggesting that institutional structure plays a fundamental role in shaping Nobel trajectories (Schlagberger et al., 2016; von Zedtwitz et al., 2025).

The analysis now shifts from institutional disparities to the evolution of Nobel affiliations over time and geography. While statistical tests confirmed significant institutional differences, they did not capture how affiliations changed. This section examines how temporal shifts, geographic trends and network structures have shaped Nobel recognition.

3.3.1 Geographic trends

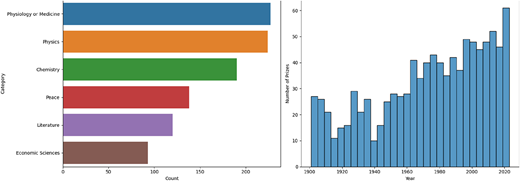
The changing distribution of Nobel Prizes emerges more clearly when examining annual data from 1901 to 2024. Figure 3 shows the distribution of laureates across disciplines and global yearly trends. Early decades were dominated by core scientific fields such as Physiology or Medicine and Physics, with Germany, France and the United Kingdom playing central roles in scientific advancement. The right panel illustrates a post-World War II increase in the number of laureates per year, reflecting both the expansion of scientific fields and the globalization of research. During the latter half of the 20th century, this growth continued, while Europe maintained a strong but declining relative share as other regions gained prominence in Nobel-winning research.

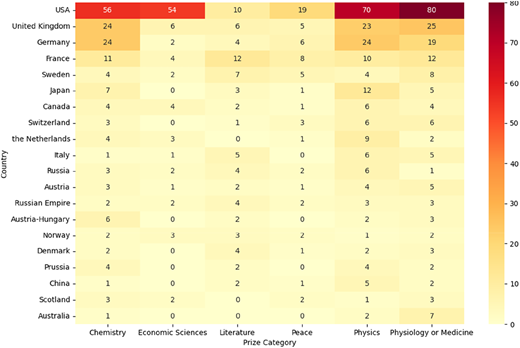
The distribution of Nobel affiliations has stabilized, with Europe maintaining a consistent but not dominant presence. This sustained share indicates that European institutions remain competitive despite growing global competition. Recent fluctuations indicate a modest strengthening of European representation. The chart does not establish causal policy effects but indicates that European institutions continue to play an important role within a more balanced global system. Figure 4 illustrates the geographic distribution of Nobel laureate affiliations across disciplines, including Chemistry, Economic Sciences, Literature, Peace, Physics and Physiology or Medicine, from 1901 onward.

The maps show a strong early concentration in European institutions, as seen in Germany, France and the United Kingdom. After the 1950s, the United States emerged as a dominant center for Nobel Prize–winning research, especially in Physics, Chemistry and Economic Sciences. The period after 1984 reflects a broader global distribution, with increased representation from Asia, Australia and parts of South America, indicating the continued internationalization of scientific excellence.

3.3.2 Changepoint detection

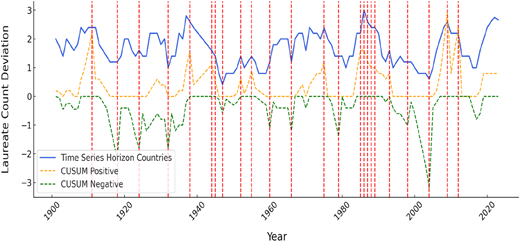
In the context of Nobel Prize affiliations, structural shifts in trends can be influenced by external factors such as research funding programs, institutional policies and global scientific movements. To study the effect, we use a modified two-tailed CUSUM algorithm, an extension of the method introduced by Page (1954) and later refined by Basseville and Nikiforov (1993). The advantage of this approach lies in its ability to capture gradual deviations while remaining robust to short-term fluctuations and outliers. The CUSUM (CS) algorithm tracks cumulative deviations from a central reference value, in this case, the median number of Nobel Prize affiliations within a given time window. The median was chosen over the mean to reduce the influence of extreme values, ensuring a more stable estimation. Two cumulative sums were computed for each time point: one accounting for positive deviations and the other for negative deviations. An identified changepoint indicates a shift in the distribution of Nobel Prize affiliations that surpassed a predefined threshold. To refine the threshold selection, additional statistical measures were employed to mitigate arbitrary choices. The dataset was segmented into twenty-year intervals to focus on long-term trends. We then calculate Kurtosis, skewness and median absolute deviation for each segment to account for potential deviations from normality. If a segment exhibited heavy-tailed distributions (kurtosis >3) or high asymmetry (absolute skewness >1), the threshold factor was increased by 1.5 to account for increased variance. The threshold factor of 1.5 follows conventions in robust statistics, originally proposed by Tukey (1977) in the context of boxplots. Tukey argued that, under a normal distribution, nearly all observations (≈99.3%) fall within 1.5 times the interquartile range, so values beyond this boundary can reasonably be treated as outliers. Following the same logic, we inflate the changepoint threshold by 1.5 in segments with high skewness or kurtosis, ensuring that only extreme and persistent deviations trigger changepoint detection. The final changepoint detection was determined using the following equations, which define the positive and negative cumulative sums and the adaptive threshold:

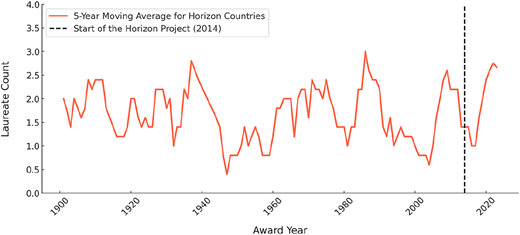
where, in these equations, CSi+ and CSi represent the positive and negative cumulative sums at the time i, Xits is the observed time series value, mediansegmenti is the median for the 20-year segment containing i and changepoints are flagged when either cumulative sum exceeds the adaptive threshold, defined as four times the segment’s median absolute deviation (or six times if higher kurtosis or skewness is observed). The changepoint detection algorithm was applied to a smoothed time series of Nobel Prize affiliations using a five-year rolling average. The choice of a five-year window is consistent with the typical scale of Nobel Prize awarding cycles and reduces the influence of single-year anomalies due to unusually high or low award counts. By averaging across this horizon, the analysis emphasizes persistent trends while filtering out short-term volatility, thereby improving the reliability of the CUSUM changepoint detection. Figure 5 illustrates the five-year moving average (MA) of Nobel Prize affiliations for Horizon-associated countries between 1901 and 2024. The time series shows recurring fluctuations with alternating periods of growth and decline. A gradual rise in affiliations is evident after 2010, peaking around the introduction of the Horizon 2021 program; although the increase becomes sharper in the period 2017–2024. The vertical line marks the start of Horizon 2020 (2014), after which the series enters a sustained upward phase that peaks in the early 2020s. While this pattern suggests that EU research programs may have potentially reinforced an ongoing trajectory, the trend also reflects broader long-term dynamics rather than a sudden shift tied only to Horizon funding.

Figure 6 illustrates the results of the changepoint detection analysis. There are shifts in the data that were observed in 2017 and 2022, following major research programs’ introduction. These changepoints reflect an overall increasing trend in Nobel Prize affiliations. However, the results must be interpreted with caution, as they provide an overview of temporal shifts rather than direct causal relationships. The next section further investigates the underlying data-generating process to substantiate these findings.

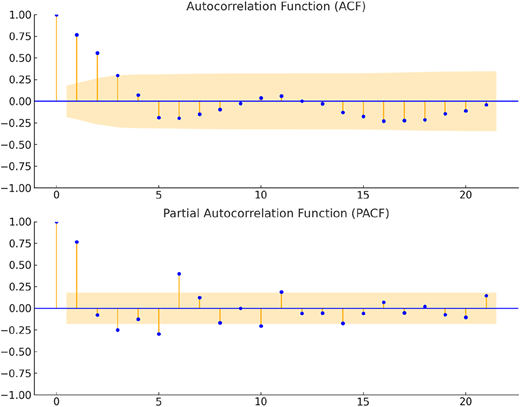
Changepoint detection identifies periods of significant shifts in Nobel Prize affiliations but does not explain their structural drivers or indicate whether they follow recurring patterns. While these points highlight moments of change, it remains unclear whether they arise from underlying trends or random variation. Time series analysis addresses this issue by examining the data-generating process. We evaluate an autoregressive moving-average model (ARMA) model that confirms the presence of autoregressive (AR) and MA components, allowing assessment of whether past trends influence future patterns as well. This distinction clarifies whether changepoints reflect isolated events or broader structural evolution trajectories. Figure 7 shows a gradually declining autocorrelation function, consistent with AR behavior. The partial autocorrelation function drops sharply after the first lag, suggesting a first-order AR process. Higher-lag partial autocorrelations appear irregular and likely reflect random variation. Model specification was refined through a grid search across parameter combinations in the 0–3 range.

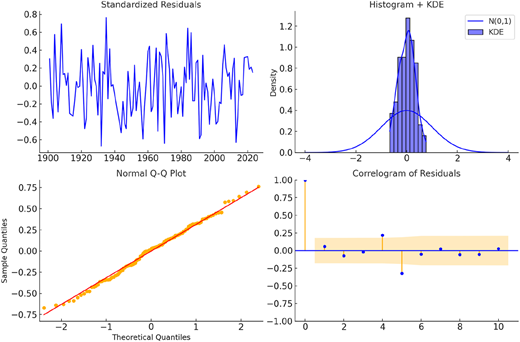
The optimal model was selected based on the lowest akaike information criterion value. This procedure identified an ARMA model with an AR component of order three and a MA component of order two as the best fit. The residuals from this model are approximately normally distributed and show no significant autocorrelation. However, the QQ plot (Figure 8) suggests that the distribution of residuals has heavier tails, resembling Student’s t distribution.

This expression defines a time series model with both AR and MA components. Here, Xt the value of the time series at time t is denoted. The term c represents a constant intercept, while the coefficients ϕ1,ϕ2 andϕ3 capture the influence of past observations at time steps t-1, t-2 and t-3, respectively. The terms θ1 θ2 represent the MA parameters, accounting for the influence of past residual errors ϵt1 and ϵt2. Finally, ϵt is a white noise error term, assumed to be normally distributed with zero mean.

However, as attached in Appendix Figure A2, only the AR coefficients contributed meaningfully to the model, whereas the MA terms did not. Consequently, the final model used for forecasting was simplified to an AR(3) process:

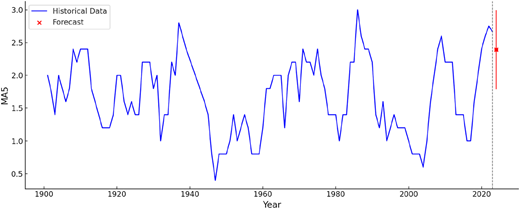
In order to assess the predictive accuracy of the model, the dataset was split into train (85% of the observations) and test, and a cross-validation was performed. The positive mean of the residuals (0.275) signals that the model systematically underestimates the real values. The mean absolute error is 0.29; therefore, reliable predictions should account for the discrepancies visible in Figure 9. By adjusting the forecasts using the mean of the residuals, it is possible to observe an increasing trend in the prediction for the next step. However, it should be recalled that the underlying series has been smoothed using a MA with a five-year rolling window; therefore, the results are not necessarily indicative of an increase in the number of Nobelists affiliated with the Horizon program in the next year. Nonetheless, the expectation of an increasing trend seems to be confirmed, taking into account a wide confidence interval. In particular, the adjusted prediction for the next year is 3.47 (CI: 2.83; 4.11), an increase of 0.077 with respect to the current year. While these results are limited, given the high uncertainty in the estimates, they offer a number of pioneering insights of a more comprehensive evaluation that should be postponed until the end of the program.

While the model effectively captures underlying patterns and enables forecasting, it is still necessary to determine whether the observed changes constitute a statistically significant break from historical trends. To this end, the methodology investigates whether there was a meaningful shift in the average level of Nobel affiliations following 2014, distinguishing structural changes from random variation, which marks the onset of a new phase under the Horizon program. We compare the mean values of the time series before and after 2014. Although a standard test on the sample mean is applicable, it does not fully address the uncertainty associated with the true mean of the post-Horizon period, which is still unfolding. This approach, however, introduces certain challenges, particularly in selecting appropriate prior distributions for the periods before and after the intervention. While an informative prior can enhance estimate by incorporating existing knowledge, it also carries the risk of biasing results if not based on sound assumptions. To address this, the dataset was divided into pre- and post-Horizon program periods. The Shapiro–Wilk test was then applied to both subsets to assess whether the dependent variable could reasonably be modeled using a normal distribution. The resulting p-values were 0.22 for the pre-intervention period and 0.32 for the post-intervention period, indicating that the null hypothesis of normality cannot be rejected in either case. These outcomes support the assumption that the data are normally distributed. Based on this, two noninformative Normal priors, centered at zero with a standard deviation of 10, were selected for the unknown means. This choice reflects the Normal distribution’s property as its own conjugate prior, ensuring the posterior distributions also remain Normal and analytically tractable. Given the widespread of the priors, they remain flat and effectively noninformative, incorporating minimal prior bias while maintaining a realistic degree of uncertainty in the estimation process. While the derivation is the same, the formulas will be applied to two datasets representing the pre- and post-intervention periods. In general, assume that a number of observations are available; this is the data D. Assume also that these data have been produced by a Normal distribution characterized by a mean value representing the level before or after a certain event was registered, this is μ. Put differently, the problem may be described as an attempt at estimating the population mean since P(D|μ,σ2) represents the observations:

where the first term of the product represents the likelihood of the data, and the other terms are the priors for the parameters. However, in the present case, sigma has been defined as fixed and equal to ten. Therefore, the only distributions involved are

Expanding the terms and performing all the calculations, it is possible to reduce the following equation to a posterior Normal distribution having the following parameters (with p for posterior):

where the mean and standard deviation of the prior distribution are zero and ten, respectively, and the mean and standard deviation of the data are estimated sequentially using the following formulas:

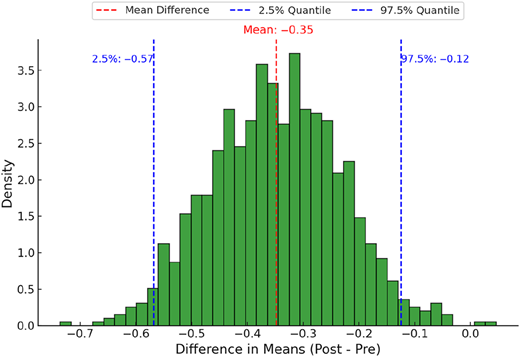
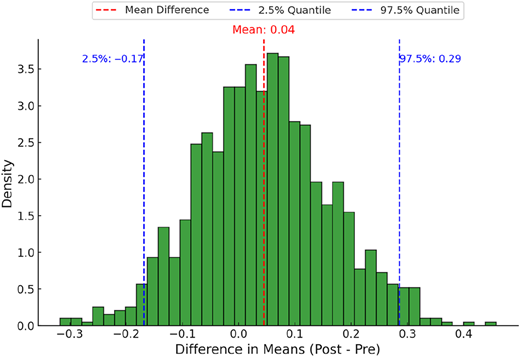
When applied to the four subsets of the main dataset, the resulting posterior distributions incorporate variance estimates derived from the observed data, providing a more context-sensitive basis for inference regarding the mean number of Nobel affiliations. The first comparison, corresponding to Figure 10, contrasts the period from 1984 to 2024 with the earlier historical baseline from 1901 to 1983. This analysis yields a posterior mean difference of approximately −0.35. The 95% credible interval, however, does not include zero, suggesting evidence for a substantial difference between the two periods. This outcome reinforces the notion that fluctuations during the Horizon period are not simply part of a long-term upward trend in Nobel affiliations. A different result is observed in Figure 11, which compares the post-Horizon decade (2014–2023) with the much longer pre-Horizon period from 1901 to 2013. Here, the posterior mean difference is estimated at 0.04, and the associated credible interval spans zero. These findings indicate that, when placed against a century-long reference frame, the Horizon programme does not appear to mark a distinct shift in Nobel-related affiliations.

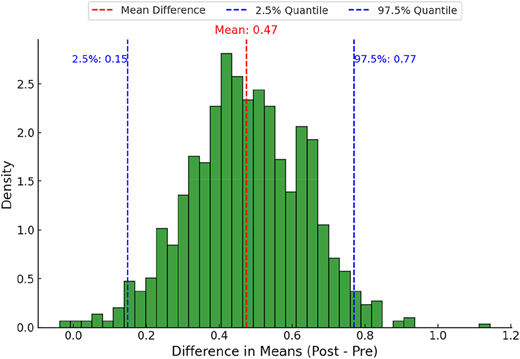
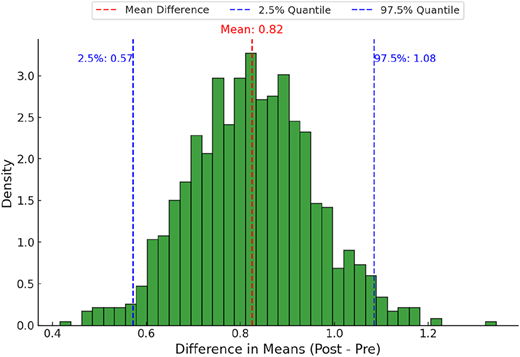
The analysis becomes more informative in Figure 12, where the Horizon period (2014–2023) is compared with the immediately preceding decade (2000–2013). The posterior mean difference is approximately 0.47, and the corresponding credible interval is narrower than in the previous comparison while remaining centered on positive values. This result provides evidence of a positive difference between the two periods and suggests the emergence of a shift in institutional recognition associated with the Horizon initiative. Figure 13 provides the strongest support for this pattern. The comparison isolates the most recent period, from 2021 to 2023 and contrasts it with the 2000–2013 baseline. The resulting posterior mean difference is approximately 0.82 and the 95% credible interval excludes zero, indicating strong evidence that the later Horizon period is associated with higher Nobel activity than the reference period. Taken together, these findings suggest that, although the full Horizon period does not differ substantially from earlier historical baselines, the years after 2021 are associated with a more pronounced increase in Nobel affiliations.

The methodology and subsequent analysis revealed relationships between university affiliations and the likelihood of receiving a Nobel Prize, with notable institutions such as the California Institute of Technology, Harvard University and Stockholm University emerging as key contributors across various categories. There are also observed disparities between nomination volume and actual success rates. Similarly, doctoral education played a pivotal role in Nobel achievements, with institutions, such as ETH Zurich and the Polytechnic University of Milan, demonstrating more success rates relative to their nomination counts. Trends indicated that specialized institutions, such as the Washington School of Medicine, excel in producing laureates in specific fields like Physiology or Medicine, underscoring the role of institutional focus in fostering groundbreaking research. The geographic and temporal analyses still highlight the United States’ lead over Europe over recent decades: however, in recent years, the EU countries demonstrate periods of increased Nobel activity, particularly post-2014 time frame, coinciding with the Horizon research funding program. The positive shifts were particularly evident in the 2021–2023 timeframe when compared to pre-Horizon periods (e.g. 2000–2013), emphasizing the potential role of Horizon and Horizon Europe initiatives in upgrading research productivity. These findings highlight the effectiveness of targeted funding and institutional support in driving scientific recognition, with improvement in the contributions of European-affiliated laureates.

The findings carry policy and open market-related implications for enhancing scientific productivity and recognition at both institutional and national levels. The identity of the European Union has faced scrutiny over the years, especially during periods of economic crisis, undermining both policy effectiveness and public support for the EU (Manners and Murray, 2016). However, even in those periods, the Nobel Peace Prize of 2012 was instrumental in improving the EU’s image in global politics. Generally, Europe has changed fundamentally since the Single Market was launched. To a large extent, the integration has reached high levels in many, though not all, sectors of the economy and society. However, comprising a geographically large area and 27 Member States, naturally, diversity and complexity of the legal system in force has increased. These developments no longer allow the reliance on mere convergence of national legislation and mutual recognition, which have become too slow and complex or insufficient to benefit from economies of scale. Even though these aspects are widely known, the benefits of a single market of research, as demonstrated in the study, are slowly gaining a lot of attention. The funding expenditures in the union have long promised gains; however, studies are needed to empirically point to the success of the financial union in the research. Our study, as a primary step, argues in favor of an approach and European integration by constructing and applying an analytical framework drawing on different theoretical perspectives. In this regard, the demonstrated link between university affiliation and Nobel Prize success highlights the importance of sustained investment at the national and union levels in research infrastructure and academic environments that foster innovation. The policymakers should prioritize funding for institutions with proven records of producing high-impact research and/or adopt strategies to strengthen collaborations between universities and research-intensive organizations with other emerging institutions.

The Horizon program, particularly through its role in the creation of the European Research Area (ERA), showcases how structured research funding can foster innovation. Initiatives like the Marie Curie Actions and the ERC have supported early-career researchers and high-profile senior scientists. Additionally, framework program grants requiring collaboration among at least three institutions from different EU or associated countries (e.g. Switzerland, Norway) have demonstrated the value of multinational cooperation in research. The expanding access to these programs for small and medium-sized enterprises and addressing societal challenges has further aligned scientific efforts with market and community needs. Additionally, the geographic shifts in laureate affiliations highlight the need for equitable research funding to support institutions in emerging regions, potentially leveling disparities in global scientific contributions. Programs like Horizon have shown that structured and well-funded initiatives can significantly enhance research outcomes, offering a replicable model for fostering scientific excellence globally.

This study examined the institutional, geographic and temporal factors associated with Nobel Prize success through a unified analytical framework. The framework integrated nomination records, institutional affiliation data, collaboration networks and publicly available biographical information, allowing statistical testing, network analysis, changepoint detection and time series modeling to be considered within a single empirical analysis. The results demonstrate that institutional affiliation is associated with Nobel Prize success and that differences exist in the effectiveness of universities and research organizations in producing Nobel laureates. The temporal analyses further revealed structural changes in institutional affiliation patterns over time, while the forecasting and mean difference analyses identified an upward trend in Nobel activity among Horizon associated countries after 2014, with the increase observed during the 2021–2023 period. The findings highlight the potential role of European Framework Programmes in supporting high-quality research. The observed increase in Nobel activity during the later years of the Horizon programme is consistent with the broader objective of strengthening the ERA through coordinated investment and international collaboration. At the same time, the present study was designed to identify temporal and institutional patterns rather than causal relationships. Consequently, although the observed changes coincide with the introduction of Horizon programmes, the analyses cannot determine the extent to which these funding initiatives directly contributed to the increase in Nobel Prize outcomes. Several limitations should therefore be considered when interpreting the results and further improved in future research. The analyses rely on secondary data sources, and the institutional assessment is based on affiliations recorded at the time of Nobel Prize recognition rather than at the institution where the prize-winning discovery was originally conducted. As highlighted by von Zedtwitz et al. (2025), the location of scientific discovery and the affiliation at the time of the award frequently differ, meaning that the present framework captures the institutional context of recognition rather than the environment in which the underlying research was performed. These constraints do not diminish the value of the findings, but they define the scope within which they should be interpreted. Future research can build upon this framework by incorporating more comprehensive longitudinal information on researcher mobility, institutional affiliations and funding allocation throughout scientific careers. Additional statistical models, including logistic or probit regression, could further quantify how institutional characteristics influence the probability of Nobel recognition. Finally, extending the framework to include broader innovation indicators, such as patent activity and technology transfer, would provide a more comprehensive understanding of how research investment translates into scientific breakthroughs and international recognition.

The authors would like to thank Gabriele Donato for his preliminary support in the analysis.

The supplementary material for this article can be found online.
Ali
,
W.
(
2026
), “
Can the 2025 Nobel prizes in physics and economics inspire a ‘quantum’ turn in tourism research?
”,
Annals of Tourism Research
, Vol. 
117
, 104115, doi: .
Basseville
,
M.
and
Nikiforov
,
I.V.
(
1993
),
Detection of Abrupt Changes: Theory and Application
,
Prentice-Hall
,
Hoboken
,
[PubMed]
.
Bjork
,
S.
,
Offer
,
A.
and
Söderberg
,
G.
(
2014
), “
Time series citation data: the Nobel Prize in economics
”,
Scientometrics
, Vol. 
98
No. 
1
, pp. 
185
-
196
, doi: .
Chan
,
H.F.
and
Torgler
,
B.
(
2015
), “
The implications of educational and methodological background for the career success of Nobel laureates: an investigation of major awards
”,
Scientometrics
, Vol. 
102
No. 
1
, pp. 
847
-
863
, doi: .
Chan
,
H.F.
,
Önder
,
A.S.
and
Torgler
,
B.
(
2015
), “
Do Nobel laureates change their patterns of collaboration following prize reception?
”,
Scientometrics
, Vol. 
105
No. 
3
, pp. 
2215
-
2235
, doi: .
Chariker
,
J.H.
,
Zhang
,
Y.
,
Pani
,
J.R.
and
Rouchka
,
E.C.
(
2017
), “
Identification of successful mentoring communities using network-based analysis of mentor–mentee relationships across Nobel laureates
”,
Scientometrics
, Vol. 
111
No. 
3
, pp. 
1733
-
1749
, doi: .
Erkol
,
Ş.
,
Sikdar
,
S.
,
Radicchi
,
F.
and
Fortunato
,
S.
(
2023
), “
Consistency pays off in science
”,
Quantitative science studies
, Vol. 
4
No. 
2
, pp. 
491
-
500
, doi: .
Eubanks
,
D.L.
,
Palanski
,
M.E.
,
Swart
,
J.
,
Hammond
,
M.M.
and
Oguntebi
,
J.
(
2016
), “
Creativity in early and established career: insights into multi-level drivers from Nobel Prize winners
”,
Journal of Creative Behavior
, Vol. 
50
No. 
4
, pp. 
229
-
251
, doi: .
Freeman
,
R.B.
,
Xie
,
D.
,
Zhang
,
H.
and
Zhou
,
H.
(
2024
), “High and rising institutional concentration of award-winning economists”, in
NBER Summer Institute - the Science of Science Funding
.
Gingras
,
Y.
and
Wallace
,
M.L.
(
2010
), “
Why it has become more difficult to predict Nobel Prize winners: a bibliometric analysis of nominees and winners of the chemistry and physics prizes (1901-2007)
”, Vol. 
82
No. 
2
, pp. 
401
-
412
, doi: .
Han
,
F.
,
Zhang
,
R.
,
Zhang
,
S.
and
Yuan
,
J.
(
2024
), “
International mobility characteristics, effects of, and effects on elite scientists
”,
Journal of Informetrics
, Vol. 
18
No. 
1
, 101485, doi: .
Heinze
,
T.
and
Fuchs
,
J.E.
(
2022
), “
National and organizational patterns of Nobel laureate careers in physiology/medicine, physics, and chemistry
”,
Scientometrics
, Vol. 
127
No. 
12
, pp. 
7273
-
7288
, doi: .
Hu
,
F.
,
Qiu
,
L.
,
Wei
,
S.
,
Zhou
,
H.
,
Bathuure
,
I.A.
and
Hu
,
H.
(
2024
), “
The spatiotemporal evolution of global innovation networks and the changing position of China: a social network analysis based on cooperative patents
”,
R&D Management
, Vol. 
54
No. 
3
, pp. 
574
-
589
, doi: .
Huang
,
Y.
,
Tian
,
C.
and
Ma
,
Y.
(
2023
), “
Practical operation and theoretical basis of difference-in-difference regression in science of science: the comparative trial on the scientific performance of Nobel laureates versus their coauthors
”,
Journal of Data and Information Science
, Vol. 
8
No. 
1
, pp. 
29
-
46
, doi: .
Jones
,
B.F.
(
2009
), “
The burden of knowledge and the ‘death of the renaissance man’: is innovation getting harder?
”,
The Review of Economic Studies
, Vol. 
76
No. 
1
, pp. 
283
-
317
, doi: .
Kim
,
M.C.
,
Feng
,
Y.
,
Zhu
,
Y.
and
Ping
,
Q.
(
2015
), “
Quantitative exploration into the diffusion process of creative ideas in economics: Nobel prize laureates
”,
Proceedings of the Association for Information Science and Technology
, Vol. 
52
No. 
1
, pp. 
1
-
4
, doi: .
Kissin
,
I.
(
2011
), “
A surname-based bibliometric indicator: publications in biomedical journals
”,
Scientometrics
, Vol. 
89
No. 
1
, pp. 
273
-
280
, doi: .
Krauss
,
A.
(
2024a
), “
How Nobel-prize breakthroughs in economics emerge and the field’s influential empirical methods
”,
Scientometrics
, Vol. 
221
, pp. 
657
-
674
, doi: .
Krauss
,
A.
(
2024b
), “
Science’s greatest discoverers: a shift towards greater interdisciplinarity, top universities and older age
”,
Humanities and Social Sciences Communications
, Vol. 
11
No. 
1
, pp. 
1
-
11
, doi: .
Krauss
,
A.
(
2026
), “
New tools drive scientific discovery: evidence from all nobel-prize and major non-Nobel breakthroughs
”,
Humanities and Social Sciences Communications
, Vol. 
13
No. 
1
, p.
500
, doi: .
Manners
,
I.
and
Murray
,
P.
(
2016
), “
The end of a noble narrative? European integration narratives after the Nobel Peace Prize
”,
Journal of Communication and Media Studies: Journal of Common Market Studies
, Vol. 
54
No. 
1
, pp. 
185
-
202
, doi: .
Ministry of University Research
(
2024
), “
The commission published the results of the ex-post evaluation of horizon 2020 – researchitaly
”,
available at:
 Link to the website
Molina
,
J.A.
,
Iñiguez
,
D.
,
Ruiz
,
G.
and
Tarancón
,
A.
(
2021
), “
Leaders among the leaders in economics: a network analysis of the Nobel Prize laureates
”,
Applied Economics Letters
, Vol. 
28
No. 
7
, pp. 
584
-
589
, doi: .
Nazarovets
,
S.A.
(
2020
), “
Quantitative analysis of the co-publications of Ukrainian scientists with the Nobel laureates 1994-2018 in science
”,
Science and Innovation
, Vol. 
16
No. 
5
, pp. 
110
-
113
, doi: .
Neikirk
,
K.
,
Vue
,
Z.
,
Vue
,
N.
,
Barongan
,
T.
,
Vang
,
C.
,
Beasley
,
H.K.
and
Hinton
,
A.
, Jr.
(
2024
), “
Disparities in funding for Nobel Prize awards in medicine and physiology across nationalities, races, and gender
”,
Journal of Cellular Physiology
, Vol. 
239
No. 
7
,
e31157
, doi: .
Novosad
,
P.
,
Asher
,
S.
,
Farquharson
,
C.
and
Iljazi
,
E.
(
2024
), “
Access to opportunity in the sciences: evidence from the Nobel laureates
”,
CEPR Discussion Paper No. 19551, CEPR Press, Paris & London
.
Padrini
,
G.
,
Borghi
,
L.
and
Hansson
,
N.
(
2021
), “
Italian nominees for the Nobel Prize in physiology or medicine 1901-1950: scholars, research trends, Hotspots
”,
Medicina Historica
, Vol. 
5
No. 
3
,
e2021028
.
Page
,
E.S.
(
1954
), “
Continuous inspection schemes
”,
Biometrika
, Vol. 
41
Nos
1/2
, pp. 
100
-
115
, doi: .
Rodríguez
,
J.G.
(
2022
), “
Making the most of the world talent for science? The Nobel Prize and Fields Medal experience
”,
Scientometrics
, Vol. 
127
No. 
2
, pp. 
813
-
847
, doi: .
Royal Society
(
2018
), “
Patterns of global scientific collaboration and productivity
”,
Open Science
, Vol. 
5
No. 
11
, 180167, doi: .
Schlagberger
,
E.M.
,
Bornmann
,
L.
and
Bauer
,
J.
(
2016
), “
At what institutions did Nobel laureates do their prize-winning work? An analysis of biographical information on Nobel laureates from 1994 to 2014
”,
Scientometrics
, Vol. 
109
No. 
2
, pp. 
723
-
767
, doi: .
Stephan
,
P.
(Ed.) (
2012
),
How Economics Shapes Science
,
Harvard University Press
, ISSN:
[PubMed]
.
Tol
,
R.S.J.
(
2022
), “
Rise of the Kniesians: the professor-student network of Nobel laureates in economics
”,
The European Journal of the History of Economic Thought
, Vol. 
29
No. 
4
, pp. 
680
-
703
, doi: .
Tong
,
S.
and
Ahlgren
,
P.
(
2017
), “
Evolution of three Nobel Prize themes and a Nobel snub theme in chemistry: a bibliometric study with focus on international collaboration
”,
Scientometrics
, Vol. 
112
No. 
1
, pp. 
75
-
90
, doi: .
Tukey
,
J.W.
(
1977
),
Exploratory Data Analysis
,
Addison-Wesley
,
Reading, MA
.
Veugelers
,
R.
,
Cincera
,
M.
,
Frietsch
,
R.
,
Rammer
,
C.
,
Schubert
,
T.
,
Pelle
,
A.
,
Renda
,
A.
,
Montalvo
,
C.
and
Leijten
,
J.
(
2015
), “
The impact of horizon 2020 on innovation in Europe
”,
Intereconomics
, Vol. 
50
No. 
1
, pp. 
4
-
30
, doi: .
Veugelers
,
R.
,
Van Pottelsberghe
,
B.
and
Véron
,
N.
(
2020
), “
EU research policy at a crossroads: addressing the innovation gap
”,
Bruegel Policy Contribution
.
von Zedtwitz
,
M.
,
Gutmann
,
T.
and
Engelmann
,
P.
(
2025
), “
The Nobel ‘Pride’ Phenomenon: an analysis of Nobel Prize discoveries and their recognition
”,
Research Policy
, Vol. 
54
No. 
1
, 105150, doi: .
Zhang
,
L.
and
Zhang
,
Q.
(
2023
), “
Mapping the scientific and technological landscape: an analysis of Nobel Prize-producing institutions
”,
Scientometrics
, Vol. 
128
No. 
11
, pp. 
6129
-
6145
, doi: .
Zhang
,
H.H.
,
Zuccala
,
A.A.
and
Ye
,
F.Y.
(
2019
), “
Tracing the ‘swan groups’ of physics and economics in the key publications of Nobel laureates
”,
Scientometrics
, Vol. 
119
No. 
1
, pp. 
425
-
436
, doi: .
Zhou
,
Z.
,
Xing
,
R.
,
Liu
,
J.
and
Xing
,
F.
(
2014
), “
Landmark papers written by the Nobelists in physics from 1901 to 2012: a bibliometric analysis of their citations and journals
”,
Scientometrics
, Vol. 
100
No. 
2
, pp. 
329
-
338
, doi: .
Agresti
,
A.
(Ed.) (
2007
),
An Introduction to Categorical Data Analysis
,
Wiley Series in Probability and Statistics, John Wiley & Sons, Online
ISBN:
[PubMed]
, doi: .
Chen
,
L.
,
Sun
,
Y.
and
Cao
,
C.
(
2023
), “
A two-fold evaluation in science: the case of Nobel Prize
”,
Scientometrics
, Vol. 
128
No. 
11
, pp. 
6267
-
6291
, doi: .
Furman
,
J.L.
,
Porter
,
M.E.
and
Stern
,
S.
(
2004
), “
The determinants of national innovative capacity
”,
Research Policy
, Vol. 
31
Nos
6-7
, pp. 
899
-
933
, doi: .
Ham
,
J.C.
and
Weinberg
,
B.A.
(
2017
), “
Novelty, knowledge spillovers and innovation: evidence from Nobel laureates
”,
GLO Discussion Paper, No. 30, Global Labor Organization (GLO), Maastricht
Han
,
F.
,
Zhang
,
R.
,
Zhang
,
S.
and
Yuan
,
J.
(
2023
), “
International mobility characteristics, effects of, and effects on elite scientists
”,
Journal of Informetrics
, Vol. 
17
No. 
2
, 101485, doi: .
Idé
,
T.
and
Inoue
,
K.
(
2004
), “
Knowledge discovery from heterogeneous dynamic systems using change-point correlations
”,
Proceedings of 2005 SIAM International Conference on Data Mining (SDM 05)
.
McHugh
,
M.L.
(
2013
), “
The chi-square test of Independence
”,
Biochemia Medica
, Vol. 
23
No. 
2
, pp. 
143
-
149
, doi: .
Published by Emerald Publishing Limited. This article is published under the Creative Commons Attribution (CC BY 4.0) licence. Anyone may reproduce, distribute, translate and create derivative works of this article (for both commercial and non-commercial purposes), subject to full attribution to the original publication and authors. The full terms of this licence may be seen at Link to the terms of the CC BY 4.0 licence.

Supplementary data

Data & Figures

Figure 1
A diagram of factors influencing Nobel Prize.A diagram of factors influencing Nobel recognition. The diagram is structured in concentric circles, each representing different factors. The outermost circle is labeled Noble recognition. Moving inward, the next circle is labeled Proximal institutions. Further inside, the circle is labeled Collaboration networks & mobility. The innermost circle is labeled Policy environment. Arrows indicate the direction of influence from the policy environment to noble recognition, suggesting a flow of impact from the innermost to the outermost circle.

Conceptual illustration of factors influencing Nobel Prize

Figure 1
A diagram of factors influencing Nobel Prize.A diagram of factors influencing Nobel recognition. The diagram is structured in concentric circles, each representing different factors. The outermost circle is labeled Noble recognition. Moving inward, the next circle is labeled Proximal institutions. Further inside, the circle is labeled Collaboration networks & mobility. The innermost circle is labeled Policy environment. Arrows indicate the direction of influence from the policy environment to noble recognition, suggesting a flow of impact from the innermost to the outermost circle.

Conceptual illustration of factors influencing Nobel Prize

Close modal
Figure 2
A flowchart illustrating a research methodology process.The flowchart begins with a systematic literature review, which sources data from SCOPUS, Wikipedia, Wikidata, and the Nobel Prize API. This leads to data analysis, which involves statistical tests such as the Chi-squared test for independence and Fisher's exact test for small sample sizes. Trend analysis is performed using changepoint detection with a two-tailed CUSUM algorithm. The results feed into a Bayesian framework for policy impact assessment, culminating in conclusions and policy implications.

Methodology visualization

Figure 2
A flowchart illustrating a research methodology process.The flowchart begins with a systematic literature review, which sources data from SCOPUS, Wikipedia, Wikidata, and the Nobel Prize API. This leads to data analysis, which involves statistical tests such as the Chi-squared test for independence and Fisher's exact test for small sample sizes. Trend analysis is performed using changepoint detection with a two-tailed CUSUM algorithm. The results feed into a Bayesian framework for policy impact assessment, culminating in conclusions and policy implications.

Methodology visualization

Close modal
Figure 3
Two graphs depict Nobel Prizes by category and their yearly distribution over time.The image contains two graphs: a horizontal bar graph on the left and a vertical bar graph on the right. The horizontal bar graph on the left shows the count of Nobel Prizes awarded in different categories. The categories listed are Physiology or Medicine, Physics, Chemistry, Peace, Literature, and Economic Sciences. The horizontal axis represents the count of prizes, ranging from 0 to 200. Physiology or Medicine and Physics have the highest counts, followed by Chemistry, Peace, Literature, and Economic Sciences. The vertical bar graph on the right displays the yearly distribution of Nobel Prizes from 1900 to 2020. The horizontal axis represents the year, ranging from 1900 to 2020, and the vertical axis represents the number of prizes, ranging from 0 to 60. The graph shows fluctuations in the number of prizes awarded each year, with notable peaks around the 1950s, 1980s, and 2020. The trends indicate an overall increase in the number of prizes awarded over time.

Nobel Prizes by category (left) and the yearly distribution over time (right)

Figure 3
Two graphs depict Nobel Prizes by category and their yearly distribution over time.The image contains two graphs: a horizontal bar graph on the left and a vertical bar graph on the right. The horizontal bar graph on the left shows the count of Nobel Prizes awarded in different categories. The categories listed are Physiology or Medicine, Physics, Chemistry, Peace, Literature, and Economic Sciences. The horizontal axis represents the count of prizes, ranging from 0 to 200. Physiology or Medicine and Physics have the highest counts, followed by Chemistry, Peace, Literature, and Economic Sciences. The vertical bar graph on the right displays the yearly distribution of Nobel Prizes from 1900 to 2020. The horizontal axis represents the year, ranging from 1900 to 2020, and the vertical axis represents the number of prizes, ranging from 0 to 60. The graph shows fluctuations in the number of prizes awarded each year, with notable peaks around the 1950s, 1980s, and 2020. The trends indicate an overall increase in the number of prizes awarded over time.

Nobel Prizes by category (left) and the yearly distribution over time (right)

Close modal
Figure 4
A heat map showing the geographic distribution of Nobel laureate affiliations by country and prize category.A heat map displays the geographic distribution of Nobel laureate affiliations by country and prize category. The map uses a color gradient from light yellow to dark red to indicate the number of laureates, with darker colors representing higher numbers. The countries listed include the USA, United Kingdom, Germany, France, Sweden, Japan, Canada, Switzerland, the Netherlands, Italy, Russia, Austria, Russian Empire, Austria-Hungary, Norway, Denmark, Prussia, China, Scotland, and Australia. The prize categories are Chemistry, Economic Sciences, Literature, Peace, Physics, and Physiology or Medicine. The USA has the highest number of laureates across all categories, particularly in Chemistry, Physics, and Physiology or Medicine. The United Kingdom, Germany, and France also have significant numbers of laureates, with notable concentrations in specific categories. The color intensity varies, with the USA showing the darkest reds, indicating the highest values.

Geographic distribution of Nobel laureate affiliations 1901 onward (partial)

Figure 4
A heat map showing the geographic distribution of Nobel laureate affiliations by country and prize category.A heat map displays the geographic distribution of Nobel laureate affiliations by country and prize category. The map uses a color gradient from light yellow to dark red to indicate the number of laureates, with darker colors representing higher numbers. The countries listed include the USA, United Kingdom, Germany, France, Sweden, Japan, Canada, Switzerland, the Netherlands, Italy, Russia, Austria, Russian Empire, Austria-Hungary, Norway, Denmark, Prussia, China, Scotland, and Australia. The prize categories are Chemistry, Economic Sciences, Literature, Peace, Physics, and Physiology or Medicine. The USA has the highest number of laureates across all categories, particularly in Chemistry, Physics, and Physiology or Medicine. The United Kingdom, Germany, and France also have significant numbers of laureates, with notable concentrations in specific categories. The color intensity varies, with the USA showing the darkest reds, indicating the highest values.

Geographic distribution of Nobel laureate affiliations 1901 onward (partial)

Close modal
Figure 5
A line graph showing the moving average of Nobel Prize affiliations in Horizon-associated countries from 1901 to 2024.A line graph displays the 5-year moving average of Nobel Prize laureate count affiliated with Horizon-associated countries from 1901 to 2024. The horizontal axis represents the award year, ranging from 1900 to 2020. The vertical axis represents the laureate count, ranging from 0.0 to 4.0. A red line indicates the 5-year moving average, showing fluctuations over the years. A black dashed line marks the start of the Horizon project in 2014. The laureate count varies, with notable peaks around the 1920s, 1960s, and post-2014. The trend shows periods of increase and decrease, with a general upward trend post-2014.

The moving average of Nobel Prize affiliations in Horizon-associated countries (1901–2024). Dotted line represents the start of the Horizon project

Figure 5
A line graph showing the moving average of Nobel Prize affiliations in Horizon-associated countries from 1901 to 2024.A line graph displays the 5-year moving average of Nobel Prize laureate count affiliated with Horizon-associated countries from 1901 to 2024. The horizontal axis represents the award year, ranging from 1900 to 2020. The vertical axis represents the laureate count, ranging from 0.0 to 4.0. A red line indicates the 5-year moving average, showing fluctuations over the years. A black dashed line marks the start of the Horizon project in 2014. The laureate count varies, with notable peaks around the 1920s, 1960s, and post-2014. The trend shows periods of increase and decrease, with a general upward trend post-2014.

The moving average of Nobel Prize affiliations in Horizon-associated countries (1901–2024). Dotted line represents the start of the Horizon project

Close modal
Figure 6
A line graph depicting Laureate Count Deviation over time from 1900 to 2020.A line graph depicting Laureate Count Deviation over time from 1900 to 2020. The x-axis represents the years, ranging from 1900 to 2020. The y-axis represents the Laureate Count Deviation, ranging from -3 to 3. The blue line represents the raw time series data for Horizon 2020 countries. The dashed orange line indicates cumulative positive deviations, while the dashed green line indicates cumulative negative deviations. Red dashed vertical lines mark the changepoints in the data. The graph shows fluctuations in the Laureate Count Deviation over the years, with notable peaks and troughs. The blue line shows significant variability, while the orange and green dashed lines show cumulative deviations. The red dashed lines indicate specific points where changes in the trend occur. All values are approximated.

CS changepoint detection for Nobel Laureate affiliations in Horizon 2020 countries. Blue line represents the raw time series, and the dashed orange and green lines indicate cumulative positive and negative deviations. Red dashed lines mark the changepoints

Figure 6
A line graph depicting Laureate Count Deviation over time from 1900 to 2020.A line graph depicting Laureate Count Deviation over time from 1900 to 2020. The x-axis represents the years, ranging from 1900 to 2020. The y-axis represents the Laureate Count Deviation, ranging from -3 to 3. The blue line represents the raw time series data for Horizon 2020 countries. The dashed orange line indicates cumulative positive deviations, while the dashed green line indicates cumulative negative deviations. Red dashed vertical lines mark the changepoints in the data. The graph shows fluctuations in the Laureate Count Deviation over the years, with notable peaks and troughs. The blue line shows significant variability, while the orange and green dashed lines show cumulative deviations. The red dashed lines indicate specific points where changes in the trend occur. All values are approximated.

CS changepoint detection for Nobel Laureate affiliations in Horizon 2020 countries. Blue line represents the raw time series, and the dashed orange and green lines indicate cumulative positive and negative deviations. Red dashed lines mark the changepoints

Close modal
Figure 7
Two line graphs depict autocorrelation and partial autocorrelation functions.The image contains two line graphs. The first graph, titled Autocorrelation Function (ACF), shows the autocorrelation values on the vertical axis ranging from -1.00 to 1.00 and the lag values on the horizontal axis ranging from 0 to 20. The data points are represented by blue dots connected by orange lines. A shaded area around the horizontal axis indicates the confidence interval. The second graph, titled Partial Autocorrelation Function (PACF), also shows partial autocorrelation values on the vertical axis ranging from -1.00 to 1.00 and the lag values on the horizontal axis ranging from 0 to 20. Similar to the first graph, the data points are represented by blue dots connected by orange lines, with a shaded area indicating the confidence interval. Both graphs illustrate the correlation of the time series with its own previous values, helping to identify the appropriate lag orders for modeling.

ACF and PACF

Figure 7
Two line graphs depict autocorrelation and partial autocorrelation functions.The image contains two line graphs. The first graph, titled Autocorrelation Function (ACF), shows the autocorrelation values on the vertical axis ranging from -1.00 to 1.00 and the lag values on the horizontal axis ranging from 0 to 20. The data points are represented by blue dots connected by orange lines. A shaded area around the horizontal axis indicates the confidence interval. The second graph, titled Partial Autocorrelation Function (PACF), also shows partial autocorrelation values on the vertical axis ranging from -1.00 to 1.00 and the lag values on the horizontal axis ranging from 0 to 20. Similar to the first graph, the data points are represented by blue dots connected by orange lines, with a shaded area indicating the confidence interval. Both graphs illustrate the correlation of the time series with its own previous values, helping to identify the appropriate lag orders for modeling.

ACF and PACF

Close modal
Figure 8
Four graphs depicting standardized residuals, histogram with KDE, normal Q-Q plot, and correlogram of residuals.The image contains four graphs. The first graph, labeled ‘Standardized Residuals,' is a line graph showing the residuals over time from 1900 to 2020. The second graph, labeled ‘Histogram + KDE,' combines a histogram with a kernel density estimate (KDE) plot, showing the distribution of residuals with a normal distribution curve for comparison. The third graph, labeled ‘Normal Q-Q Plot,' is a scatter plot comparing theoretical quantiles to sample quantiles, with points closely following the diagonal line, indicating normality. The fourth graph, labeled ‘Correlogram of Residuals,' is a scatter plot showing the correlation of residuals over different lags, with most points falling within the confidence interval. The graphs collectively analyze the residuals of a statistical model, checking for normality and autocorrelation.

Residual plot

Figure 8
Four graphs depicting standardized residuals, histogram with KDE, normal Q-Q plot, and correlogram of residuals.The image contains four graphs. The first graph, labeled ‘Standardized Residuals,' is a line graph showing the residuals over time from 1900 to 2020. The second graph, labeled ‘Histogram + KDE,' combines a histogram with a kernel density estimate (KDE) plot, showing the distribution of residuals with a normal distribution curve for comparison. The third graph, labeled ‘Normal Q-Q Plot,' is a scatter plot comparing theoretical quantiles to sample quantiles, with points closely following the diagonal line, indicating normality. The fourth graph, labeled ‘Correlogram of Residuals,' is a scatter plot showing the correlation of residuals over different lags, with most points falling within the confidence interval. The graphs collectively analyze the residuals of a statistical model, checking for normality and autocorrelation.

Residual plot

Close modal
Figure 9
A line graph depicting historical data and forecast for MA5 over the years.A line graph showing historical data and forecast for MA5 over the years. The horizontal axis represents the year, ranging from 1900 to 2025. The vertical axis represents MA5 values, ranging from 0.5 to 3.0. The graph includes a blue line representing historical data and a red cross representing the forecast. The historical data shows fluctuations in MA5 values over the years, with notable peaks around the 1940s, 1970s, and 2020s. The forecast indicates a slight increase in MA5 values beyond the year 2020.

Adjusted forecasts for the next step

Figure 9
A line graph depicting historical data and forecast for MA5 over the years.A line graph showing historical data and forecast for MA5 over the years. The horizontal axis represents the year, ranging from 1900 to 2025. The vertical axis represents MA5 values, ranging from 0.5 to 3.0. The graph includes a blue line representing historical data and a red cross representing the forecast. The historical data shows fluctuations in MA5 values over the years, with notable peaks around the 1940s, 1970s, and 2020s. The forecast indicates a slight increase in MA5 values beyond the year 2020.

Adjusted forecasts for the next step

Close modal
Figure 10
A histogram showing the posterior mean distribution of 1,000 samples.A histogram showing the posterior mean distribution of 1,000 samples. The x-axis represents the difference in means between post-1984 and the rest, ranging from approximately -0.7 to 0.0. The y-axis represents the density, ranging from 0.0 to 3.5. The histogram has multiple vertical bars, indicating the frequency of different differences in means. The mean difference is marked with a red dashed line at -0.35. The 2.5 percentage quantile is marked with a blue dashed line at -0.57, and the 97.5 percentage quantile is marked with a blue dashed line at -0.12. The distribution appears to be roughly symmetric with a peak around the mean difference.

Posterior mean distribution (1,000 samples): post-1984–2024 against the rest

Figure 10
A histogram showing the posterior mean distribution of 1,000 samples.A histogram showing the posterior mean distribution of 1,000 samples. The x-axis represents the difference in means between post-1984 and the rest, ranging from approximately -0.7 to 0.0. The y-axis represents the density, ranging from 0.0 to 3.5. The histogram has multiple vertical bars, indicating the frequency of different differences in means. The mean difference is marked with a red dashed line at -0.35. The 2.5 percentage quantile is marked with a blue dashed line at -0.57, and the 97.5 percentage quantile is marked with a blue dashed line at -0.12. The distribution appears to be roughly symmetric with a peak around the mean difference.

Posterior mean distribution (1,000 samples): post-1984–2024 against the rest

Close modal
Figure 11
A histogram showing the distribution of the difference in means between post-20142023 and the rest.A histogram represents the distribution of the difference in means between post-20142023 and the rest. The histogram has 20 vertical bars, each representing a bin of data. The horizontal axis is labeled Difference in Means (Post - Pre) and ranges from approximately -0.3 to 0.4. The vertical axis is labeled Density and ranges from 0.0 to 3.5. The histogram shows a roughly symmetrical distribution centered around a mean difference of 0.04, indicated by a red dashed line. The 2.5 percent quantile is marked at -0.17, and the 97.5 percent quantile is marked at 0.29, both indicated by blue dashed lines. The highest density is observed around the mean difference, with the distribution tapering off towards the extremes. The color of the bars is green.

Posterior mean distribution (1,000 samples): post-2014–2023 against the rest

Figure 11
A histogram showing the distribution of the difference in means between post-20142023 and the rest.A histogram represents the distribution of the difference in means between post-20142023 and the rest. The histogram has 20 vertical bars, each representing a bin of data. The horizontal axis is labeled Difference in Means (Post - Pre) and ranges from approximately -0.3 to 0.4. The vertical axis is labeled Density and ranges from 0.0 to 3.5. The histogram shows a roughly symmetrical distribution centered around a mean difference of 0.04, indicated by a red dashed line. The 2.5 percent quantile is marked at -0.17, and the 97.5 percent quantile is marked at 0.29, both indicated by blue dashed lines. The highest density is observed around the mean difference, with the distribution tapering off towards the extremes. The color of the bars is green.

Posterior mean distribution (1,000 samples): post-2014–2023 against the rest

Close modal
Figure 12
A histogram showing the posterior mean distribution of differences in means post-2014 against the previous decade.A histogram with approximately 20 vertical bars representing the posterior mean distribution of differences in means post-2014 against the previous decade. The x-axis is labeled ‘Difference in Means (Post - Pre)' and ranges from 0.0 to 1.2. The y-axis is labeled ‘Density' and ranges from 0.0 to 3.0. The histogram shows a distribution with a peak around 0.47, indicated by a red dashed line labeled ‘Mean: 0.47'. The 2.5 percentage quantile is marked at 0.15 with a blue dashed line labeled ‘2.5 percentage: 0.15', and the 97.5 percentage quantile is marked at 0.77 with another blue dashed line labeled ‘97.5 percentage: 0.77'. The distribution appears to be slightly skewed to the right. All values are approximated.

Posterior mean distribution (1,000 samples): post-2014 against previous decade

Figure 12
A histogram showing the posterior mean distribution of differences in means post-2014 against the previous decade.A histogram with approximately 20 vertical bars representing the posterior mean distribution of differences in means post-2014 against the previous decade. The x-axis is labeled ‘Difference in Means (Post - Pre)' and ranges from 0.0 to 1.2. The y-axis is labeled ‘Density' and ranges from 0.0 to 3.0. The histogram shows a distribution with a peak around 0.47, indicated by a red dashed line labeled ‘Mean: 0.47'. The 2.5 percentage quantile is marked at 0.15 with a blue dashed line labeled ‘2.5 percentage: 0.15', and the 97.5 percentage quantile is marked at 0.77 with another blue dashed line labeled ‘97.5 percentage: 0.77'. The distribution appears to be slightly skewed to the right. All values are approximated.

Posterior mean distribution (1,000 samples): post-2014 against previous decade

Close modal
Figure 13
A histogram showing the distribution of differences in means between post-20212023 and 20002013.A histogram represents the distribution of differences in means between post-20212023 and 20002013. The horizontal axis is labeled Difference in Means (Post - Pre) and ranges from 0.4 to 1.2. The vertical axis is labeled Density and ranges from 0.0 to 3.5. The histogram has approximately 20 vertical bars, each representing a bin of data. The mean difference is marked with a red dashed line at 0.82. The 2.5 percent quantile is marked with a blue dashed line at 0.57, and the 97.5 percent quantile is marked with a blue dashed line at 1.08. The distribution appears to be roughly symmetric with a peak around the mean difference. The color of the bars is green.

Posterior mean distribution (1,000 samples): post-2021–2023 against 2000–2013

Figure 13
A histogram showing the distribution of differences in means between post-20212023 and 20002013.A histogram represents the distribution of differences in means between post-20212023 and 20002013. The horizontal axis is labeled Difference in Means (Post - Pre) and ranges from 0.4 to 1.2. The vertical axis is labeled Density and ranges from 0.0 to 3.5. The histogram has approximately 20 vertical bars, each representing a bin of data. The mean difference is marked with a red dashed line at 0.82. The 2.5 percent quantile is marked with a blue dashed line at 0.57, and the 97.5 percent quantile is marked with a blue dashed line at 1.08. The distribution appears to be roughly symmetric with a peak around the mean difference. The color of the bars is green.

Posterior mean distribution (1,000 samples): post-2021–2023 against 2000–2013

Close modal
Table 1

Summary of datasets used in the analysis

SourceSizeKey variablesDescriptionSource
Nobel Prize Database963Given Name, familyName- birth_date, birth_country, birth_city- affiliation, residence- prize_category, prize_amount, date_awarded- motivation, latitude/longitude, biography linksStructured data from the Nobel Prize API containing laureate information, affiliations, prizes and geographic detailsLink to the website
20,126Nominee, Nominator – Prize category, Year – Nominator profession, university, genderData on Nobel Prize nominations, including nominators and nominees, available up to 1970 (1950 for Medicine)Link to the website
Wikipedia and Wikidata787Education (institution, degree type) – Occupation, Employer – Affiliations, Doctoral advisors, AwardsSemi-structured data on education, doctoral training and affiliations. Coverage is partial and based on successfully linked profilesLink to the website
Connections between Nobel laureates based on linked Wikipedia pages – edge weights for co-occurrence frequencyDerived from Wikipedia, representing networks of collaboration or influence among laureatesLink to the website

Supplements

Supplementary data

References

Ali
,
W.
(
2026
), “
Can the 2025 Nobel prizes in physics and economics inspire a ‘quantum’ turn in tourism research?
”,
Annals of Tourism Research
, Vol. 
117
, 104115, doi: .
Basseville
,
M.
and
Nikiforov
,
I.V.
(
1993
),
Detection of Abrupt Changes: Theory and Application
,
Prentice-Hall
,
Hoboken
,
[PubMed]
.
Bjork
,
S.
,
Offer
,
A.
and
Söderberg
,
G.
(
2014
), “
Time series citation data: the Nobel Prize in economics
”,
Scientometrics
, Vol. 
98
No. 
1
, pp. 
185
-
196
, doi: .
Chan
,
H.F.
and
Torgler
,
B.
(
2015
), “
The implications of educational and methodological background for the career success of Nobel laureates: an investigation of major awards
”,
Scientometrics
, Vol. 
102
No. 
1
, pp. 
847
-
863
, doi: .
Chan
,
H.F.
,
Önder
,
A.S.
and
Torgler
,
B.
(
2015
), “
Do Nobel laureates change their patterns of collaboration following prize reception?
”,
Scientometrics
, Vol. 
105
No. 
3
, pp. 
2215
-
2235
, doi: .
Chariker
,
J.H.
,
Zhang
,
Y.
,
Pani
,
J.R.
and
Rouchka
,
E.C.
(
2017
), “
Identification of successful mentoring communities using network-based analysis of mentor–mentee relationships across Nobel laureates
”,
Scientometrics
, Vol. 
111
No. 
3
, pp. 
1733
-
1749
, doi: .
Erkol
,
Ş.
,
Sikdar
,
S.
,
Radicchi
,
F.
and
Fortunato
,
S.
(
2023
), “
Consistency pays off in science
”,
Quantitative science studies
, Vol. 
4
No. 
2
, pp. 
491
-
500
, doi: .
Eubanks
,
D.L.
,
Palanski
,
M.E.
,
Swart
,
J.
,
Hammond
,
M.M.
and
Oguntebi
,
J.
(
2016
), “
Creativity in early and established career: insights into multi-level drivers from Nobel Prize winners
”,
Journal of Creative Behavior
, Vol. 
50
No. 
4
, pp. 
229
-
251
, doi: .
Freeman
,
R.B.
,
Xie
,
D.
,
Zhang
,
H.
and
Zhou
,
H.
(
2024
), “High and rising institutional concentration of award-winning economists”, in
NBER Summer Institute - the Science of Science Funding
.
Gingras
,
Y.
and
Wallace
,
M.L.
(
2010
), “
Why it has become more difficult to predict Nobel Prize winners: a bibliometric analysis of nominees and winners of the chemistry and physics prizes (1901-2007)
”, Vol. 
82
No. 
2
, pp. 
401
-
412
, doi: .
Han
,
F.
,
Zhang
,
R.
,
Zhang
,
S.
and
Yuan
,
J.
(
2024
), “
International mobility characteristics, effects of, and effects on elite scientists
”,
Journal of Informetrics
, Vol. 
18
No. 
1
, 101485, doi: .
Heinze
,
T.
and
Fuchs
,
J.E.
(
2022
), “
National and organizational patterns of Nobel laureate careers in physiology/medicine, physics, and chemistry
”,
Scientometrics
, Vol. 
127
No. 
12
, pp. 
7273
-
7288
, doi: .
Hu
,
F.
,
Qiu
,
L.
,
Wei
,
S.
,
Zhou
,
H.
,
Bathuure
,
I.A.
and
Hu
,
H.
(
2024
), “
The spatiotemporal evolution of global innovation networks and the changing position of China: a social network analysis based on cooperative patents
”,
R&D Management
, Vol. 
54
No. 
3
, pp. 
574
-
589
, doi: .
Huang
,
Y.
,
Tian
,
C.
and
Ma
,
Y.
(
2023
), “
Practical operation and theoretical basis of difference-in-difference regression in science of science: the comparative trial on the scientific performance of Nobel laureates versus their coauthors
”,
Journal of Data and Information Science
, Vol. 
8
No. 
1
, pp. 
29
-
46
, doi: .
Jones
,
B.F.
(
2009
), “
The burden of knowledge and the ‘death of the renaissance man’: is innovation getting harder?
”,
The Review of Economic Studies
, Vol. 
76
No. 
1
, pp. 
283
-
317
, doi: .
Kim
,
M.C.
,
Feng
,
Y.
,
Zhu
,
Y.
and
Ping
,
Q.
(
2015
), “
Quantitative exploration into the diffusion process of creative ideas in economics: Nobel prize laureates
”,
Proceedings of the Association for Information Science and Technology
, Vol. 
52
No. 
1
, pp. 
1
-
4
, doi: .
Kissin
,
I.
(
2011
), “
A surname-based bibliometric indicator: publications in biomedical journals
”,
Scientometrics
, Vol. 
89
No. 
1
, pp. 
273
-
280
, doi: .
Krauss
,
A.
(
2024a
), “
How Nobel-prize breakthroughs in economics emerge and the field’s influential empirical methods
”,
Scientometrics
, Vol. 
221
, pp. 
657
-
674
, doi: .
Krauss
,
A.
(
2024b
), “
Science’s greatest discoverers: a shift towards greater interdisciplinarity, top universities and older age
”,
Humanities and Social Sciences Communications
, Vol. 
11
No. 
1
, pp. 
1
-
11
, doi: .
Krauss
,
A.
(
2026
), “
New tools drive scientific discovery: evidence from all nobel-prize and major non-Nobel breakthroughs
”,
Humanities and Social Sciences Communications
, Vol. 
13
No. 
1
, p.
500
, doi: .
Manners
,
I.
and
Murray
,
P.
(
2016
), “
The end of a noble narrative? European integration narratives after the Nobel Peace Prize
”,
Journal of Communication and Media Studies: Journal of Common Market Studies
, Vol. 
54
No. 
1
, pp. 
185
-
202
, doi: .
Ministry of University Research
(
2024
), “
The commission published the results of the ex-post evaluation of horizon 2020 – researchitaly
”,
available at:
 Link to the website
Molina
,
J.A.
,
Iñiguez
,
D.
,
Ruiz
,
G.
and
Tarancón
,
A.
(
2021
), “
Leaders among the leaders in economics: a network analysis of the Nobel Prize laureates
”,
Applied Economics Letters
, Vol. 
28
No. 
7
, pp. 
584
-
589
, doi: .
Nazarovets
,
S.A.
(
2020
), “
Quantitative analysis of the co-publications of Ukrainian scientists with the Nobel laureates 1994-2018 in science
”,
Science and Innovation
, Vol. 
16
No. 
5
, pp. 
110
-
113
, doi: .
Neikirk
,
K.
,
Vue
,
Z.
,
Vue
,
N.
,
Barongan
,
T.
,
Vang
,
C.
,
Beasley
,
H.K.
and
Hinton
,
A.
, Jr.
(
2024
), “
Disparities in funding for Nobel Prize awards in medicine and physiology across nationalities, races, and gender
”,
Journal of Cellular Physiology
, Vol. 
239
No. 
7
,
e31157
, doi: .
Novosad
,
P.
,
Asher
,
S.
,
Farquharson
,
C.
and
Iljazi
,
E.
(
2024
), “
Access to opportunity in the sciences: evidence from the Nobel laureates
”,
CEPR Discussion Paper No. 19551, CEPR Press, Paris & London
.
Padrini
,
G.
,
Borghi
,
L.
and
Hansson
,
N.
(
2021
), “
Italian nominees for the Nobel Prize in physiology or medicine 1901-1950: scholars, research trends, Hotspots
”,
Medicina Historica
, Vol. 
5
No. 
3
,
e2021028
.
Page
,
E.S.
(
1954
), “
Continuous inspection schemes
”,
Biometrika
, Vol. 
41
Nos
1/2
, pp. 
100
-
115
, doi: .
Rodríguez
,
J.G.
(
2022
), “
Making the most of the world talent for science? The Nobel Prize and Fields Medal experience
”,
Scientometrics
, Vol. 
127
No. 
2
, pp. 
813
-
847
, doi: .
Royal Society
(
2018
), “
Patterns of global scientific collaboration and productivity
”,
Open Science
, Vol. 
5
No. 
11
, 180167, doi: .
Schlagberger
,
E.M.
,
Bornmann
,
L.
and
Bauer
,
J.
(
2016
), “
At what institutions did Nobel laureates do their prize-winning work? An analysis of biographical information on Nobel laureates from 1994 to 2014
”,
Scientometrics
, Vol. 
109
No. 
2
, pp. 
723
-
767
, doi: .
Stephan
,
P.
(Ed.) (
2012
),
How Economics Shapes Science
,
Harvard University Press
, ISSN:
[PubMed]
.
Tol
,
R.S.J.
(
2022
), “
Rise of the Kniesians: the professor-student network of Nobel laureates in economics
”,
The European Journal of the History of Economic Thought
, Vol. 
29
No. 
4
, pp. 
680
-
703
, doi: .
Tong
,
S.
and
Ahlgren
,
P.
(
2017
), “
Evolution of three Nobel Prize themes and a Nobel snub theme in chemistry: a bibliometric study with focus on international collaboration
”,
Scientometrics
, Vol. 
112
No. 
1
, pp. 
75
-
90
, doi: .
Tukey
,
J.W.
(
1977
),
Exploratory Data Analysis
,
Addison-Wesley
,
Reading, MA
.
Veugelers
,
R.
,
Cincera
,
M.
,
Frietsch
,
R.
,
Rammer
,
C.
,
Schubert
,
T.
,
Pelle
,
A.
,
Renda
,
A.
,
Montalvo
,
C.
and
Leijten
,
J.
(
2015
), “
The impact of horizon 2020 on innovation in Europe
”,
Intereconomics
, Vol. 
50
No. 
1
, pp. 
4
-
30
, doi: .
Veugelers
,
R.
,
Van Pottelsberghe
,
B.
and
Véron
,
N.
(
2020
), “
EU research policy at a crossroads: addressing the innovation gap
”,
Bruegel Policy Contribution
.
von Zedtwitz
,
M.
,
Gutmann
,
T.
and
Engelmann
,
P.
(
2025
), “
The Nobel ‘Pride’ Phenomenon: an analysis of Nobel Prize discoveries and their recognition
”,
Research Policy
, Vol. 
54
No. 
1
, 105150, doi: .
Zhang
,
L.
and
Zhang
,
Q.
(
2023
), “
Mapping the scientific and technological landscape: an analysis of Nobel Prize-producing institutions
”,
Scientometrics
, Vol. 
128
No. 
11
, pp. 
6129
-
6145
, doi: .
Zhang
,
H.H.
,
Zuccala
,
A.A.
and
Ye
,
F.Y.
(
2019
), “
Tracing the ‘swan groups’ of physics and economics in the key publications of Nobel laureates
”,
Scientometrics
, Vol. 
119
No. 
1
, pp. 
425
-
436
, doi: .
Zhou
,
Z.
,
Xing
,
R.
,
Liu
,
J.
and
Xing
,
F.
(
2014
), “
Landmark papers written by the Nobelists in physics from 1901 to 2012: a bibliometric analysis of their citations and journals
”,
Scientometrics
, Vol. 
100
No. 
2
, pp. 
329
-
338
, doi: .
Agresti
,
A.
(Ed.) (
2007
),
An Introduction to Categorical Data Analysis
,
Wiley Series in Probability and Statistics, John Wiley & Sons, Online
ISBN:
[PubMed]
, doi: .
Chen
,
L.
,
Sun
,
Y.
and
Cao
,
C.
(
2023
), “
A two-fold evaluation in science: the case of Nobel Prize
”,
Scientometrics
, Vol. 
128
No. 
11
, pp. 
6267
-
6291
, doi: .
Furman
,
J.L.
,
Porter
,
M.E.
and
Stern
,
S.
(
2004
), “
The determinants of national innovative capacity
”,
Research Policy
, Vol. 
31
Nos
6-7
, pp. 
899
-
933
, doi: .
Ham
,
J.C.
and
Weinberg
,
B.A.
(
2017
), “
Novelty, knowledge spillovers and innovation: evidence from Nobel laureates
”,
GLO Discussion Paper, No. 30, Global Labor Organization (GLO), Maastricht
Han
,
F.
,
Zhang
,
R.
,
Zhang
,
S.
and
Yuan
,
J.
(
2023
), “
International mobility characteristics, effects of, and effects on elite scientists
”,
Journal of Informetrics
, Vol. 
17
No. 
2
, 101485, doi: .
Idé
,
T.
and
Inoue
,
K.
(
2004
), “
Knowledge discovery from heterogeneous dynamic systems using change-point correlations
”,
Proceedings of 2005 SIAM International Conference on Data Mining (SDM 05)
.
McHugh
,
M.L.
(
2013
), “
The chi-square test of Independence
”,
Biochemia Medica
, Vol. 
23
No. 
2
, pp. 
143
-
149
, doi: .

Languages

or Create an Account

Close Modal
Close Modal