

With the transition to greater use of renewable energy resources and the growing demand for electricity, countries such as the UK are seeing considerable investment, expansion and upgrading of their energy transmission infrastructure. Overhead line equipment structures in the UK typically have pad and column or pyramidal foundations, with the critical loading case being tensile uplift. The design of new foundations and reassessment of existing structures often relies on simplistic and conservative design approaches where efficient design is key to minimising material use and carbon dioxide footprint. Both centrifuge testing and three-dimensional finite-element analysis were used to investigate and verify more efficient uplift design procedures. In addition, a centrifuge modelling technique was used to investigate a more realistic construction procedure that incorporated soil backfilling as an improvement over wished-in-place simulation. This work has shown that current frustrum based methods are conservative and may lead to unnecessary upgrading of existing structures. Other empirically based approaches generally overpredict capacity by a significant amount and may be unsafe. Investigations of recently adopted design approaches where failure mechanisms were linked to the soil’s dilation angle yielded much better performance.
Notation
- A
foundation base area
- B
foundation width/breadth
- c
cohesion intercept
- D10
effective particle size
- D50
average particle size
- Dr
relative density
- E50
secant triaxial stiffness
- Eoed
oedometer loading stiffness
- Eur
triaxial unloading stiffness
- F2
shear resistance
- F3
shear resistance
- G0
maximal small-strain shear modulus
- H
depth to failure surface origin
- K0
at-rest earth pressure
- m
stiffness exponent for minor stress formulation
- N
centrifuge scaling factor
- Nγ
breakout factor
- p
base perimeter
- Qu
total uplift capacity
- Rf
failure ratio
- W1
soil weight from a cuboid directly above the base
- W2
soil weight from a triangular prism from the base perimeter
- W3
soil weight from frustum corners modelled as a cone
- δ
interface friction angle with cast concrete
- γ
soil unit weight
- γ0.7
value of small strain for which Gs/G0 reduces to 0.722
- ρmax
maximum dry density
- ρmin
minimum dry density
critical state friction angle
peak internal friction angle
- ψ
dilation angle
1. Introduction
In the UK there is currently significant effort being made to upgrade the electrical transmission infrastructure to meet the ever-increasing demand for electricity and to allow transmission from new remote areas of renewable energy generation such as onshore and offshore wind farm projects. It is currently estimated that there are 90 000 overhead line equipment (OLE) towers in the UK, and this is predicted to double. It has been estimated that a spend of £58 billion is required between 2030 and 2035, which comes on top of current investment of £54 billion to 2030 (BBC, 2024). Not only are new towers required but existing towers may need upgrading to carry increased line loads associated with installing larger or increased conductors on existing structures. These targets, and upgrading, will require the construction of many new foundations, typically cast in situ reinforced concrete in a pad and column or chimney format (Figure 1(a)). They will also require the reassessment, and potential upgrading, of existing foundations that have historically consisted of cast in situ mass concrete in a pyramidal shape (Figure 1(b)).
 The image contains two technical diagrams (a) and (b), both presenting geometric arrangements with measurements. Diagram (a) shows a rectangular shape with a vertical column positioned centrally on a square base, with dimensions noted as a height of one point five, three, and four point five metres, and a base width of three metres. The diagram includes an annotation indicating a height-to-base width ratio. Diagram (b) features a conical shape with a vertical column at its centre, resting on a rectangular base, with a noted height of two, three, three point five one four, four point five, five point zero one four, and six metres, along with a base width of three metres and a specified angle of fifty degrees. Both diagrams contain annotations detailing height-to-base width ratios, presented as a series of values, and are drawn in a clear, technical style.
Example of (a) pad and column and (b) pyramid type OLE foundations used in the UK. The column sections are shown as vertical for modelling purposes but in the field they are inclined
The image contains two technical diagrams (a) and (b), both presenting geometric arrangements with measurements. Diagram (a) shows a rectangular shape with a vertical column positioned centrally on a square base, with dimensions noted as a height of one point five, three, and four point five metres, and a base width of three metres. The diagram includes an annotation indicating a height-to-base width ratio. Diagram (b) features a conical shape with a vertical column at its centre, resting on a rectangular base, with a noted height of two, three, three point five one four, four point five, five point zero one four, and six metres, along with a base width of three metres and a specified angle of fifty degrees. Both diagrams contain annotations detailing height-to-base width ratios, presented as a series of values, and are drawn in a clear, technical style.Example of (a) pad and column and (b) pyramid type OLE foundations used in the UK. The column sections are shown as vertical for modelling purposes but in the field they are inclined
This research was initially triggered by the need to reassess existing foundations in uplift or tensile loading as this was found to be the critical load path (BSI, 2013a), whereas foundations were often heavily overdesigned in bearing for compressive loads and would easily deal with additional upgrade loads. Concerns were raised regarding the inability of current UK design approaches to properly capture uplift behaviour, which could result in unnecessary upgrades and significant costs. These concerns were raised based upon known comments on the existing UK design approaches that model uplift in granular soils being resisted by a frustrum of soil (also referred to as a soil cone method) that propagates from the foundation to the soil surface at an angle defined based upon charts or standard penetration test (SPT) results (Table 1). The resistance from the soil is then just calculated based upon the soil mass contained within the frustrum and any interaction between the frustrum and surrounding soil is ignored (e.g. NG, 2018). Such concerns about use of this approach are also highlighted in NG TS 3.4.15 (NG, 2018):
| Parameter | SPT counts for non-cohesive materials, n | ||||
|---|---|---|---|---|---|
| n < 10 | 10 < n < 20 | n > 20 | |||
| Dry | Saturated | Dry | Saturated | ||
| Unit weight: kN/m3 | N/A | 15–17.5 | 17.5–20 | 16–20 | 18.5–22.5 |
| Frustum angle: degrees | N/A | 15 | 15 | 25 | 25 |
The frustum method does not attempt to represent the actual failure mechanism in the soil. The actual failure mechanism is complex and is likely to follow the vertical construction interface between backfill and surrounding soil and will include friction effects along this interface.
Tracing the origins of existing UK methods appears to suggest similar approaches being proposed over 100 years ago by Mitchell (1915) and Pannell (1926), with reference to the uplift resistance being generated by the weight of the soil in a frustum at fixed angle of 30° and a unit weight of 15.7 kN/m3 (100 lb/ft3). A fixed 30° frustum angle was also supported by Downs and Chieurzzi (1966). This empirical approach is termed the soil cone method and was referred to by Mors (1964) as being the most commonly used design method at the time of their publication. Even in the 1960s there were critics of the approach, with Balla (1961) calling the estimation of the frustum angle ‘conjecture’, while Kulhawy (1985) referred to the soil cone method as an ad hoc procedure that makes an attempt to include the shear resistance of the soil by substitution of an equivalent weight of soil. Kulhawy (1985) noted that the frustum angle is dependent on the soil properties and foundation geometry and that there is no rational way to determine the correct angle for all permutations by fixed angle approaches.
It might be anticipated that current Eurocodes (e.g. BSI, 2013b) would offer some guidance on how to approach similar foundation uplift problems, but this appears to be missing from the current version. Guidance on general requirements of OLE is available in BS EN 50341-1:2012 (BSI, 2013a), where there is a similar frustrum type approach (M3) and a vertical slip only method that does take into account shearing at the excavation sides or on the failure surface (M2). The M2 method is also the only approach proposed for concrete stepped block footings (not a foundation type commonly deployed in the UK) but the reason for this limitation is unclear. Method M3 has a similar set of parameters to Table 1 but with frustum angles defined based upon both foundation type and broad description of soil types rather than, say, in situ testing (e.g. SPT). It is noted that method M3 also suggests very large frustum angles for pyramidal foundations in sand (38–53°), which significantly exceed the maximum in current UK practice of 25° (Table 1).
Although current practice for OLE foundation uplift design in the UK appears to still favour the frustrum approach, there have been many proposed empirical design methods for plates or circular anchors for shallow burial in sand (Meyerhof and Adams, 1968; Murray and Geddes, 1987; Ovesen, 1981; Vermeer and Sutjiadi, 1985). In fact, it is an area that receives relatively frequent new investigations with new developments appearing on a regular basis. More recently, developments in offshore pipeline uplift capacity calculation have seen the empiricism reduced with behaviour related to measurable in situ soil parameters and observable soil mechanistic behaviour (White et al., 2001; 2008). These improvements were translated to shallow foundation uplift (Giampa et al., 2017; 2019) (Equations 1–7, with the corresponding resistance elements shown in Figure 2) and appear to show very good performance when compared with centrifuge testing and have been shown to work well in other applications such as screw pile or anchor uplift capacity (Cerfontaine et al., 2023).
 The image depicts a three-dimensional diagram of a shape resembling a frustum with a square cutout at the top centre. The diagram includes several labeled forces: W subscript one, W subscript two, and W subscript three are illustrated as arrows pointing from the top surface towards the interior, indicating dimensions or weight, while F subscript two and F subscript three point outwards from the sides, suggesting additional forces acting on the shape. The geometric features are represented with dashed lines and a dotted shading effect to indicate different surfaces. Notable visual cues are used to clarify the arrangement and interactions of the forces on the structure.
Schematic diagram of the corresponding soil elements referred to in Equations 1 to Equations 7 (after Giampa et al. (2019))
The image depicts a three-dimensional diagram of a shape resembling a frustum with a square cutout at the top centre. The diagram includes several labeled forces: W subscript one, W subscript two, and W subscript three are illustrated as arrows pointing from the top surface towards the interior, indicating dimensions or weight, while F subscript two and F subscript three point outwards from the sides, suggesting additional forces acting on the shape. The geometric features are represented with dashed lines and a dotted shading effect to indicate different surfaces. Notable visual cues are used to clarify the arrangement and interactions of the forces on the structure.Schematic diagram of the corresponding soil elements referred to in Equations 1 to Equations 7 (after Giampa et al. (2019))
In Equations 1–7, Qu is the total uplift capacity, F2 is the shear resistance and W2 is the soil weight from a triangular prism from the base perimeter, F3 is the shear resistance and W3 is the soil weight from the frustum corners modelled as a cone, W1 is the soil weight from a cuboid directly above the foundation base, γ is the soil unit weight, H is the depth to the failure surface origin, A is the base area, p is the base perimeter, ψ is the dilation angle, is the peak internal friction angle, K0 is the at-rest earth pressure and is the critical state friction angle.
Although apparent good performance of this method has previously been demonstrated, it has not been applied to OLE foundations of different geometries (e.g. pad or pyramid). Also, the foundation industry may be risk-adverse and reluctant to adopt new methods unless these are rigorously shown to give appropriate performance predictions.
With this background, an attempt was made to investigate the most appropriate design approach for OLE foundation design in granular materials through the use of three-dimensional (3D) finite-element analysis (FEA) with verification using scaled centrifuge model tests of pyramidal foundations (Figure 1(b), truncated concrete pyramid surmounted by a chimney or column) and pad and column foundations (Figure 1(a)). The effects of incorporating more realistic construction sequences into design approaches were also investigated. This was with a view to convincing UK practice to adopt a more realistic design methodology that reflects real observed soil mechanistic behaviour and also has the potential to directly reduce the impact of construction processes in the face of major planned construction.
2. Methodology
2.1 FEA methodology
Initially, a series of finite-element studies were performed. Such numerical modelling allows for rapid parametric studies to determine the influence of several variables. In this case, the variables considered were the foundation depth and the type and properties of the sand. Table 2 summarises the simulations conducted on both pad and pyramid style foundations.
Summary of numerical simulations
| Base depth: m | Embedment ratio, H/Ba | Relative density, Dr: % |
|---|---|---|
| Pad and column foundation | ||
| 2.014 | 0.50 | 30 |
| 3.514 | 1.00 | 30 |
| 5.014 | 1.50 | 30 |
| 2.014 | 0.50 | 60 |
| 3.514 | 1.00 | 60 |
| 5.014 | 1.50 | 60 |
| 2.014 | 0.50 | 90 |
| 3.514 | 1.00 | 90 |
| 5.014 | 1.50 | 90 |
| Pyramid foundation | ||
| 2.014 | 0.67 | 30 |
| 3.514 | 1.17 | 30 |
| 5.014 | 1.67 | 30 |
| 6.514 | 2.17 | 30 |
| 2.014 | 0.67 | 60 |
| 3.514 | 1.17 | 60 |
| 5.014 | 1.67 | 60 |
| 6.514 | 2.17 | 60 |
| 2.014 | 0.67 | 90 |
| 3.514 | 1.17 | 90 |
| 5.014 | 1.67 | 90 |
| 6.514 | 2.17 | 90 |
aEmbedment ratio calculated from top of pad and base of pyramid
The geometry of the pyramidal or pad part of the foundation was constant for all models (width B = 3 m, as per Figure 1) while the length of the column was changed to alter the embedment depth. Details of the foundation geometries are presented in Figure 1. These reflect typical current geometries adopted in the UK for pad and column foundation (Figure 1(a)) and historically for pyramid foundations (Figure 1(b)) (based upon information supplied by SSEN Transmission & National Grid Electricity Transmission). See Figure 1 for definitions of the foundation embedment (H/B).
From the literature it is apparent that many previous investigations have focused on plane strain analysis, with few studies of the foundations or anchors in full volume (i.e. 3D). As the pylon foundations are square in plan, 3D analysis is the most appropriate. It is possible to take advantage of the vertical symmetry of the square foundation and simplify the model to one quarter of the foundation and soil (Merifield and Sloan, 2006) to reduce the computational cost. Plaxis 3D (versions 2017.01 and 2023.2.1.1079) was used for 3D FEA. This software uses constitutive models to define the behaviour of the finite-element mesh that represents the soil.
For the analyses, the hardening soil with small strain (HS small) constitutive model (Bentley Systems, 2017) was selected and populated with parameters for HST95 sand (Table 3), which is routinely used for physical modelling at the University of Dundee and has been extensively characterised in several studies (Al-Defae, 2013; Al-Defae et al., 2013; Bertalot, 2013; Bertalot et al., 2013; Lauder, 2010; Lauder et al., 2013). The HS small model uses effective stress parameters to define the limiting stress of the soil by using the peak friction angle, dilation angle and cohesion as per Mohr–Coulomb models. However, the stiffness of this advanced constitutive model is based upon three distinct stiffness parameters – triaxial stiffness (E50), triaxial unloading stiffness (Eur) and oedometer loading stiffness (Eoed) – at a reference stress of 100 kPa. The stiffness at small strain is also included in the HS small model to provide improved accuracy in modelling the non-linear elastic strain.
HST95 sand properties used in FEA (Al-Defae, 2013; Al-Defae et al., 2013)
| Property | Relative density, Dr: % | ||
|---|---|---|---|
| 30 | 60 | 90 | |
| Dry unit weight, γ: kN/m3 | 15.4 | 16.3 | 17.2 |
| Peak friction angle, ϕpk: degrees | 35 | 41 | 47 |
| Dilation angle, ψ: degrees | 3.4 | 11.2 | 19 |
| Critical state friction angle, ϕcs: degrees | 32 | 32 | 32 |
| Interface friction angle with cast concrete, δ: degrees (⅔ϕcs (BSI, 2013b)) | 21.3 | 21.3 | 21.3 |
| Secant modulus, E50: kN/m2 | 34 650 | 44 025 | 53 400 |
| Tangent oedometric modulus, Eoed: kN/m2 | 27 720 | 35 220 | 42 720 |
| Unloading-reloading stiffness, Eur: kN/m2 | 83 100 | 105 600 | 128 100 |
| Stiffness exponent for minor stress formulation, m | 0.57 | 0.54 | 0.51 |
| Maximal small-strain shear modulus, G0: kN/m2 | 103 800 | 118 800 | 133 800 |
| Value of small strain for which Gs/G0 reduces to 0.722, γ0.7: kN/m2 | 0.0001180 | 0.0001690 | 0.0002200 |
| Failure ratio, Rf | 0.9 | 0.9 | 0.9 |
| Cohesion intercept, c: kN/m2 | 0.2 | 0.2 | 0.2 |
| At-rest earth pressure coefficient, K0 | 0.426 | 0.344 | 0.269 |
Analysis of the foundation in uniform sand was completed for relative densities of 30%, 60% and 90% to model the foundations in a full range of densities at depths (H) to the base of the foundation of 2, 3, 4.5 and 6 m (H/B = 0.67, 1.17, 1.67 and 2.17 at the pyramid base, where B is the width of the foundation) for the pyramid, and ∼2, 3 and 5 m to the base of the pad (H/B = 0.5, 1, 1.5 at the pad top) (Table 2). The soil properties for the HS small model at these relative densities are given in Table 3. Drained conditions were assumed for all sand models and dry unit weights were employed throughout.
An example of the finite-element mesh generated is shown in Figure 3, which illustrates the mesh refinement employed around the foundation to improve accuracy. A fine meshing algorithm was used with 15-point triangular elements, resulting in approximately 191 500 elements in the model. The boundaries were 6.5B laterally from the foundation outer edge and 1.2B below the foundation base. Plaxis 3D allows for 3D volumes such as foundations to be simulated as rigid bodies (as adopted in this study); this avoids using alternative element types with very large stiffnesses, which can lead to computational errors in the stiffness matrix. The boundary conditions of the foundation rigid body were set to prevent horizontal translation or rotation, allowing vertical movement only. The foundations were modelled as weightless to allow concentration on the mechanistic behaviour in the soil during loading. Loading of the foundation was achieved by displacement-controlled movement of the rigid body foundation (as a single object) by a total of 30 mm vertically upwards (240 mm for direct comparison with equivalent centrifuge tests). The self-weight of the above-ground OLE structure was not considered in this study. Zero-thickness interface elements were included at the foundation element boundaries to allow for the inclusion of a strength reduction factor accounting for soil–structure interface friction. The interface friction of sand on a cast concrete surface is widely modelled as ⅔ϕcs (BSI, 2013b) and this value was adopted for all sand models. This was implemented in Plaxis by modifying the interface reduction factor (Rinter) for the three soil densities to maintain a constant value for the interface friction angle as per Table 3.
 The image presents a three-dimensional geometric model of a cube, featuring a triangular mesh that covers the outer surface uniformly, creating a clear visual structure of the object. On one side of the cube, a notch is highlighted, showing an inward recess with a sharp edge, indicating a possible design or structural element. The coordinate axes are marked along the bottom right corner, with arrows labelled 'X', 'Y', and 'Z' to denote the three dimensions, facilitating an understanding of the cube's orientation in space. The overall design demonstrates emphasis on structural analysis or computational modeling, common in engineering or simulation contexts.
Example of finite-element mesh used in Plaxis 3D analyses
The image presents a three-dimensional geometric model of a cube, featuring a triangular mesh that covers the outer surface uniformly, creating a clear visual structure of the object. On one side of the cube, a notch is highlighted, showing an inward recess with a sharp edge, indicating a possible design or structural element. The coordinate axes are marked along the bottom right corner, with arrows labelled 'X', 'Y', and 'Z' to denote the three dimensions, facilitating an understanding of the cube's orientation in space. The overall design demonstrates emphasis on structural analysis or computational modeling, common in engineering or simulation contexts.Example of finite-element mesh used in Plaxis 3D analyses
To simplify the modelling arrangement and the later centrifuge testing, the effect of replacing the central inclined column section of the foundations (normally inclined at 10 to 15°) with a vertical column was investigated. 2D Plaxis 2017 was used for this investigation using the same approach as described above. Figure 4 shows the load–displacement curves for the simulations run for a 3 m deep foundation in sand of relative density 30%, 60% and 90% with either a vertical column and load or a column and load inclined to 10°. No significant difference can be observed between the results of the inclined and vertical columns/loads and thus the simplified modelling approach appears valid. Plots of the shear strain in the soil after 30 mm displacement are shown for the vertical and inclined foundations in very-dense sand in Figure 5. Comparing these results, it is apparent that the failure surfaces in the 10° inclined column scenario were also tilted by 10° and thus the surface area of the failure surface and the volume of the soil within the wedge were effectively the same as in the vertical column. Consequentially, the total uplift capacity of the two scenarios also remains similar.
 The graph illustrates the relationship between vertical displacement measured in millimetres and plane strain uplift capacity measured in kilonewtons per metre. The x-axis represents vertical displacement ranging from zero to thirty millimetres, while the y-axis displays uplift capacity from zero to three hundred kilonewtons per metre. Distinct symbols indicate different conditions: squares represent D r equals thirty percent in vertical position, filled squares for inclined, circles denote sixty percent in vertical and inclined positions, and triangles signify ninety percent in both orientations. Each line connects data points specific to condition variables, showing trends in uplift capacity with increasing vertical displacement.
Load–displacement data for vertical and inclined foundation columns at H = 3 m depth in dry sand of 30%, 60% and 90% relative densities from Plaxis 2D FEA
The graph illustrates the relationship between vertical displacement measured in millimetres and plane strain uplift capacity measured in kilonewtons per metre. The x-axis represents vertical displacement ranging from zero to thirty millimetres, while the y-axis displays uplift capacity from zero to three hundred kilonewtons per metre. Distinct symbols indicate different conditions: squares represent D r equals thirty percent in vertical position, filled squares for inclined, circles denote sixty percent in vertical and inclined positions, and triangles signify ninety percent in both orientations. Each line connects data points specific to condition variables, showing trends in uplift capacity with increasing vertical displacement.Load–displacement data for vertical and inclined foundation columns at H = 3 m depth in dry sand of 30%, 60% and 90% relative densities from Plaxis 2D FEA
 The image presents two graphical representations labelled (a) and (b) that illustrate the distribution of total principal strain across specific depth and horizontal distances. Each graph features a prominent L-shaped boundary outline. The horizontal axis represents horizontal distance measured in meters, ranging from negative six to positive six, while the vertical axis indicates depth in millimetres, extending from four to zero. To the right of each graph is a gradient bar indicating total principal strain values, ranging from negative zero point zero three to zero. The shading within each graph transitions from lighter to darker shades, illustrating variations in strain. Notably, the overall structure facilitates comparison between the two representations.
Comparison of strain from 2D FEA after 25 mm displacement of a 3 m deep foundation in 90% relative density sand: (a) vertical column and load; (b) 10° inclined column and load
The image presents two graphical representations labelled (a) and (b) that illustrate the distribution of total principal strain across specific depth and horizontal distances. Each graph features a prominent L-shaped boundary outline. The horizontal axis represents horizontal distance measured in meters, ranging from negative six to positive six, while the vertical axis indicates depth in millimetres, extending from four to zero. To the right of each graph is a gradient bar indicating total principal strain values, ranging from negative zero point zero three to zero. The shading within each graph transitions from lighter to darker shades, illustrating variations in strain. Notably, the overall structure facilitates comparison between the two representations.Comparison of strain from 2D FEA after 25 mm displacement of a 3 m deep foundation in 90% relative density sand: (a) vertical column and load; (b) 10° inclined column and load
2.2 Centrifuge physical modelling methodology
The Actidyn 3 m beam centrifuge at the University of Dundee was used for all centrifuge testing at 42.85g, giving a scaling factor of N = 42.85. The key dimensions were consistent with the numerical modelling (e.g. B = 3 m) as per Figure 1. All model length and displacements were scaled by N and weight/force by N2. Displacement of the model, at a rate of 5 mm/min, was provided by the vertical axis of the dual-axis actuator developed at the University of Dundee, initially for investigations relating to screw piles (Al-Baghdadi et al., 2016; Davidson et al., 2018). During loading, forces were continuously measured by an axial force load cell (F310-Z, Novatech Measurements Ltd) connected to the top of the column by way of a specially designed coupler. The coupler had a built-in tolerance gap that allowed the foundation to settle during g up of the centrifuge and then the gap was taken up on starting the loading event. The load cell was capable of measuring axial force to ±20 kN. The vertical foundation displacement was measured by a WDS-750-P60-CR-P draw-wire sensor.
The control and data acquisition system used to operate the actuator and record data from the sensors was based around a National Instruments 9047 CompactRIO signal-conditioned input/output real-time controller. Motor control and data logging occurred at 125 Hz. Additionally, video footage of the foundation was recorded for the duration of each test using a GoPro Hero 7.
The foundations used in the centrifuge testing were 1:42.85 scale models of the pyramid and pad and column (or chimney) style foundations shown in Figure 1. The base and columns of the models were fabricated from 6061 aluminium. The base of the foundation was manufactured separately to the column portion to easily alter the embedment depth by using different length columns. Two bases of each foundation geometry were made to allow testing of two foundation variants in one box of sand prepared to a uniform relative density. An M8 countersunk socket head screw was used to connect the base and column together. The aluminium used in the centrifuge tests was chosen to be significantly stiffer than reinforced concrete so soil stiffness/failure alone could be considered in isolation. This is in line with the numerical modelling where the foundations were modelled as rigid objects. No additional surface interface preparation was undertaken for the foundation models as FEA modelling of rough and smooth interfaces showed little effect on the results as failure tended to occur in the soil body. As the FEA model assumed weightless foundations, the weight of the foundations was subtracted from the measured loads.
To recreate the presence of a real construction sequence with backfilled sand, 1 mm thick steel plate square boxes, with lengths to match the embedment depths of the foundations, were also fabricated. These were placed around the foundation to leave a void during preparation of the surrounding sand, which could then be filled independently with sand.
A model container of internal dimensions 500 × 800 × 500 mm (width × length × depth) was used. The loading actuator was bolted to bars in T-slot rails on either side of the box and positioned towards either end of the box. This allowed two tests to be completed in each box by stopping the centrifuge and moving the rig to the other end of the box. Checks were completed to ensure that no boundary effects were present due to too large a model being used or from positioning it too close to the edge of the box/second model. For example, a foundation embedded at 6 m prototype depth (H/B = 2) in 80% Dr soil at 1/3 along the length of the box would require a failure surface to form at 35° for interaction at the sand surface between multiple tests. Whereas, based on the work of Giampa et al. (2019) and the preliminary numerical modelling, with failure mechanism propagation angles equal to the dilation angle, the separation distances were sufficient that no interaction of the failure surfaces occurred. This was also verified through observations of post-test surface failure mechanism presentation (discussed later) and FEA.
Dry HST95 sand was used for all centrifuge modelling to simplify the methodology and prevent complications from undrained conditions or rate effects. HST95 is a fine sand with D10 and D50 particle sizes of 0.10 mm and 0.14 mm, respectively (Lauder et al., 2013). Relevant properties of HST95 are presented in Table 4. All soil beds were created by means of dry air pluviation (Ueno, 1998). The dense layer was prepared using a slot pluviator, which was automated and designed to move back and forth at a constant speed on rails with the pluviator set 1.5 m above the bottom of the strong box and 1.1 m above the final soil surface. Example pluviation parameters were a slot width of 5 mm and a pluviator sweeping speed of 150 mm/s for a target Dr = 60% based upon previous calibration studies.
HST95 sand properties from centrifuge tests (Al-Defae, 2013; Lauder, 2010)
| Property | Value |
|---|---|
| Effective particle size, D10: mm | 0.09 |
| Average particle size, D50: mm | 0.14 |
| Critical state friction angle, ϕ′crit: degrees | 32 |
| Angle of dilationa at Dr = 60%, ψ: degrees | 11.2 |
| Peak friction anglea at Dr = 60%, ϕ’pk: degrees | 41 |
| Maximum dry density, ρmax: kN/m3 | 17.58 |
| Minimum dry density, ρmin: kN/m3 | 14.59 |
aInferred from best-fit peak strength relationship from direct shear tests for data at effective stresses between 50–200 kPa and critical state friction angle, at 60% relative density (Al-Defae et al., 2013)
The tests completed replicated uplift loading of embedded foundations in both uniform and backfilled dry sand. As such, the sand was prepared around the foundation models. As an example, for a box with foundations at embedment ratios of H/B = 1.0 and 1.5, the sand was firstly pluviated to a thickness of 313 mm (model scale) and scraped level. Next, the first foundation was placed at the correct location. Pluviation was then continued to a thickness of 348 mm and scraped level, followed by positioning of the second foundation (to allow different depth or H/B in the same box). These steps are illustrated in Figure 6. To finish the preparation, the sand was pluviated to a thickness of 430 mm and scraped level, giving depths of 117 mm and 82 mm to the base of each foundation.
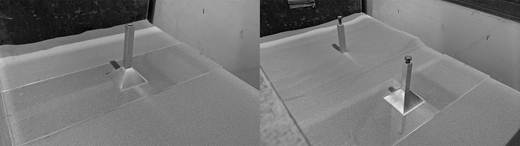
Placement of foundations using plastic guide plate on flat and level sand surface (model pyramidal foundation shown)
Placement of foundations using plastic guide plate on flat and level sand surface (model pyramidal foundation shown)
For the backfilled foundation tests, the above procedure was completed to the point where the foundation was placed on the level sand surface. Following this, a steel box with a lid (to reduce sand ingress) was placed around the foundation to replicate an installation retaining system and pluviation was continued as before to a total thickness of 430 mm (model scale). The lid of the formwork box was removed and any extra sand was extracted with a vacuum. To prepare the sand inside the form (thus representing the backfill), sand was poured from a funnel with a 1 mm mesh opening from a height of >1 m above the model. The form was removed from the sand after the model container and rig were mounted on the centrifuge (Figure 7). To minimise any disturbance to the sand, the form extraction was completed using the centrifuge actuator at a rate of 5 mm/min. Table 5 summarises the centrifuge test programme.
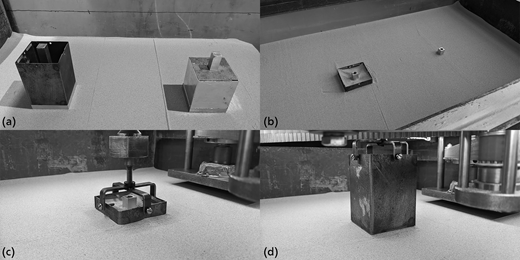
Backfill test preparation; (a) Pad and column models positioned in box with backfill formwork in place; (b) Prepared sand bed with models in place (note formwork is slightly below sand surface for the model on the right-hand side); (c) Centrifuge rig attached to backfill form box ready for extraction; (d) Low disturbance of sand after extraction of form box
Backfill test preparation; (a) Pad and column models positioned in box with backfill formwork in place; (b) Prepared sand bed with models in place (note formwork is slightly below sand surface for the model on the right-hand side); (c) Centrifuge rig attached to backfill form box ready for extraction; (d) Low disturbance of sand after extraction of form box
Summary of centrifuge test programme
| Foundation type | Base depth: m | Embedment ratio, H/Ba | Relative density, Dr: % |
|---|---|---|---|
| Pad and column foundation | |||
| 2.014 | 0.50 | 49 | |
| 3.514 | 1.00 | 42 | |
| 5.014 | 1.50 | 42 | |
| 2.014 | 0.50 | 62 | |
| 3.514 | 1.00 | 60 | |
| 5.014 | 1.50 | 62 | |
| 2.014 | 0.50 | 85 | |
| 3.514 | 1.00 | 82 | |
| 5.014 | 1.50 | 82 | |
| 3.514 | 1.00 | 60 with backfill at 60 | |
| Pyramid foundation | |||
| 2.014 | 0.67 | 62 | |
| 3.514 | 1.17 | 62 | |
| 5.014 | 1.67 | 62 |
aEmbedment ratio calculated from top of pad and base of pyramid
3. Results and discussion
3.1 Comparison of centrifuge testing and FEA
Figure 8 presents a comparison of the Plaxis and centrifuge results for the pad and pyramid foundations at prototype scale (all dimensions shown and discussed going forward are at prototype scale). A good match was observed between the numerical and physical tests at all embedment depths. For example, the numerical and physical behaviours were almost equal to displacements of 14 mm and 30 mm in the H/B = 1.5 and H/B = 1.0 pad tests (Figure 8(a)). The results began to diverge with continued displacement in the deeper tests of both foundation types. The centrifuge results exhibit a clear peak and post-peak softening behaviour, while the Plaxis results continued to increase with increasing displacement, which is a feature of the hardening soil constitutive model previously discussed. Although there is some divergence in the Plaxis data at higher displacements, this did not affect further analysis and comparison as the ultimate limit state in foundations is normally compared at a maximum displacement of 25 mm (prototype scale) in the UK and other ultimate capacity determination criteria that may be adopted are pre-peak and usually less than 25 mm (BSI, 1997; NG, 2018).
 The image contains two graphs labeled (a) and (b) that illustrate the relationship between uplift force measured in kilonewtons and vertical displacement measured in millimetres. The first graph (a) shows a set of curves for different ratios of height to breadth (H slash B), marked as 0.5, 1.0, and 1.5, with distinct line styles for Centrifuge and F E A data. The second graph (b) presents similar information for H slash B ratios of 1.17 and 1.67, using differing line styles to differentiate between Centrifuge and F E A data. Both graphs feature horizontal axes labelled "Vertical displacement: m m" and vertical axes labelled "Uplift force: k N." The data points and lines exhibit variations in trends across the different H slash B ratios, with visually distinctive patterns for each dataset.
Comparison of Plaxis 3D results and centrifuge modelling: (a) pad foundation at H/B = 0.5, 1.0 and 1.5; (b) pyramid foundation at H/B = 1.17 and 1.67 in sand at 60% relative density
The image contains two graphs labeled (a) and (b) that illustrate the relationship between uplift force measured in kilonewtons and vertical displacement measured in millimetres. The first graph (a) shows a set of curves for different ratios of height to breadth (H slash B), marked as 0.5, 1.0, and 1.5, with distinct line styles for Centrifuge and F E A data. The second graph (b) presents similar information for H slash B ratios of 1.17 and 1.67, using differing line styles to differentiate between Centrifuge and F E A data. Both graphs feature horizontal axes labelled "Vertical displacement: m m" and vertical axes labelled "Uplift force: k N." The data points and lines exhibit variations in trends across the different H slash B ratios, with visually distinctive patterns for each dataset.Comparison of Plaxis 3D results and centrifuge modelling: (a) pad foundation at H/B = 0.5, 1.0 and 1.5; (b) pyramid foundation at H/B = 1.17 and 1.67 in sand at 60% relative density
The uplift capacity performance of the two foundation geometries from FEA simulations is compared in Figure 9, shown as normalised uplift capacity or a breakout factor as per Equation 8
 The graph plots normalised uplift capacity (N q) against embedment ratio (H over B). The vertical axis ranges from 0 to 4 with increments of 0.5, while the horizontal axis ranges from 0 to 2 with increments of 0.2. Four categories are represented by markers: empty squares for Pad foundations at peak uplift force, empty triangles for Pyramid foundations at peak uplift force, filled squares for Pad foundations at 25 millimetre displacement, and filled triangles for Pyramid foundations at 25 millimetre displacement. Data points follow non-linear trends, showing how uplift capacity changes with embedment ratio under different conditions, with Pads and Pyramids displaying distinct behaviours.
Normalised uplift capacity–displacement response of pad and pyramid foundations from FEA simulations in uniform medium-dense sand: (a) pad foundation; (b) pyramid foundation
The graph plots normalised uplift capacity (N q) against embedment ratio (H over B). The vertical axis ranges from 0 to 4 with increments of 0.5, while the horizontal axis ranges from 0 to 2 with increments of 0.2. Four categories are represented by markers: empty squares for Pad foundations at peak uplift force, empty triangles for Pyramid foundations at peak uplift force, filled squares for Pad foundations at 25 millimetre displacement, and filled triangles for Pyramid foundations at 25 millimetre displacement. Data points follow non-linear trends, showing how uplift capacity changes with embedment ratio under different conditions, with Pads and Pyramids displaying distinct behaviours.Normalised uplift capacity–displacement response of pad and pyramid foundations from FEA simulations in uniform medium-dense sand: (a) pad foundation; (b) pyramid foundation
where Nγ is the breakout factor, Qu is the uplift capacity (kN), γ is the unit weight of soil (kN/m3), A is the projected foundation area (m2) and H is the depth to failure surface origin (m).
The breakout factor approach was adopted as the foundation was effectively deeper for the pyramids due to their geometry while, for the pads, the failure surface emanates from the upper edge. Figure 9 shows a very similar linear relationship between the embedment ratio and the uplift capacity for both foundation types with no significant difference in their peak uplift capacity. One difference was a stiffer response of the pad foundation at all depths, suggesting that the capacity at a displacement of 25 mm (serviceability limit) was lower for the pyramid foundation style than for the pad and column foundation (Figure 9).
3.2 Verification of proposed design method to capture soil behaviour
To check the validity of adopting new methods such as that proposed by Giampa et al. (2019), it was first decided to use the FEA results to inspect the predominant failure mechanisms and check the validity of the approach where failure surfaces are assumed to be inclined at the dilation angle.
The strains after 25 mm of uplift for both foundation types at three depths and densities are shown in Figure 10. Overlain on these graphs are the assumed failure surfaces from the various design methods. In all cases, the method of Giampa et al. (2019), which is based upon the soil’s dilation angle, most closely represents the failure mechanism from the simulations. The other methods vary in how closely they match, depending on the relative density (Dr). For example, in the loose sand, with minimal dilation and a near-vertical failure surface, the assumed vertical failure surface of method M3 from BS EN 50341-1:2012 (BSI, 2013a) was also a close match to the observed failure plane. Similarly, in dense sand, method M2 provided a moderately close match. However, the dilation angle approach of Giampa et al. (2019) performed consistently well across all relative densities. This evidence would suggest that the Giampa et al. (2019) method appears to have the potential to give superior capacity prediction to currently adopted UK approaches and is a more logical reflection of true soil behaviour where shear resistance is created at the propagating interfaces.
 The image presents a grid of plots illustrating total principal strain, labelled as e1, as a function of depth in metres and horizontal distance, with variations for different Dr percentages, set at 30 percentage, 60 percentage, and 90 percentage. The data is organised into three rows and three columns. Each column represents a different Dr percentage, while the rows depict varying depths. There are contour plots filled with blue shades to represent values of total principal strain, with accompanying contour lines distinguishing different strain levels. The axes on the left represent depth measured in metres, and the bottom axis indicates horizontal distance. A colour bar on the right provides a scale for total principal strain values, ranging from negative to positive strains. Specific dashed and solid lines reference different methodologies. A small inset in each plot suggests continuity and comparison across the charts.
Strain after 25 mm uplift of (a) pyramid foundation and (b) pad foundation with assumed failure surface from design methods overlain
The image presents a grid of plots illustrating total principal strain, labelled as e1, as a function of depth in metres and horizontal distance, with variations for different Dr percentages, set at 30 percentage, 60 percentage, and 90 percentage. The data is organised into three rows and three columns. Each column represents a different Dr percentage, while the rows depict varying depths. There are contour plots filled with blue shades to represent values of total principal strain, with accompanying contour lines distinguishing different strain levels. The axes on the left represent depth measured in metres, and the bottom axis indicates horizontal distance. A colour bar on the right provides a scale for total principal strain values, ranging from negative to positive strains. Specific dashed and solid lines reference different methodologies. A small inset in each plot suggests continuity and comparison across the charts.Strain after 25 mm uplift of (a) pyramid foundation and (b) pad foundation with assumed failure surface from design methods overlain
While there was no observed difference between the angle of the failure surface between the pad and pyramid foundations in the same soil and embedment conditions, there was a notable difference in where the failure surface originated. For all pad simulations, the failure surface started from the upper edge of the pad, whereas it began from the base of the pyramid in all cases (Figure 10).
Any assumptions regarding the depth of the failure surface in the uplift capacity approaches will clearly impact the calculated value. For a foundation that does not have an undercut excavation it would seem logical to adopt the upper face in the case of a pad foundation, but method M3 of BS EN 50341-1:2012 (BSI, 2013a) states the frustum emanates from the base of the pad. For a 0.5 m thick slab, this extra depth may lead to an unconservative calculation of the capacity.
From the numerical and physical modelling evidence in this study, it is suggested that the failure surface should be assumed to start from the pad top and pyramid base. Conservatively, the concrete–soil shearing resistance on the perimeter of the pad was neglected in all of the design method calculations.
3.3 Performance of design approaches
To further add confidence in the potential for adopting a new design approach, the efficiency of the FEA was used to explore a wider parameter set (e.g. H/B and different soil densities) and compare performance with other existing design methods and the centrifuge test data. The Plaxis 3D uplift at peak capacity is shown in Figures 11(a), 11(c) and 11(e) for both foundation types and compared with the predicted values using the methods outlined in the introduction. For all relative densities, the predictions made using the methods of Meyerhof and Adams (1968), Ovesen (1981) and Murray and Geddes (1987) significantly overpredicted the uplift capacity. Normalising the predicted values by the Plaxis results at the relevant depths (Figures 11(b), 11(d) and 11(f)) shows that these methods overpredicted the Plaxis results by up to 2.73 times for all sand densities. The approach of Ovesen (1981) appeared to perform consistently well at the lowest embedment ratio of 0.67 (depth, H = 2 m), but only at this point.
 The image features multiple graphs illustrating the relationship between uplift capacity and the embedment ratio for various design methods. Each graph is labelled with sub-figures (a, b, c, d, e, f) and includes two primary axes: the vertical axis represents uplift capacity in kiloNewtons (k N), while the horizontal axis indicates the embedment ratio, specified as H slash B. Different design methods are represented by distinct line styles and symbols, with a legend detailing these variations. Key design methods include Giampa et al. (2019), N G T S 34.15 (2018), and others, with data points for Plaxis 3 D, Centrifuge, pad, and pyramid shapes. The graphs display data trends across a range of embedment ratios, with certain areas emphasised, such as horizontal dashed lines indicating prediction benchmarks. Complex navigation is not required, as data flows left to right by method and top to bottom by the figure number.
Comparison of Plaxis 3D and centrifuge results for pad and pyramid foundations with predicted values for relative densities of: (a) 30%; (c) 60%; (e) 90%. (b), (d) and (f) show predicted values normalised by peak values from Plaxis simulations
The image features multiple graphs illustrating the relationship between uplift capacity and the embedment ratio for various design methods. Each graph is labelled with sub-figures (a, b, c, d, e, f) and includes two primary axes: the vertical axis represents uplift capacity in kiloNewtons (k N), while the horizontal axis indicates the embedment ratio, specified as H slash B. Different design methods are represented by distinct line styles and symbols, with a legend detailing these variations. Key design methods include Giampa et al. (2019), N G T S 34.15 (2018), and others, with data points for Plaxis 3 D, Centrifuge, pad, and pyramid shapes. The graphs display data trends across a range of embedment ratios, with certain areas emphasised, such as horizontal dashed lines indicating prediction benchmarks. Complex navigation is not required, as data flows left to right by method and top to bottom by the figure number.Comparison of Plaxis 3D and centrifuge results for pad and pyramid foundations with predicted values for relative densities of: (a) 30%; (c) 60%; (e) 90%. (b), (d) and (f) show predicted values normalised by peak values from Plaxis simulations
The methods of Meyerhof and Adams (1968), Ovesen (1981) and Murray and Geddes (1987) all use a peak friction angle in various ways to define the failure wedge and, as shown in Figure 10, the failure wedge of the Meyerhof and Adams (1968) method, for example, is well outside of that observed in the Plaxis results. Therefore, higher predicted values should be expected from these methods as the surface area over which the shear resistance is predicted is much greater, as is the volume and therefore the weight of soil presumed to be uplifted. These methods are not considered appropriate for the design or re-analysis of the uplift capacity of OLE foundations as investigated herein.
Uplift capacity predictions from the analytical (method M2) and empirical (method M3) approaches in BS EN 50341-1:2012 (BSI, 2013a) are also shown in Figure 11. These predictions were consistently and significantly below the Plaxis 3D and centrifuge results. Although method M3 attempts to change the failure surface angles based on the relative density of the sand, the lack of inclusion of any shear resistance results in a predicted capacity less than that observed. Furthermore, the unrealistic use of the pad base depth in the calculation is masking a poorer performance than if the pad top was used as per the other design methods that match the observed failure surface origin. For consistency with the other methods, the shearing resistance between the perimeter of the pad and soil was omitted for method M3. For method M2, the inclusion of shear resistance on the assumed vertical failure plane using the critical state friction angle was not correctly captured in this case of uniform soil conditions where the failure surface can develop without interference from any interfaces such as the backfill–native soil interface. Thus, the area of shear resistance and the weight of soil is not reflective of the actual failure and the predicted value is lower than the observed capacity, as would be expected.
Comparison of the approach in NG TS 3.4.15 (NG, 2018) with the Plaxis and centrifuge results in Figure 11 shows the consistent underprediction of values for all scenarios. These findings are of particular importance in the reassessment of existing foundations to ascertain their suitability in supporting higher loads from upgrades to the line. Any underpredictions compared with the true uplift capacity of the foundation may lead to the unnecessary decision to upgrade the foundation by modification or replacement. As demonstrated in Figure 10, the NG TS 3.4.15 (NG, 2018) angles of 15° and 25° (Table 1) exceed the observed failure wedge in all cases. While this is just an empirical relationship, it does demonstrate that the assumption that the increased weight of soil from the larger frustum can effectively capture the true uplift capacity is incorrect. Increases in soil weight from larger volumes are typically outweighed by the inclusion of the shear resistance in the capacity calculations and measured resistances, as shown in Figure 12 which compares the values of the shear and weight components of the Giampa et al. (2019) equations with the weight-only NG TS 3.4.15 (NG, 2018) values.
 The graph illustrates the relationship between uplift capacity components measured in kilonewtons and the embedment ratio represented on the horizontal axis as H divided by B, ranging from zero to two. Various data series are presented, including the weight of the square block, wedges, and corners, alongside shear resistances. The graph visually distinguishes these components through shaded areas, while a solid black line represents the total weight of soil calculated as the sum of the weights of the square block, wedges, and corners. There are indications for equations correlating to each component, and a point referenced as N G T S 3.4.15 from 2018, enhancing the contextual data presented.
Stacked plot of the five components in the Giampa et al. (2019) method, compared with the NG TS 3.4.15 (NG, 2018) method for pad foundation at H/B = 3 in very dense sand (Dr = 90%)
The graph illustrates the relationship between uplift capacity components measured in kilonewtons and the embedment ratio represented on the horizontal axis as H divided by B, ranging from zero to two. Various data series are presented, including the weight of the square block, wedges, and corners, alongside shear resistances. The graph visually distinguishes these components through shaded areas, while a solid black line represents the total weight of soil calculated as the sum of the weights of the square block, wedges, and corners. There are indications for equations correlating to each component, and a point referenced as N G T S 3.4.15 from 2018, enhancing the contextual data presented.Stacked plot of the five components in the Giampa et al. (2019) method, compared with the NG TS 3.4.15 (NG, 2018) method for pad foundation at H/B = 3 in very dense sand (Dr = 90%)
The Giampa et al. (2019) method showed a good agreement with the Plaxis and centrifuge results for both foundation types. The average predicted/measured capacity ratio from the FEA simulations ranged from 0.90 to 1.08 across the density range (Figure 11 and Table 6). In comparison, the average of the NG TS 3.4.15 (NG, 2018) predictions as a ratio of the FEA results was 0.70–0.92. These results indicate that the method developed by Giampa et al. (2019) has the potential to provide the most consistent and accurate results from the methods considered herein.
Statistical summary of NG TS 3.4.15 (NG, 2018) and Giampa et al. (2019) predictions normalised by Plaxis 3D results
| Method | Dr = 30% | Dr = 60% | Dr = 90% | |||
|---|---|---|---|---|---|---|
| Pad | Column | Pad | Column | Pad | Column | |
| Giampa et al. (2019) | 0.90 | 1.00 | 0.95 | 1.08 | 0.95 | 1.05 |
| NG (2018) | 0.82 | 0.92 | 0.70 | 0.74 | 0.83 | 0.90 |
Figure 13 shows the percentage gain in predicted uplift capacity of the Giampa et al. (2019) method over the NG TS 3.4.15 (NG, 2018) method. For all three relative densities there was a significant gain in capacity from the Giampa et al. method, ranging from a 10% to 50% increase over the NG TS 3.4.15 method at an embedment ratio of 1. Such gains in predicted capacity may mean that more foundations do not need be replaced during the reassessment of existing foundations, which would result in significant savings in time, money and carbon dioxide emissions. As noted previously, UK practice is to define failure at the uplift load corresponding to 25 mm displacement (assumed historical 1 inch mixed load/serviceability criteria). The Giampa et al. (2019) method is an ultimate limit state approach (e.g. assumed to be associated with peak behaviour), so it might be argued that the results need to be downgraded (as per Figure 9) to allow true comparison. That said, there is no evidence to support the definition of NG TS 3.4.15 (NG, 2018) at 25 mm where it has its origins in effectively limit state behaviour uplifting a defined soil volume (i.e. strain/displacement level independent).
 The graph depicts the relationship between uplift capacity percentage gain and embedment ratio, labelled on the vertical and horizontal axes respectively. The vertical axis represents uplift capacity percentage gain, ranging from zero to one hundred percent, while the horizontal axis represents the embedment ratio scaled from zero to two. Three distinct lines represent different values of D sub r: D sub r equals thirty percent is depicted by a solid line, D sub r equals sixty percent by a dashed line, and D sub r equals ninety percent by a dashed and dotted line. The lines ascend gradually, illustrating their respective performance trends as the embedment ratio increases. The legend identifying each D sub r line is positioned in the upper right corner.
Percentage gain in predicted uplift capacity of the Giampa et al. (2019) method over the NG TS 3.4.15 (NG, 2018) method
The graph depicts the relationship between uplift capacity percentage gain and embedment ratio, labelled on the vertical and horizontal axes respectively. The vertical axis represents uplift capacity percentage gain, ranging from zero to one hundred percent, while the horizontal axis represents the embedment ratio scaled from zero to two. Three distinct lines represent different values of D sub r: D sub r equals thirty percent is depicted by a solid line, D sub r equals sixty percent by a dashed line, and D sub r equals ninety percent by a dashed and dotted line. The lines ascend gradually, illustrating their respective performance trends as the embedment ratio increases. The legend identifying each D sub r line is positioned in the upper right corner.Percentage gain in predicted uplift capacity of the Giampa et al. (2019) method over the NG TS 3.4.15 (NG, 2018) method
3.4 Effect of modelling more realistic construction processes
The material backfilled into the excavation created during the construction of both the pad/column and pyramid foundations is likely to be of a different density than the surrounding undisturbed native soil. Furthermore, the interface at the boundary of the excavation is likely to introduce a plane along which the failure surface would preferentially develop during uplift of the foundation (NG, 2018) a short time after construction. Tests were completed with the pyramid and the pad foundations in sand with medium-dense backfill. The variation of backfill density was not considered in this study and will form part of future investigations.
The backfilled sand was placed at a relative density of 60%, matching the native sand, to provide insights on the influence of a more realistic excavation. Figure 14(a) shows the load–displacement data from centrifuge testing for the backfilled pad test with H/B = 1.0 in medium-dense sand in comparison to the equivalent test in uniform sand conditions (effectively a wished-in-place foundation with no backfilling). A significant reduction in peak capacity is immediately apparent for the backfilled case (29% less than the uniform sand test). Another difference of note is the mobilisation distance required to reach peak capacity, which was 96.2 mm for the medium-dense backfill, compared with 62.7 mm for the uniform sand test. Figure 14(b) shows the first 30 mm of uplift, demonstrating that the foundation had very similar stiffness in the backfilled and uniform sand conditions over the first 4 mm of displacement. Then there was a distinct yield in the backfilled case and limited further strain hardening. At 25 mm displacement, the difference in capacity for the backfilled case was lower by 15.8%.
 The image features two graphs showing the relationship between uplift capacity and vertical displacement. Graph (a) illustrates a general decline in uplift capacity for two conditions: medium-dense soil with backfilled medium-dense material, represented by circular markers, and uniform medium-dense soil, indicated by square markers. The x-axis represents vertical displacement in meters, while the y-axis measures uplift capacity in kilonewtons. Graph (b) follows the same format, but the data is focused on lower vertical displacements, presenting a different trend with similar soil conditions and markers. Each graph includes labels to differentiate the two conditions, with the first scenario showing values ranging from zero to one thousand kilonewtons and displacements up to three hundred millimeters, while the second is zoomed in on initial displacements.
Load–displacement data for pad foundation at H/B = 1 in uniform medium-dense (Dr = 60%) sand with medium-dense backfilled (Dr = 60%) sand: (a) 0.3 m uplift; (b) 30 mm uplift
The image features two graphs showing the relationship between uplift capacity and vertical displacement. Graph (a) illustrates a general decline in uplift capacity for two conditions: medium-dense soil with backfilled medium-dense material, represented by circular markers, and uniform medium-dense soil, indicated by square markers. The x-axis represents vertical displacement in meters, while the y-axis measures uplift capacity in kilonewtons. Graph (b) follows the same format, but the data is focused on lower vertical displacements, presenting a different trend with similar soil conditions and markers. Each graph includes labels to differentiate the two conditions, with the first scenario showing values ranging from zero to one thousand kilonewtons and displacements up to three hundred millimeters, while the second is zoomed in on initial displacements.Load–displacement data for pad foundation at H/B = 1 in uniform medium-dense (Dr = 60%) sand with medium-dense backfilled (Dr = 60%) sand: (a) 0.3 m uplift; (b) 30 mm uplift
A comparison of predicted and measured values for the pad and column with backfilled sand tests is shown in Figure 15. The ratio of measured to predicted values were equal to 1 for both tests, further demonstrating the potential suitability of the Giampa et al. (2019) method and its applicability to backfilled conditions. In the calculations of the capacities for backfilling, the dilation angle was set to zero to reflect the vertical nature of the backfill–native soil interface and the friction angle was assumed to be equal to the critical state friction angle of the HST95 sand to reflect disturbance of the soil close to the interface on excavation support removal. This is instead of the dilation angle and peak friction angles for the wedge geometry and shearing resistance as used in the uniform sand.
 The image depicts a graph illustrating the relationship between uplift capacity and embedment ratio. The vertical axis, labelled "Uplift capacity, Q u, k N," ranges from zero to over two thousand kilonewtons, indicating uplift capacity. The horizontal axis, labelled "Embedment ratio, H slash B," spans from zero to two, marking the embedment ratio. Data points for centrifuge test backfill with a relative density of sixty percent are indicated with circular markers. The curve representing data from Giampa and others uses a dashed black line, while the dotted line represents data from the British Standard. Input parameters, including relative density and angle measures, are specified in the graph's legibility. The graph allows for visual examination of how uplift capacity varies with embedment ratio as data flows left to right.
Comparison of measured and predicted uplift capacities for pad foundation at H/B = 1 in medium-dense sand with medium-dense backfill
The image depicts a graph illustrating the relationship between uplift capacity and embedment ratio. The vertical axis, labelled "Uplift capacity, Q u, k N," ranges from zero to over two thousand kilonewtons, indicating uplift capacity. The horizontal axis, labelled "Embedment ratio, H slash B," spans from zero to two, marking the embedment ratio. Data points for centrifuge test backfill with a relative density of sixty percent are indicated with circular markers. The curve representing data from Giampa and others uses a dashed black line, while the dotted line represents data from the British Standard. Input parameters, including relative density and angle measures, are specified in the graph's legibility. The graph allows for visual examination of how uplift capacity varies with embedment ratio as data flows left to right.Comparison of measured and predicted uplift capacities for pad foundation at H/B = 1 in medium-dense sand with medium-dense backfill
These assumptions are supported by the surface expression of the uplifted wedge of sand that formed during uplift of the foundation in the medium-dense backfilled test (Figure 16(a)). Measuring from the centre of the column to the right of the sand mound in the photos yielded a failure surface angle of 0°, supporting the assertion that the failure surface followed the boundary between the backfilled excavation and the native sand. This compares to 10.5° when the surface presentation was measured in the uniform sand case (Figure 16(b)), which suggests a failure surface inclined at the dilation angle.
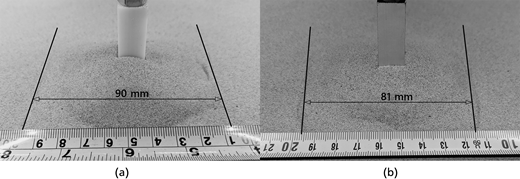
(a) Sand surface after test of pad and column at H/B = 1 in medium-dense sand with dense backfill. The measured width of the surface expression of the sand failure surface results in ∼0° failure surface angle. (b) Sand surface following the uplift test
(a) Sand surface after test of pad and column at H/B = 1 in medium-dense sand with dense backfill. The measured width of the surface expression of the sand failure surface results in ∼0° failure surface angle. (b) Sand surface following the uplift test
The assumption of whether to use soil properties relating to uniform or backfilled conditions in the calculation of the uplift capacity of a particular foundation would be at the discretion of the design engineer. The existing design approaches in NG TS 3.4.15 (NG, 2018) do not necessarily refer to uniform or backfilled conditions but different model safety factors are stated for new design (safety factor of 1.5) and the assessment of existing pad and column foundations (safety factor of 1.1). Anecdotally, it is felt that this may be due to uncertainty regarding the outcome of the frustum design method when soil conditions may be assumed to be uniform or disrupted by backfill; that is, the backfill interface becomes less well defined with foundation age.
The results presented in this paper do not necessarily promote the use of one scenario over another and further investigations would be required to provide guidance on when each approach should be used, particularly if this transition is related to the foundation age, which would be challenging to investigate. However, it is suggested that if uniform soil conditions are assumed by the designer, the use of an inclined failure surface based on a realistic dilation angle of the sand should be used in the Giampa et al. (2019) method along with the peak friction angle. Alternatively, when backfilled conditions are assumed to control the design, the dilation angle in Giampa et al. (2019) should be zero and the friction angle set to equal the critical state friction angle.
4. Conclusions
In this work, 3D FEA modelling and centrifuge testing were used to investigate the efficiency of current typical UK industry approaches to uplift capacity determination for OLE structure pyramid and pad/column foundations. The results show that current UK adopted methods based on the frustrum or soil cone are conservative and may lead to inefficiency in the construction of new structures and could result in the unnecessary upgrading of existing structures subjected to increased line loads. Other empirically based approaches generally overpredict capacity by a significant amount and may be unsafe.
Investigation of a more recently adopted design approach that has its origins in the offshore industry and is designed to reproduce more realistic mechanistic soil behaviour yielded much better performance than current industry and historical empirical approaches. The proposed performance and mechanistic behaviour were explored through 3D FEA with similar failure envelopes and inclinations linked to dilation angle and measurable in situ parameters.
The FEA results also provided evidence that the failure surface originates from the pad top and pyramid base, which does not match the guidance in BS EN 50341-1:2012 (BSI, 2013a), which suggest the use of the depth to the foundation base.
As well as exploring design methods, centrifuge testing was also used to investigate the effect of construction processes such as realistic staged foundation support and backfilling. This showed that, even when the excavation support system was removed, the vertical excavation support still dictated the position of the failure surfaces after backfilling and during foundation uplift. This suggests that modelling of uniform soils or wished-in-place foundations may not reflect true short-term field performance.
At this stage of study, only sand was considered at the work was based on model testing and numerical simulations. For full adoption, investigations would be required into other material types and ideally would be backed up by larger scale testing or field tests. It is noted that all of the tests undertaken in this investigation were in dry sands and the loads reported in this paper reflect an upper bound case depending on the position of the groundwater table and ground saturation regime in the field.
Acknowledgements
The authors acknowledge the Network Innovation Allowance, without which this project would not have been possible. The authors also would like to acknowledge National Grid Electricity Transmission and SSEN Transmission for supporting the project and agreeing to publication of the results. The third author is funded by the University of Dundee, the Energy Technology Partnership (ETP) and SSEN Transmission and this support is also thankfully acknowledged. The views expressed are those of the authors alone and do not necessarily represent the views of their respective companies or employing organisations.
