


This research analyzes the role that information systems flexibility (IS flexibility) plays in the other components of supply chain flexibility (SCF) and how this role affects business performance (BP) in lean production (LP) environments.
Three hypotheses are tested using covariance-based structural equations modeling (CB-SEM). The previous literature shows that IS flexibility does not mediate the LP-BP relationship. The three hypotheses add the mediating effects of SCF components (sourcing, operating systems and distribution flexibility) between IS flexibility and BP. Data on 260 companies are analyzed with EQS software. SPSS Process software is used to test the indirect impact of IS flexibility on BP through the paths of the other three SCF dimensions.
Research results show that IS flexibility’s role is paradoxical in SCF’s mediating role between LP and BP: although it does not mediate between LP-BP, its role in the indirect LP-BP effect is key as it acts on BP indirectly through the mediation of the other three SCF dimensions (sourcing, operating system and distribution flexibility).
This paradoxical effect of IS flexibility as an SCF dimension in the LP-BP relationship has been identified for the first time in this work. This study finds that IS flexibility is a fundamental factor in the SCF “eclipse effect” between LP and BP in LP contexts due to its effect on the other SCF dimensions and, indirectly through these, on BP. This IS flexibility paradox has major implications for theory and business management.
Quick value overview
Interesting because – This is the first study that identifies the IS flexibility paradox in the SCF-BP relationship in LP contexts: IS flexibility does not have a direct effect on BP in LP contexts as part of SCF but, paradoxically, it has a dominant indirect effect on BP through the other three SCF dimensions: Sourcing, Operating Systems, and Distribution flexibility. Thus, in the context of LP, IS flexibility is the most important component of SCF to obtain a multiplier effect on BP and nullifies the direct LP-BP effect (“total eclipse effect”).
Theoretical value – This research untangles the so-called supply chain IS flexibility paradox. Far from being an innocuous element in SCF, IS flexibility is concluded to exert an indirect but key effect on BP that explains the relationship between LP and BP. It also identifies the existence of a hierarchy of SCF dimensions in which IS flexibility plays an essential role by impacting the other SCF dimensions. This contribution builds on the literature initiated by Brynjolfsson (1993) by identifying IS as a powerful tool whose effect on BP is paradoxical. In addition, this study substantiates the role of Resource Orchestration Theory (ROT) in LP and SCF contexts.
Practical value – Supply chain managers will see that in LP contexts, IS are crucial resources that they must deploy in their SCs to achieve different types of flexibility and a multiplier effect on their BP. Managers must consider the logical sequence of the effect’s development: it originates from IS flexibility decisions and subsequently materializes in Operating System, Sourcing, and Distribution flexibility.
1. Introduction
The previous literature is unanimous in stating that Lean Production (LP) (Shah and Ward, 2003) has a direct and positive effect on business performance (BP) (Rahman et al., 2010; Moyano et al., 2021; Cifone and Portioli Staudacher, 2022). However, Maqueira et al. (2021) found that this is not always the case and that there is an intermediate mechanism between the two variables, namely that LP contributes to the development of Supply Chain (SC) Flexibility (SCF) and that it is SCF that impacts BP. The authors called this phenomenon the “total eclipse effect”. LP stops having a direct effect on BP in the manufacturing context, where LP implementation leads to the development of SCF.
However, SCF is a complex construct (EL-Khalil, 2018), a composite, a set of variables identified to simplify the theory. In the literature, it is mostly considered to be an agglomerate of four dimensions or variables: (1) SC Sourcing flexibility; (2) SC Operating System flexibility; (3) SC Distribution flexibility, and (4) SC Information System (IS) flexibility (Moon et al., 2012). Likewise, Maqueira et al. (2021) adopt a broader analytical approach by examining SCF at an aggregate level, so a deeper understanding is necessary to ascertain exactly which SCF component or dimension produces this “eclipse effect” and results in the much-feted relationship between LP and BP not being direct.
Minguela-Rata et al. (2024) determined that it is the development of Operating Systems flexibility that results in the LP effect on BP not being direct. What is more, Sourcing flexibility and Distribution flexibility do not stop this direct effect entirely, i.e. they do not fully capitalize on the benefit that comes from implementing LP. However, their most striking finding is that although LP triggers the development of IS flexibility, the latter has no impact on BP. So, it emerges from this study that in an LP context, IS flexibility is not required to enhance BP, and so can be done without altogether.
However, this finding by Minguela-Rata et al. (2024) would seem to be at odds with business practice. Indeed, several works have presented cases of companies with successful global SCs where IS use has resulted in a major competitive advantage developing (Ferdows et al., 2004; Harsoor et al., 2015; Aftab et al., 2018). One of these companies is Zara, the brand name of the Inditex company, which commercializes affordable designer clothes and uses IS intensively to orchestrate SCs with different agents all around the world (Ferdows et al., 2004; Aftab et al., 2018). Another example is Walmart, which uses IS to capture, store, and manage enormous volumes of data (Big Data) that allow predictive data models to make decisions to preempt changes in the environment and demand (Harsoor et al., 2015).
From the theoretical point of view, IS have been recognized as having significant repercussions for multiple business functions (Lyytinen and Rose, 2003; Besson and Rowe, 2012). Further, combined with other company resources and capabilities, IS have typically been a source of competitive advantage (Byrd, 2001; Liang et al., 2010; Mikalef and Pateli, 2017).
Given this current state of the literature, we must ask whether IS flexibility really is a negligible capability for enhancing BP in an LP context. This is the motivation behind the present work, which is underpinned by the theoretical current of the Resource Orchestration Theory (ROT) (Liu et al., 2016). ROT helps to understand the mechanisms to identify whether IS flexibility might impact BP in an LP environment not directly, but indirectly via the other analyzed SCF dimensions (Operating Systems, Distribution, and Sourcing flexibility). This would prompt a reevaluation of IS Flexibility’s relevance in an LP environment as a key variable for achieving better outcomes, as, according to the literature, its impact on results is controversial. In this sense, the work by Aissa-Fantazy et al. (2009) is noteworthy for having found that IS flexibility can have both a positive and a negative effect on performance depending on the indicator used: although IS flexibility impacts net profit performance, lead time performance, and sales growth performance negatively, at the same time it improves customer satisfaction.
Given all the above, we have determined to take up the mantle of future research suggested by Minguela-Rata et al. (2024). Building on these authors’ results and prior findings, we dig deeper into this line of research by exploring the indirect relationship that IS flexibility has with BP through its effect on the other three SC flexibility dimensions. Thus, the research question of this paper is: What role does IS flexibility play in the LP-SCF-BP relationship, i.e. in SCF’s “total eclipse” effect between LP and BP?
This study seeks to examine the IS flexibility paradox in the SCF connection between LP and BP. A paradox is a statement, proposition, or situation that seems contradictory or senseless but, in reality, may be true or have a valid explanation. As stated by the seminal literature on IS’ paradoxical role in performance (Brynjolfsson, 1993), paradoxes often challenge the understanding of reality and provoke deeper reflection on the nature of truth, existence, and the limits of human understanding.
Although Lean SC strategy has broader implications than LP at the external level (Moyano-Fuentes et al., 2021), and despite the existence of other closely related SC strategies (Shahin and Rezaei, 2018) such as Agile SC (Shahin and Jaberi, 2011) and Leagile SC (Naylor et al., 1999), this paper focuses on focal companies applying LP in an intermediate position in the SC, which has implications for both external efficiency and internal efficiency via the SC (Kumar et al., 2015; Shahin et al., 2016). This position affords focal firm SC managers a broad view upstream and downstream of the SC.
This paper has been organized as follows. The section following this introduction delves into the theoretical background. The third section outlines the reasoning behind the formulation of the hypotheses. The fourth section presents the methodology and the fifth section analyzes the results. The sixth section includes a discussion of the outcomes with implications for theory and practice. The last section provides the main conclusions, limitations, and directions for future exploration.
2. Theoretical background
2.1 Resource orchestration theory
Resource Orchestration Theory (ROT) (Liu et al., 2016) highlights the pivotal role of managers as “coordinators of resources” who discern resources, combine them in clusters, and exploit them to develop new strengths that are then utilized to enable their firm to dominate the market (Ellram et al., 2013). The orchestration and synchronization of these resources and capabilities is even more difficult to replicate than the resources and capabilities themselves (Wowak et al., 2016). This conceptual approach has recently been applied to SCF (Minguela-Rata et al., 2024).
ROT helps to understand how the way that resources and capabilities are deployed and especially how they are aligned leads to higher performance (Liu et al., 2016). As the SC orchestrators, focal firms SC managers can manage resources and trigger alignment.
2.2 Supply chain flexibility’s “total eclipse” effect between lean production and business performance
Maqueira et al. (2021) were the first to identify the SCF “total eclipse” of LP-BP (see Figure 1). These researchers explained it as companies initially implementing LP to improve both their operating and financial results and the resulting success leading to LP practices being extended to SC in the manufacturing context, where they generated flexibility. SCF’s impact on BP was then so powerful that it overshadowed the LP-BP effect. Thus, the SCF-BP effect predominated and boosted BP significantly (Maqueira et al., 2021) (see Figure 1).
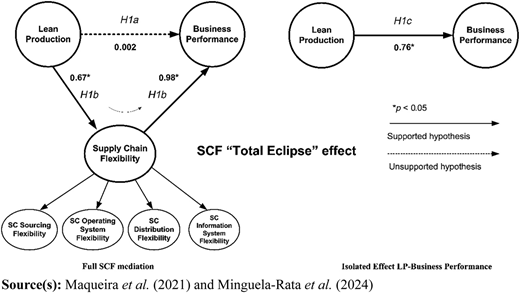
Theoretical background. SCF total mediation between lean production and business performance; SCF “total eclipse” effect
Theoretical background. SCF total mediation between lean production and business performance; SCF “total eclipse” effect
Minguela-Rata et al. (2024) further investigated the SCF “total eclipse” effect in an analysis of the role of each of the SCF dimensions and concluded that using IS, on their own, does not have a direct effect on results (Minguela-Rata et al., 2024). A priori, the Minguela-Rata et al. (2024) findings relegated IS flexibility to a less important role in SCF as a tool for achieving better results in LP contexts (Figure 1).
However, many researchers argue that IS play a major role in SCF and improving BP (Wang and Wei, 2007; Jin et al., 2014; Han et al., 2017; Tsai and Lasminar, 2021; Enrique et al., 2022a, b). For example, Wang and Wei (2007) found that Information Technology (IT) enables inter-organizational governance (relational governance and virtual integration) and has both direct and indirect effects on SCF (through information visibility). Jin et al. (2014) investigated whether IT develops certain capabilities which indirectly impact BP. Their results showed that IT-enabled sharing capability is associated with flexibilities in a manufacturer’s SC, which are, in turn, associated with the firm’s competitive performance. Tsai and Lasminar (2021) found that flexibility is a mediating variable between SC information integration and performance. Enrique et al. (2022b) showed that smart SC is statistically associated with operational performance through the mediating role of the three other SCF dimensions (sourcing, delivery, and manufacturing). Environments with high customer uncertainty were found to increase their adoption of base technologies (such as the Internet of Things, Cloud Computing, Big Data, Artificial Intelligence, and Blockchain) to enhance delivery flexibility and support manufacturing flexibility. In situations of high supplier uncertainty, companies employ front-end technologies (such as robotics, 3D printing, simulation, and augmented reality) to boost sourcing flexibility. In addition, Aissa-Fantazy et al. (2009) found that IS flexibility could have both positive and negative effects on performance, depending on the performance indicator considered.
This literature shows the need to further investigate the role of IS flexibility, as called for by Minguela-Rata et al. (2024) in future research.
3. Research hypotheses
Our starting point (baseline model) is the Minguela-Rata et al. (2024) finding that IS flexibility has no mediating effect in the LP-BP relationship (H0a, H0b, H0c, see Figure 2). Based on these authors and the previous literature (Jin, 2006; Aissa-Fantazy et al., 2009; Mikalef and Pateli, 2017), the true effect of IS on BP appears to lie in its combination with other human and organizational resources. Therefore, we intend to analyze the role of IS flexibility in SCF’s “total eclipse” effect on LP-BP.
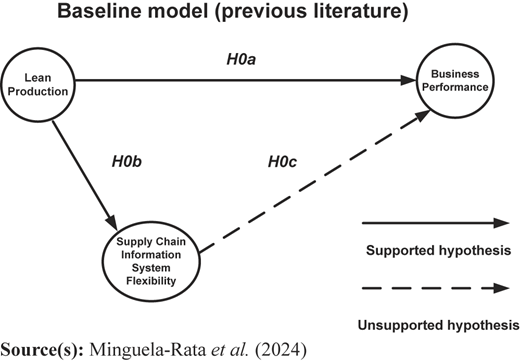
Theoretical background. IS flexibility no mediating effect between LP and BP. Baseline model
Theoretical background. IS flexibility no mediating effect between LP and BP. Baseline model
3.1 The indirect mediating effect of information system flexibility between lean production and business performance through supply chain sourcing flexibility
To be able to adequately respond to consumer needs in highly variable environments, companies must have flexible SCs that can quickly adapt to variations in demand (Moon et al., 2012). Variations can lead to disruptions in the production process flow (Sreedevi and Saranga, 2017), due, among other reasons, to current suppliers not having the required capacity to react to changes. This could lead to non-delivery (Liao et al., 2010) and a negative impact on business results. Therefore, these authors and others (Liao et al., 2010; Sreedevi and Saranga, 2017) highlight the importance of selecting, developing, and creating strategic alliances with suppliers for achieving long-term competitive advantage. They also conclude that if current suppliers do not have the required capabilities to respond to changes and environmental uncertainty, and the focal firm cannot take actions to develop its current suppliers as envisioned in LP environments, the focal firm should seek SCF by reconfiguring its supplier base (Liao et al., 2010).
According to prior research, the SC coordinator should constantly reconfigure the SC by recognizing, selecting, assessing, incorporating, and substituting suppliers whenever necessary to be able to adapt to market requirements (Moon et al., 2012, among others). As Minguela-Rata et al. (2024) state, in LP manufacturing environments, this might include the need to expand the provider base or even have multiple flexible supplier bases that offer alternative sources of supply to give the SC greater flexibility (Sreedevi and Saranga, 2017; Enrique et al., 2022a, b). Flexible contracts and collaborative relationships with suppliers are indispensable in highly uncertain environments (Liao et al., 2010; Sreedevi and Saranga, 2017) as they drive up the company’s capability to respond to changing materials needs (Sreedevi and Saranga, 2017).
Organizations must design and implement IS that enable them to manage and coordinate such a broad base of flexible suppliers (So and Su, 2010; Soon and Udin, 2010), which is critical in LP environments. IS enable a supplier integration strategy with information sharing, e-business systems, policy-based supplier selection, and procurement flexibility (Zhang et al., 2006; Wang and Wei, 2007; So and Su, 2010; Moon et al., 2012). A supplier integration strategy is essential for implementing LP practices such as Just In Time (JIT) work systems (Cua et al., 2001; Soon and Udin, 2011). So, IS allow focal companies to quickly switch suppliers to synchronize production and reduce delivery times whenever required, and thus to respond quickly to changes in demand and achieve procurement flexibility (Moon et al., 2012; Frank et al., 2019). The focal company will be able to maintain optimal storage levels and guarantee the required component flow to support daily activities thanks to real-time information sharing with suppliers (Zhang et al., 2006; Moon et al., 2012). Further, the procurement flexibility achieved with IS will positively impact BP (Tsai and Lasminar, 2021; Enrique et al., 2022b).
Therefore, in LP contexts, firms should implement IS as they provide flexibility and are capable of sharing relevant information. They also enable real-time communication with other SC members and decision-making on suppliers and procurement, adaptation to changes in demand (achieving flexibility), and better results (Liao et al., 2010; Setia and Patel, 2013; Han et al., 2017).
ROT supports these arguments. ROT states that it is essential to find the best possible grouping of resources and capabilities (Liao et al., 2010; Han et al., 2017), and that it is the SC focal firm manager’s responsibility to identify the required resources in the company network and combine, coordinate, and synchronize them (Liu et al., 2016). Therefore, as ROT maintain, when need be, the focal company must use flexible IS to identify, group, combine, and coordinate/orchestrate (Wowak et al., 2016) specific resources and capabilities and with IS develop new capabilities that would make imitation by competitors extremely difficult (Liu et al., 2016). So, IS and the new capabilities that they develop constitute a strategic tool that enables firms to compete and obtain better results.
Based on all these arguments, an indirect effect of IS flexibility on BP should be expected to exist via SC Sourcing flexibility, leading to the following hypothesis:
In Lean Production and Supply Chain flexibility contexts, supply chain Sourcing flexibility has a mediating effect between Information System flexibility and Business Performance.
3.2 The indirect mediating effect of information system flexibility between lean production and business performance through supply chain operating system flexibility
Although production technologies have been extensively related to SC Operating System flexibility (Enrique et al., 2022a), to the best of the authors’ knowledge, IS in the SC have not previously been studied as potential enablers of SC Operating System flexibility. However, given that IS flexibility should help connect and integrate machines, materials, SC members, SC activities, and SC flow information (Bueno et al., 2020), it should also be expected to improve integration, collaboration, general operations, and the responsiveness of the various manufacturing and SC operations processes. In this sense, Enrique et al. (2022a) reported several case studies that describe how IS flexibility reduces setup times when changes are needed and enables more options to be included in the production line. Previously, Jin et al. (2014) demonstrated that IT-enabled sharing capability (a construct very closely related to IS flexibility) is linked to different SCF components that positively impact BP individually (Gosling et al., 2010; Moon et al., 2012).
The development of IS flexibility in LP contexts is typically based on the use of, for example, an electronic Kanban system connected to an ERP system. This allows ERP to feedback to itself while the routes are being defined and to notify how much material is lacking at any specific workstation (Enrique et al., 2022a). This ensures machine, labor, materials, and process routing flexibilities, which are key elements of SC Operating System flexibility (Moon et al., 2012). Alternatively, IT infrastructure that enables JIT inventory management practices would similarly result in greater Operating System flexibility as it enables the focal firm to monitor the supplier’s work in progress before placing the order. This information would forewarn whether the supplier’s delivery date is likely to be put back, which would either slow down production or require an order to be placed with another supplier to fulfill stipulated delivery dates (Jin et al., 2014). IT also facilitates SCF operations that enable the supplier to manage inventories (Vendor Management Inventory, VMI) and maintain them at optimal volumes to respond to demand requirements at all times (Sainathan and Groenevelt, 2019). In short, IS flexibility enables firms to monitor changes in the environment more quickly and to react to them by adapting their SC operations more efficiently and effectively (Fawcett et al., 1996; Jin et al., 2014) through coordination and simplified process management (Han et al., 2017). All this allows firms to develop more customized solutions to satisfy customer demands and drive up performance.
Frank et al. (2019) stated that simply using technology in the SC does not guarantee the flexibility of SC operations but that this depends on how the focal firm uses product, component, machine, and materials identification and traceability, and technology-enabled real-time operations data in collaboration with its SC partners for faster decision-making. These new routines and processes are especially important for achieving Operations System flexibility (Dalenogare et al., 2018). Along the same line, Fawcett et al. (2011) emphasize the importance of SC members combining their infrastructure, communicating with each other, being open, and collaborating, which is not easily replicable. In addition, this is also particularly relationship-specific (Jin et al., 2014). These findings are consistent with ROT, which states that this depends on the specific combination of IT, collaboration and cooperation practices, and data and process-sharing, which means that none of these SC elements in isolation can potentially impact on the business results. Integrating hardware and software components with SC partners, developing IS flexibility based on this and the more complete information compiled by the focal firm, and making decisions to develop new production routes, module changes, workstations, etc., that provide the firm with SC Operation Systems flexibility together constitute a specific combination of focal firm practices, resources, and capabilities and an especially valuable source of competitive advantage creation.
The following hypothesis is formulated based on the above arguments:
In Lean Production and Supply Chain flexibility contexts, Operating System flexibility in the supply chain has a mediating effect between Information System flexibility and Business Performance.
3.3 The indirect mediating effect of information system flexibility between lean production and business performance through supply chain distribution flexibility
Several conditions must be met for SCs to provide companies with a sustainable competitive advantage: they should react speedily to sudden changes in demand or supply; they should adapt over time as market structures and strategies evolve, and they should be transparent in aligning the interests of all the firms in the supply network to allow companies to optimize chain performance when they maximize their own interests (Lee, 2004; Lee and Tang, 2018). Safety stock must be held closer to the markets and a better distribution capability constructed to achieve these conditions and address environmental variability (Lee, 2004). Said objectives can be met through distribution flexibility associated with the ability to adapt to international standards, address varying customer demands, adapt storage facilities, change transport methods, and incorporate product postponements (Moon et al., 2012; Shahin et al., 2018). This aspect of SCF has a significant effect on customers, requiring joint efforts between SC members in logistics sharing. Therefore, distribution flexibility is observed to facilitate the management of goods and data flows and to ensure that delivery schedules align with customer requests. In this sense, IS are a fundamental component for controlling materials and information flows (Srinivasan and Swink, 2018).
For the SC to provide a competitive advantage, IS also need to be flexible in providing capabilities for information processing, information sharing, visibility, and thinking “globally” rather than as separate actors (Zhang et al., 2005; Jin et al., 2014; Srinivasan and Swink, 2018). Likewise, recent literature underlines IS’ importance for supporting SC planning and risk reduction with real-time monitoring, e.g. for capacity and inventory overviews, and the essential role of digital information sharing in using flexibility in SC risk management (Ivanov et al., 2019; Doetzer and Pflaum, 2021).
However, Barrat and Oke (2007) argue that competitive advantage stems from the way that technologies and IS are exploited rather than from technologies and IS themselves. There is also evidence in the literature that there are other mediating factors between IS and competitive advantage (Han et al., 2017; Cao et al., 2019). In this sense, Cao et al. (2019) state that some processes related to effective decision-making play a mediating role between IT-related capabilities and competitive advantage. Similarly, Han et al. (2017) find that process integration capability plays a mediating role in the relationship between IT flexibility for efficient information-sharing and process improvement and firm performance.
In LP contexts, SC Distribution flexibility mediates between LP and BP (Minguela-Rata et al., 2024). Specifically, the previous literature indicates the importance of integrating distribution- and delivery-related processes for improving operational performance (Giménez and Ventura, 2005; Fawcett et al., 2007). For this, it is essential to achieve real-time transmission and processing of information required for SC decision-making, which could result in lower costs through reductions in inventories and shortages. However, changes to the distribution system are also required through the application of Vendor-Managed Inventory (VMI) programs, lead time reductions (Nabhani et al., 2009), and more frequent deliveries (Danese, 2006; Claasen et al., 2008). As such, IS can be considered an antecedent of Distribution flexibility (Gimenez and Ventura, 2005; Claasen et al., 2008).
Dolgui et al. (2018) found that flexible and adjustable logistics can mitigate the ripple effect and improve operational results. Similarly, the previous literature underlines the need for logistical flexibility, and the ability of a logistics network to replenish the stock base in real time can rely on flexible decision-making to enable better operational results, provide better customer service, and address uncertainties (Barad and Even Sapir, 2003; Zhang et al., 2005; Naim et al., 2006). In the same vein, Amorim-Lopes et al. (2021) state the importance of analyzing and experimenting with distribution warehouse layouts and storage assignment policies to improve picking performance. IS can resolve both the fastest delivery modes and changes to delivery schedules by increasing Distribution flexibility and, consequently, indirectly impacting the focal firm’s BP (Zhang et al., 2005; Naim et al., 2006; Dolgui et al., 2018).
According to ROT (Liu et al., 2016), SC focal firm managers can combine and integrate capabilities derived from SC flexibility distribution to generate new capabilities that impact the improved performance that comes from the use of flexible IS.
Considering all the above, IS flexibility is likely to have an indirect effect on BP via SC distribution flexibility. This allows the formulation of the following hypothesis:
In Lean Production and Supply Chain Flexibility contexts, Distribution flexibility in the supply chain has a mediation effect between Information System flexibility and Business Performance.
Figure 3 shows the conceptual model with the individual mediating effects of the SCF dimensions between IS flexibility and BP in LP contexts (Models 1, 2, and 3).
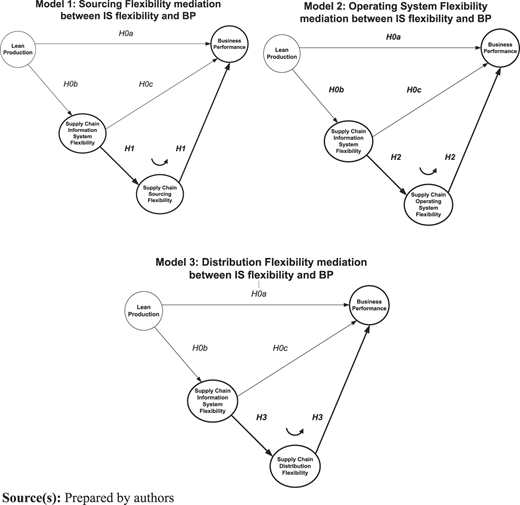
Theoretical, hypothesized models: Models 1, 2, and 3, mediation effects between IS flexibility and BP of other supply chain flexibility components
Theoretical, hypothesized models: Models 1, 2, and 3, mediation effects between IS flexibility and BP of other supply chain flexibility components
4. Method
4.1 Sample and data collection
The present empirical study uses the same database as Minguela-Rata et al. (2024), as we pick up the baton that they proffered to carry out new research that would allow a comparison of results.
A population of 1,717 companies was selected from the Iberian Balance Sheet Analysis System (SABI) database to test the research hypotheses. The selection process followed some specific inclusion criteria, focusing on Spanish firms with over 50 employees operating in intermediate positions in the SC. Companies located near end customers or raw material sources were excluded, as were industries or sectors strictly linked to extractive activities or raw material transformation (according to the National Classification of Economic Activities) (Minguela-Rata et al., 2024).
The survey was designed for a single respondent, with the organization serving as the unit of analysis. In line with Brusset’s (2016) approach, the present research adopts an embedded design, considering the organization as “part of a network of relationships that influence its performance” (Saraf et al., 2007, p. 327). While a multiple-respondent, dyadic, or even triadic survey design might have been ideal, a single-respondent approach was chosen to ensure an acceptable response rate (Saraf et al., 2007). Following Brandon-Jones et al. (2014), supply managers were selected as key respondents as they are considered “to be the most knowledgeable about manufacturing plant supply chains and our related subjects of interest: supply chain strategy, practices, resilience, and robustness, and the performance of manufacturing plants”. This choice aligns with recent methodologies for studying inter-organizational phenomena (Flynn et al., 2020; Tang and Tang, 2010). Although the subjective nature of the data is a limitation, the use of subjective data is common in this research field and is widely deemed acceptable (Chan et al., 1997).
Data were collected through telephone surveys using the Computer-Aided Telephone Interviewing (CATI) method, a widely employed means in supply chain (SC) research. As a result, a final sample of 260 companies was obtained, representing a 15.1% response rate.
Table 1 shows the sample distribution.
Sample, population distribution, and response rate by industry
| Sector | No. of companies in population | No. of companies in sample | Response rate | ||
|---|---|---|---|---|---|
| Beverages | 89 | 5.2% | 13 | 5.0% | 14.6% |
| Chemicals | 251 | 14.6% | 41 | 15.8% | 16.3% |
| Electrical machinery and equipment | 97 | 5.7% | 11 | 4.2% | 11.3% |
| Fabrics and textile | 86 | 5.0% | 11 | 4.2% | 12.8% |
| Food products | 629 | 36.6% | 108 | 41.5% | 17.2% |
| Furniture | 115 | 6.7% | 7 | 2.7% | 6.1% |
| Informatics, electronics, and optical | 91 | 5.3% | 13 | 5.0% | 14.3% |
| Leather and shoes | 75 | 4.4% | 8 | 3.1% | 10.7% |
| Motor vehicles | 192 | 11.2% | 32 | 12.3% | 16.7% |
| Pharmaceuticals | 85 | 5.0% | 15 | 5.8% | 17.6% |
| Tobacco and related products | 7 | 0.4% | 1 | 0.4% | 14.6% |
| Total | 1717 | 100% | 260 | 100% | 15.1% |
Source(s): Minguela-Rata et al. (2024)
4.2 Variables
As mentioned above, this study uses the same variables and operationalization as Minguela-Rata et al. (2024) to dig deeper into their findings and be able to compare results. The variables considered are: (1) Lean production (Lean applied in the manufacturing area); (2) SC flexibility dimensions: SC Sourcing flexibility; SC Operating System flexibility; SC Distribution flexibility, and SC Information System flexibility, and (3) Business performance (combined financial and operational results). The measures for each variable were taken from the previous literature (see sources in Minguela-Rata et al., 2024). Table 2 shows variables in the present research context.
Factors and variables
| Second-order factor | First-order factor | Variable description | Item code |
|---|---|---|---|
| Lean Production implementation | Cellular Manufacturing | Location of machines and nearby processes in plant | LP1 |
| Manufacturing cells | LP2 | ||
| Layout | LP3 | ||
| Lean practices | Total Quality Management (TQM) | LP4 | |
| Single Minute Exchange Due (SMED) | LP5 | ||
| Total Productive Maintenance (TPM) | LP6 | ||
| Just In Time (JIT) * Kanban systems | LP7* LP8 | ||
| Supply Chain Flexibility (In this research context, it used only the four dimensions) | Supply Chain Sourcing Flexibility | Major suppliers * | SCF1* |
| Swap in and swap out suppliers | SCF2 | ||
| Change suppliers to address changing requirements | SCF3 | ||
| Supply Chain Operating System Flexibility | Develop new products or services * | SCF4* | |
| Change output volumes | SCF5 | ||
| Change the product and service mix * | SCF6* | ||
| Adjust manufacturing facilities and processes | SCF7 | ||
| Supply Chain Delivery Flexibility | Swap in and swap out carriers or other distributors | SCF8 | |
| Change warehouse space, loading capacity, and other distribution facilities | SCF9 | ||
| Change delivery modes | SCF10 | ||
| Transfer delivery schedules | SCF11 | ||
| Supply Chain Information System Flexibility | Information Systems to support transportation and distribution management * | SCF12* | |
| Information Systems to support firm inventory management | SCF13 | ||
| Information Systems to support multiple functions and departments | SCF14 | ||
| Business Performance | Operational performance | Quickly modify products | OP1 |
| Quickly launch new products onto the market | OP2 | ||
| Quickly respond to changes in market demand | OP3 | ||
| Quickly modify products to respond to our major competitors’ innovations | OP4 | ||
| On-time delivery record to major customers | OP5 | ||
| Short lead time for fulfilling customers’ orders (the time that elapses between the receipt of a customer’s order and the delivery of the goods) | OP6 | ||
| High level of service to major customers | OP7 | ||
| Financial Performance | Growth in Sales | FP1 | |
| Return on Sales | FP2 | ||
| Growth in Return on Sales | FP3 | ||
| Growth in Profit | FP4 | ||
| Growth in Market Share * | FP5* | ||
| Growth in Return on Investment (ROI) | FP6 |
Note(s): * Items removed after exploratory and reliability analyses (item code in italics)
Source(s): Minguela-Rata et al. (2024)
4.3 Data analysis strategy: CB-SEM
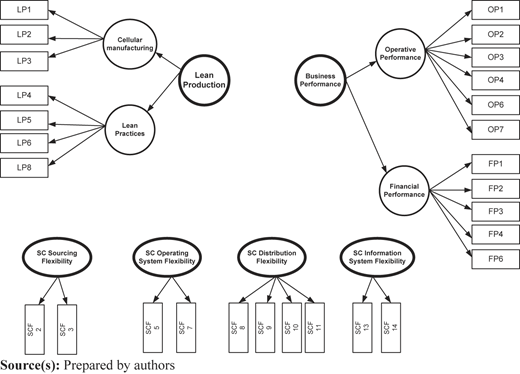
The measurement model for each of the factors in this research was constructed using the variables indicated in the preceding section (Schumacker and Lomax, 1996) (see Figure 4). Our use of the CB-SEM technique is justified by the following. It is a particularly useful technique for hypothesis testing as it analyzes variables and establishes relationships between them. It is an updated multivariate statistical model that combines multiple regression, factor analysis, and covariance analysis to estimate relationships between multiple variables (Kline, 2005). Its incorporation of measurement error effects allows associative relationships between variables to be evaluated (Kaplan, 2000). It improves on other multivariate techniques such as regression analysis by considering the analysis of variable covariance (Kaplan, 2000; Kline, 2005) and has been preferred over variance-based SEM (e.g. Partial Least Squares – PLS) as the purpose of this research is theory testing and confirmation rather than theory development (Dash and Paul, 2021). CB-SEM has been used in previous studies whose findings are explored here (Maqueira et al., 2021; Minguela-Rata et al., 2024). Three structural models are tested separately in this research (see Figure 5).
5. Analysis and results
5.1 Measurement model
As it builds on the findings of previous work, the measurement model has been taken from Minguela-Rata et al. (2024). Construct content validity, Exploratory Factor Analysis (EFA), Confirmatory Factor Analysis (CFA), convergent construct validity, and discriminant construct validity have been tested in the previous literature (see Minguela-Rata et al., 2024). EFA and CFA measurement model data analysis is available in Appendix.
5.2 Structural models
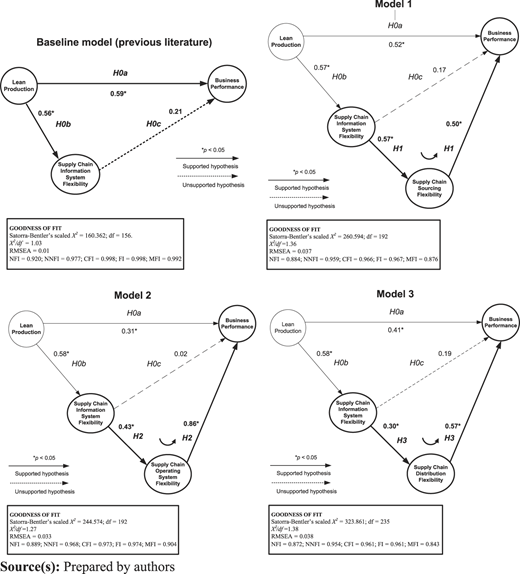
The Robust Maximum Likelihood Method and SEM (EQS 6.4 software) (Bentler, 1995) were considered to be the best techniques for non-normal settings. Figure 5 shows the results for Structural Models 1, 2, and 3. Goodness of fit was adequate in all cases (see Figure 5).
The results obtained for hypotheses proposed in the previous literature (H0a, H0b, and H0c) are the same in all 3 analyzed models (Models 1, 2, and 3) (see Figure 5). The CB-SEM analysis confirms that a significant direct connection exists between LP and BP (H0a) and LP and IS flexibility (H0b) in all 3 models and that no direct significant relationship exists between IS flexibility and BP (H0c rejected). Therefore, no IS flexibility mediating effect exists in the LP-BP relationship. However, the following variables are found to mediate the IS flexibility-BP relationship in LP contexts: Sourcing flexibility (Model 1; with empirical support for H1); Operating System flexibility (Model 2; with empirical support for H2), and Distribution flexibility (Model 3; with empirical support for H3) (see Figure 5).
Table 3 gives the CB-SEM analysis results of the mediation hypotheses in Models 1, 2, and 3.
Results of hypothesis testing with CB-SEM
| Hypothesis | Path | Result / Support | ||
|---|---|---|---|---|
| Baseline model (previous literature): isolated effect of IS Flexibility between LP-BP | ||||
| H0a | LP → BP | ✔ | ||
| H0b | LP → SCF Information System | ✔ | No mediating effects | |
| H0c | SCF Information System → BP | X | ||
| Mediation between IS Flexibility and BP; Models 1, 2, and 3 | ||||
| H1 | SCF Information System → SCF Sourcing → BP (Model 2) | ✔ | Mediating effects | |
| H2 | SCF Information System → SCF Operating System → BP (Model 3) | ✔ | ||
| H3 | SCF Information System → SCF Distribution → BP (Model 4) | ✔ | ||
Note(s): ✔Supported; X Unsupported
Source(s): The authors
5.3 Analysis of type of mediation
IBM-SPSS PROCESS macro (v.4.0) was used to test the mediating effects in Models 1, 2, and 3 with the Preacher and Hayes (2008) procedure. The bootstrapping method with 10,000 resamples and 95% bias-corrected confidence intervals (CIs) was applied for the mediation analysis. The mediating effect is significant when zero is absent from both the lower and upper levels of a confidence interval (Hayes, 2013).
Support was given to hypotheses H1, H2, and H3 in IBM-SPSS PROCESS analyses of Models 1, 2, and 3 (see results in Table 4). This confirmed that in LP contexts, IS flexibility has an indirect impact on BP via SC Sourcing flexibility (Model 1; H1) with partial mediation, and via SC Operating System flexibility (Model 2; H2) and Distribution flexibility (Model 3; H3) with total mediation.
Analysis of mediating effects; IBM-SPSS PROCESS
| Model | IV | MV | DV | Effect of IV on MV | Effect of MV on DV | Direct effect | Indirect effect | Total effects | 95% CI for mean indirect effect | Mediation type | Hypothesis support |
|---|---|---|---|---|---|---|---|---|---|---|---|
| Isolated effect of IS flexibility between LP-BP (Baseline model, previous literature) | |||||||||||
| 1 | LP → | SCF Information System → | BP | 0.474* | – | 0.180* | – | 0.180* | – | No mediating effect | H0a ✔ H0b ✔ H0c X |
| Mediation of SCF dimensions between SC IS flexibility – BP (Models 1, 2, and 3) | |||||||||||
| 2 | SCF Information System → | SCF Sourcing→ | BP | 0.849* | 0.446* | 0.214 | 0.379* | 0.593* | 0.207 0.551 | Partial | H1 ✔ |
| 3 | SCF Information System → | SCF Operating System→ | BP | 0.885* | 0.619* | – | 0.548* | 0.548* | 0.356 0.728 | Total | H2 ✔ |
| 4 | SCF Information System → | SCF Distribution→ | BP | 0.880* | 0.560* | – | 0.560* | 0.560* | 0.302 0.675 | Total | H3 ✔ |
Note(s): IV = independent variable; MV = mediating variable; DV = dependent variable; CI = confidence interval; *Significant p < 0.05; ✔ Supported; X Unsupported
Source(s): The authors
6. Discussion
This paper addresses the relationships underpinned by the elements of flexibility that influence the SC. The closest precedent to this research is the work by Minguela-Rata et al. (2024), which revealed that the LP-BP relationship was mediated by the influence of various types of SCF. However, an unsupported relationship was identified in the aforementioned research that connects LP and BP with IS flexibility as a mediating factor in the SC. Taking up the above authors’ call for future research, the analyses in this paper have detected a paradoxical IS flexibility effect on BP in LP environments. This research has revealed that, far from being a spurious variable, IS flexibility exerts the strongest mediating effect of LP on BP, albeit through a route unexplored to date. A mediating effect has been confirmed to connect the main LP variables with BP via this route and identified for the first time in this study. This mediating effect takes the form of a primary link with IS flexibility (LP-IS flexibility) and a secondary link between IS flexibility and each of the three considered SCF dimensions: Sourcing, Operating System, and Distribution flexibility, to eventually impact BP.
This phenomenon is called the Supply Chain IS flexibility paradox of the LP-BP connection and is an analogous effect to the main effect of the IT paradox identified in the late 1980s, which pointed to the existence of null effects of IT or IS implementation on financial performance under certain circumstances (Brynjolfsson, 1993). This latter effect was explained in later decades by justifying the main relationship using secondary ways such as those explored in this study. The first link in the IS flexibility paradox of the LP→BP relationship is identified and analyzed in Minguela-Rata et al. (2024). Therefore, the present work uses the same database to perform an in-depth analysis of the secondary mechanisms explained by the dual mediation between LP and BP. Thus, this paper provides further explanation of the so-called “total eclipse” effect in which, initially, IS flexibility does not have a significant influence on the main LP→BP relationship.
Our analysis confirms that the IS flexibility dimension is the most crucial component in the SCF context as it is capable of exerting a mediating effect on the other three SCF dimensions. According to study results, this dimension accounts for the further stable effect on Sourcing flexibility, Operating System flexibility, and Distribution System flexibility contributing to the “total eclipse” effect identified by Maqueira et al. (2021).
This study has several implications for both the IS literature and the literature on the effects of SCF on BP. Additionally, it has practical implications for managers responsible for IS in general, and for IS applications to SCF, especially. These theoretical and practical implications are discussed in the following subsections.
6.1 Theoretical implications
This paper extends a line of research first developed by Moyano-Fuentes et al. (2012) that considers LP and IS to be interdependent and complementary factors capable of providing mutual support to improve business results. According to Minguela-Rata et al. (2024), one of the main research gaps in the previous literature centers on explaining the paradox of the apparent lack of an SCF effect in LP contexts. Building on the most direct precedent (Minguela-Rata et al., 2024), the main theoretical contribution of this research provides an answer to the so-called SC-IS flexibility paradox. Far from being an innocuous element, IS flexibility is concluded to exert an indirect, but key effect that explains the relationship between LP and BP. For the first time in the literature, our results identify the existence of a hierarchy of SCF dimensions in which IS flexibility plays an essential role by impacting the other SCF dimensions. In addition, although the literature posits that SCF is composed of four dimensions, in LP contexts, IS flexibility’s effect on BP overshadows the effects of the other dimensions (Sourcing flexibility, Operating System flexibility, and Distribution flexibility), on which it has a multiplying effect. Thus, this contribution joins the existing literature initiated by Brynjolfsson (1993) in identifying IS as a powerful tool whose effect on BP is paradoxical in that, although it does not have a direct effect on BP, it does affect it indirectly through its effects on other complementary resources or capabilities. These findings align with other works such as the studies by Powell and Dent-Micallef (1997) and Mikalef and Pateli (2017), which found that IS’ impact on developing competitive advantage is not direct but occurs through other firm resources and capabilities. This work also supports other recent research in emphasizing IS’ significant role in developing SCF and, consequently, competitive advantage (Wang and Wei, 2007; Jin et al., 2014; Gunasekaran et al., 2017; Enrique et al., 2022a, b).
Furthermore, these results confirm the principles of the theoretical frameworks. ROT envisages that manufacturing focal firm managers can play the role of orchestra conductors capable of identifying, assembling, coordinating, and leveraging resources (of their own and other SC actors) to create or enhance other resources or capabilities. Thus, this research suggests that managers can introduce specific policies to implement sufficiently flexible IS to leverage the effects of other, possibly pre-existing resources, including other types of flexibility such as SC distribution, SC operating system, and SC sourcing. In this case, ROT provide a coherent theoretical framework that effectively explains the role of focal manufacturing firm managers in implementing complex interrelationships between the dynamic resources identified in this research at the SC level. Our study results join the existing literature supported by ROT as a fundamental explanatory theory that highlights SC managers’ active role in identifying, combining, and deploying resources in which IS play a leading role (Liang et al., 2010).
So, IS flexibility has been demonstrated to require a complex fit with the other types of flexibility in the SC, as it is IS flexibility’s initial effect that triggers the intermediation of the other types of flexibility in the LP/BP connection. Therefore, in line with previous work (Enrique et al., 2022a, b), IS are shown to be a very important tool for groups of companies to achieve SCF.
6.2 Managerial implications
This paper also has specific implications for business management and managers’ daily practice. In this sense, in LP contexts, IS flexibility is a primary resource that must be deployed in SC to leverage the other types of flexibility in the chain and obtain a multiplier effect on BP. Managers can now see that there is a hierarchy of SCF dimensions. The results of this work show that (1): IS flexibility is the most important dimension in this hierarchy followed by operating system flexibility and, lastly, supply flexibility and distribution flexibility, and (2) LP needs to be complemented with investments that translate into an increase in IS flexibility in SC for it to become a competitive weapon.
This paper is the first to shed light on the action path of IS flexibility’s effect on the other types of SCF. This path indicates that the most flexible IS are those capable of having a greater positive effect on the other “hard” and “soft” SCF elements (Operating System flexibility, Sourcing flexibility, and Distribution flexibility). Therefore, focal firm managers have the crucial responsibility of ensuring that IS are fitted into the SC in such a way as to create positive synergies with the other supply systems and the operational configuration of the SC itself. In many cases, decisions on IS are delegated to the IT department without considering the possible systemic implications of one configuration or another. However, as this research reveals, the decision on the configuration of IS flexibility has proven implications for the other flexibility elements in the chain and is capable of triggering a set of positive effects that ultimately generate higher BP.
Therefore, the main conclusion is that SC managers, in particular, and the organization’s management, in general, must know what implications IS design has for the SC. It is essential to choose the system option that offers the greatest guarantee of flexibility as this is the only way that synergies can be achieved with the other types of SC flexibility. So, flexible IS configuration should be integrated into the strategic decision-making process when designing the SC and the type of IS that supports it. Additionally, managers must consider the logical sequence of the effect’s development: that it originates from IS flexibility decisions and subsequently materializes, first, in Operating System flexibility, and then in Sourcing flexibility and Distribution flexibility. The flexibility decisions on the other three aspects of SC flexibility must be subordinated to IS flexibility design for IS design to have the expected positive effects on them.
7. Conclusions
This research identifies the paradoxical impact of IS on BP in LP environments. Despite no direct effect of IS on BP having been observed previously, IS’ role in developing SCF is significant. IS flexibility plays a primary role in LP settings, where it has an indirect effect on BP through the other three SCF dimensions. This research makes some relevant contributions to theory and practice. To the best of the authors’ knowledge, this is the first research that identifies the IS flexibility paradox in the SCF-BP relationship in LP contexts. In addition, senior managers will discover that, in LP contexts, IS are a crucial resource that they must deploy in their SCs to achieve different types of flexibility and obtain a multiplying effect on their BP.
7.1 Limitations and future research directions
This paper has several limitations that also represent some possible directions for future research. First, the present work is cross-sectional. A longitudinal design that analyzes the sequence of effects between LP, IS flexibility, and the rest of the SCF would be very helpful for confirming the causal relationships that can be inferred from the hypotheses. However, this would require dynamic monitoring of the relationships specified in this paper’s proposed hypotheses. The value of managerial decisions on the flexibility dimensions in the chain could be studied specifically, either by accompanying the cross-sectional study with case studies or qualitative studies that examine the influence of the form and timing of decision-making on the real effects on flexibility and business performance. Second, a further, albeit minor limitation is related to the four types of SC flexibility considered in the present work. Future research could analyze the effects of other types of SCF, such as the Product Development-BP relationship. Additionally, future works could focus on proposing a novel measure of SCF that takes into account the hierarchy of dimensions identified in this work by, for example, adding items associated with IT use to each of the other three SCF dimensions or modeling SCF in such a way as to make IS flexibility an antecedent of all the other dimensions. Third, this work uses the same data as Minguela-Rata et al. (2024) as it proposes to dig deeper into said authors’ findings and to cover the gap identified by these authors. In the future, analyses should be done in other geographic contexts of both the “total eclipse” effect and the paradox of IS flexibility in SCF in the LP context in firms in an intermediate position in their supply chain. Four, the present model considers the cross-media effects of SC flexibility on the LP-BP relationship. The analysis of these effects can be extended to other levels of analysis with different main relationships, such as an examination of the effect of SC sustainability on performance and how this relationship can be moderated or mediated by specific types of SC flexibility. Also, in the future, it would be interesting to use the models considered in this paper to analyze the individual effects of IS flexibility and other SCF dimensions not only on the BP aggregated construct but also on the two sub-dimensions of BP (financial performance and operational performance).6,7
The authors acknowledge the financial support from the Spanish Ministry of Science, Innovation and Universities (Research Project PID2023-148345NB-I00, Research Project PID2022-140026NB-I00 and Research Project PID2021-124396NB-I00), UJA-FEDER Andalusian Operational Program Research (Research Project M.1.B.B TA 000790) and Grant C-SEJ-020-UGR23 funded by Consejería de Universidad, Investigación e Innovación and by ERDF Andalusia Program 2021-2027.
References
Appendix Measure model: Exploratory Factor Analysis and Confirmatory Factor Analysis
Exploratory factor analysis results
| Construct | Observable variable code | Standardized factor loading | Bartlett’s test | KMO | % Explained variance | ||||
|---|---|---|---|---|---|---|---|---|---|
| Second-order | First-order | ||||||||
| Lean Production implementation | Production plant layout | LP1 | 0.845 | X2 = 178.521 df = 3 sig. = 0.00 | X2 = 499.796 df = 21 sig. = 0.00 | 0.677 | 0.802 | 66.224% | 62.445% |
| LP2 | 0.820 | ||||||||
| LP3 | 0.775 | ||||||||
| Lean practices | LP4 | 0.735 | X2 = 241.074 df = 6 sig. = 0.00 | 0.766 | 58.084% | ||||
| LP5 | 0.810 | ||||||||
| LP6 | 0.794 | ||||||||
| LP8 | 0.704 | ||||||||
| – | SC Sourcing flexibility | SCF2 | 0.913 | X2 = 152.685 df = 1 sig. = 0.00 | – | 0.500 | – | 83.441% | – |
| SCF3 | 0.913 | ||||||||
| SC Operating System flexibility | SCF5 | 0.866 | X2 = 74.431 df = 1 sig. = 0.00 | 0.500 | 75.051% | ||||
| SCF7 | 0.866 | ||||||||
| SC Distribution flexibility | SCF8 | 0.689 | X2 = 292.703 df = 6 sig. = 0.00 | 0.716 | 59.281% | ||||
| SCF9 | 0.732 | ||||||||
| SCF10 | 0.865 | ||||||||
| SCF11 | 0.783 | ||||||||
| SC Information System flexibility | SCF13 | 0.911 | X2 = 193.657 df = 3 sig. = 0.00 | 0.500 | 82.990% | ||||
| SCF14 | 0.911 | ||||||||
| Business Performance | Operational performance | OP1 | 0.758 | X2 = 916.147 df = 21 sig. = 0.00 | X2 = 2,771.679 df = 91 sig. = 0.00 | 0.847 | 0.866 | 55.768% | 65.199% |
| OP2 | 0.798 | ||||||||
| OP3 | 0.815 | ||||||||
| OP4 | 0.809 | ||||||||
| OP5 | 0.577 | ||||||||
| OP6 | 0.707 | ||||||||
| OP7 | 0.736 | ||||||||
| Financial performance | FP1 | 0.853 | X2 = 1,175.646 df = 10 sig. = 0.00 | 0.864 | 78.785% | ||||
| FP2 | 0.916 | ||||||||
| FP3 | 0.947 | ||||||||
| FP4 | 0.898 | ||||||||
| FP6 | 0.818 | ||||||||
Note(s): SPSS software V24
Confirmatory factor analysis results
| Construct | Observable variable code | Cronbach’s α | Composite reliability | Standardized factor loading | R2 | % Average variance Explained | ||||||
|---|---|---|---|---|---|---|---|---|---|---|---|---|
| Second-order | First-order | |||||||||||
| Lean Production implementation | Production plant configuration | LP1 | 0.74 | 0.79 | 0.74 | 0.82 | 0.755 | 0.69 | 0.571 | 0.476 | 49.85% | 46.84% |
| LP2 | 0.697 | 0.486 | ||||||||||
| LP3 | 0.663 | 0.439 | ||||||||||
| Lean practices | LP4 | 0.75 | 0.76 | 0.625 | 0.81 | 0.390 | 0.656 | 44.60% | ||||
| LP5 | 0.705 | 0.497 | ||||||||||
| LP6 | 0.729 | 0.531 | ||||||||||
| LP8 | 0.604 | 0.365 | ||||||||||
| – | SC Sourcing flexibility | SCF2 | 0.80 | – | 0.81 | – | 0.686 | 0.65 | 0.470 | 0.422 | 71.05% | – |
| SCF3 | 0.975 | 0.951 | ||||||||||
| SC Operating System flexibility | SCF5 | 0.67 | 0.67 | 0.707 | 0.79 | 0.500 | 0.624 | 50.10% | ||||
| SCF7 | 0.708 | 0.502 | ||||||||||
| SC Distribution flexibility | SCF8 | 0.77 | 0.78 | 0.553 | 0.79 | 0.306 | 0.624 | 47.66% | ||||
| SCF9 | 0.609 | 0.371 | ||||||||||
| SCF10 | 0.833 | 0.693 | ||||||||||
| SCF11 | 0.732 | 0.535 | ||||||||||
| SC Information System flexibility | SCF13 | 0.78 | 0.79 | 0.660 | 0.39 | 0.435 | 0.152 | 71.75% | ||||
| SCF14 | 1.00 | 1.00 | ||||||||||
| Business Performance | Operational performance | OP1 | 0.86 | 0.88 | 0.89 | 0.93 | 0.729 | 0.60 | 0.529 | 0.360 | 52.53% | 59,89% |
| OP2 | 0.827 | 0.683 | ||||||||||
| OP3 | 0.836 | 0.693 | ||||||||||
| OP4 | 0.827 | 0.687 | ||||||||||
| OP5* | n.a | n.a | ||||||||||
| OP6 | 0.525 | 0.279 | ||||||||||
| OP7 | 0.551 | 0.281 | ||||||||||
| Financial performance | FP_1 | 0.93 | 0.93 | 0.779 | 0.59 | 0.306 | 0.348 | 68.72% | ||||
| FP_2 | 0.929 | 0.606 | ||||||||||
| FP_3 | 0.973 | 0.863 | ||||||||||
| FP_4 | 0.845 | 0.947 | ||||||||||
| FP_6 | 0.731 | 0.714 | ||||||||||
Note(s): EQS software V.6.4. Goodness of fit: (Satorra-Bentler’s scaled X2 = 664.636; df = 331; X2/df = 2.01; RMSEA = 0.06; NFI = 0.778; NNFI = 0.854; CFI = 0.873; IFI = 0.875; MFI = 0.526)
* Items removed after confirmatory factor and reliability analyses

