

Voice assistants (VAs) have reshaped customer service by offering new interaction channels. This study explores how user-expressed emotions during interactions with multimodal and voice-only devices across different contexts affect satisfaction. Capturing user emotions via voice tone and speech content analysis, we show that both device type and usage context are crucial in shaping user emotions and satisfaction.
In three laboratory experiments (n1 = 97; n2 = 97; n3 = 109) participants interacted with different device types in various contexts. The first and second experiments investigate task valence and complexity; the third explores the role of device anthropomorphism in eliciting consumer emotions and satisfaction.
User satisfaction is contingent on both device type and usage context. Different device types are better suited for different tasks and usage contexts. The emotions which the users expressed via voice tone and speech content can explain the differences and should be considered when seeking to improve the user experience.
This study proposes an innovative, objective way to assess VA users’ emotions holistically via voice and content, contributing to a better understanding of their role in enhancing or hindering the satisfaction of VA users.
1. Introduction
Voice assistants (VAs) have undergone exponential growth in device sales and widespread adoption across diverse services and applications, with the global smart speaker market valued at approximately $12.52bn in 2023 (Fortune Business Insights, 2023). Despite this, users often perceive VAs as novelty gadgets that lose appeal over time (Nguyen, 2021). While 77% of adults in the USA are aware of VAs on smartphones, only 24% use them beyond basic commands such as playing music (Laricchia, 2024). To monetize VA applications, VA producers including Google and Amazon aimed to create ecosystems for third-party providers, akin to the app store for mobile applications, but these plans have not yet come to fruition (Amadeo, 2022). Research has focused primarily on aspects such as intentions to use a VA (Fernandes and Oliveira, 2021), VA adoption (Moriuchi, 2019), VAs and brand engagement (McLean et al., 2021), and loyalty toward VAs (Hernández-Ortega and Ferreira, 2021). However, the gap between VA access and continuous usage remains a challenge. This gap can be attributed to technological shortcomings and user frustration, which prevent more extensive usage of the devices (Grewal et al., 2022a), highlighting the need for more user experience research in this domain (Guha et al., 2023).
According to Phillips and Baumgartner (2002), the satisfaction individuals derive from consuming a product or service depends heavily on the emotions they experience. This insight is relevant to human–machine interactions, where user satisfaction is often influenced by the emotions a user feels during interactions (Mari et al., 2024), and yet this has not been explored in detail in the context of voice-based interactions. Voice-based interactions differ significantly from interactions mediated by writing or haptic interactions (Hoffmann et al., 2019) and are inherently emotional (Poushneh, 2021). However, research related to understanding the significance of emotions in driving satisfaction, particularly in voice-based interactions, is still at a nascent stage (Jain et al., 2023; Mari et al., 2024).
Emotions arise during the process of the interaction with the VA and are due to judgments of the process and the outcome of the interaction (Moriuchi, 2021). Negative emotions like contempt or frustration may lead to reduced satisfaction, while positive emotions like joy can increase satisfaction (Phillips and Baumgartner, 2002). Research shows that in the domain of speech interactions, perceived emotions are particularly relevant in shaping the outcome of an interaction, even more so than in text-based human-technology interactions (Schindler et al., 2023), given the more emotional nature of spoken versus written interactions (Berger et al., 2022). Although existing services literature on voice interactions has measured user-expressed emotions through text analysis by means of topic modeling or text mining (cf. Jain et al., 2023), these methods might overlook the crucial context of how things are said during the interaction. Therefore, and in line with recent calls for more research based on voice-feature extractions (Hildebrand et al., 2020) as well as the use of multimodal data from customer interactions (Grewal et al., 2022b) this study introduces a two-dimensional measure to extract user-expressed emotions from voice interactions by analyzing a) the users’ speech content, or what was said, as well as b) the users’ voice tone, or the emotional expressiveness of the voice itself as potential mediators when assessing the satisfaction of VA users. We apply text mining and algorithmic voice analysis to extract the measurements.
Moreover, to predict the different context-specific emotions experienced by users, we draw on cognitive appraisal theory (Bagozzi et al., 1999; Watson and Spence, 2007) as a framework to predict emotional reactions via appraisals or judgments. Emotions generated before, during, and after an interaction are contingent on the stimuli present during the interaction (Watson and Spence, 2007), which implies that the emotions expressed by individuals also differ across contexts and channels. Therefore, we employ multiple research contexts for this study, involving different tasks and different VA device types.
Research has established that the user experience around solving a task plays a significant role in the satisfaction of VA users (Poushneh, 2021). Recent findings indicate that different tasks have different prerequisites and preferred modes of interaction (Sung et al., 2023). Given that VAs can be used for a wide range of potential tasks (Grewal et al., 2022a), to shed light on how different usage situations can alter the emotional reaction and in turn the satisfaction of the users, we investigate two different dimensions of tasks, namely task valence (e.g. tasks such as entertainment are positive, whereas tasks such as scheduling a medical appointment are negative) and task complexity (e.g. tasks such as playing music are simple, whereas tasks such as obtaining investment advice are more complex). Additionally, we investigate the role of device anthropomorphism, given that voice-based interactions were until recently reserved for human interaction. In general, the literature agrees that increased device anthropomorphism helps to improve user satisfaction (Guha et al., 2023), and yet there are indicators that it might backfire in certain contexts (De Keyser and Kunz, 2022). Accordingly, we investigate how device anthropomorphism impacts user-expressed emotions and user satisfaction.
Finally, the literature identifies two major categories of VA devices (Hoffmann et al., 2019). On the one hand, there are voice-only voice assistants (VOVA), which allow for only voice-based input and output and typically consist of a speaker with an integrated microphone. Multimodal voice assistants (MMVA), on the other hand, offer additional modes of interaction, including visual and haptic elements, typically via a touchscreen. Thus, VOVA devices excel in simplicity, while MMVA devices offer enhanced control for complex interactions (Hoffmann et al., 2019). In this study, we test whether the effects of different task dimensions and device anthropomorphism in eliciting user-expressed emotions are contingent on device type.
In summary, we therefore address the following research question: How do user-expressed emotions, measured through speech content and voice tone, during VA interactions influence user satisfaction, considering variations in device type (e.g. MMVA vs VOVA), task characteristics (valence and complexity) and device positioning (anthropomorphism)? By analyzing both speech content and voice tone, our study introduces an innovative, multimodal method that offers a more objective and nuanced assessment of user-expressed emotions, addressing longstanding limitations of self-reported measures. This methodological advancement allows us to uncover distinct emotional signals conveyed through how something is said (voice tone) versus what is said (speech content) and demonstrates that both dimensions uniquely inform satisfaction outcomes. Beyond measurement, we integrate cognitive appraisal theory to explain why certain emotional responses emerge, grounding observed emotions in appraisals such as outcome desirability, agency, fairness, and certainty. Finally, we provide a more holistic perspective on voice-based service interactions by showing that the effects of user-expressed emotions on satisfaction are not uniform but vary systematically with device type and task context. This integrative framework advances the domain of voice assistant research by linking emotion, technology design, and contextual dynamics in a unified model of user experience.
The paper is structured as follows. First, we provide an overview of research on consumer emotions and VA, with an introduction to cognitive appraisal theory as a useful framework in which to predict emotions. We then turn toward the different research contexts (task valence, complexity, and device anthropomorphism) to develop our hypotheses. Subsequently, we describe the procedure and results of our laboratory experiments and conclude with implications for theory and practice.
2. Conceptual background
The role of consumer emotions has been widely researched in the field of marketing. For comprehensive overviews see Sharma et al. (2023) and Aeron and Rahman (2023). It has been widely shown that positive consumer emotions enhance the consumption experience (cf. Kim and Choi, 2016) and value co-creation processes (cf. Zhang et al., 2018), while negative emotions, especially during service interactions, yield negative outcomes such as dysfunctional consumer behavior (cf. Sugathan et al., 2017). These temporal effects extend to consumption outcomes and influence consumer attitudes, particularly satisfaction (cf. Esmark Jones et al., 2020; Martin et al., 2008) and therefore impact consumers’ future actions. In general, negative emotions are linked to dissatisfaction, while positive emotions can predict higher levels of satisfaction (Sharma et al., 2023).
While the previously described findings are well established in offline environments and for human-to-human interactions, more research is needed into how these effects extend to digital consumer experiences, and especially to human–machine interactions in service settings (Sharma et al., 2023). Furthermore, the majority of the established literature draws on self-reported measures to assess consumer emotions (Aeron and Rahman, 2023). Although these methods have merit in capturing conscious consumer emotions in an aggregate valid and reliable manner, they may suffer from issues such as social desirability bias (cf. He et al., 2021), inaccurate memory (cf. Wolf and Ueda, 2021), and an inability to capture unconscious dimensions of emotions (cf. Ariely and Berns, 2010). Therefore, there have been repeated calls to take advantage of the data-rich digital environment and to use novel sensorial and algorithmic analysis techniques to offer a more objective and more complete measure of consumer emotions (cf. Smidts et al., 2014; Aeron and Rahman, 2023).
Given that voice as a communication channel is traditionally linked to human-to-human interaction (cf. Grewal et al., 2022a) and that the technology for analyzing voice as a structured source of data is rather recent and still emerging (Gasteiger et al., 2022; Hildebrand et al., 2020), it seems relevant to investigate how consumers’ emotions expressed in this channel can impact their satisfaction.
2.1 Voice and emotions
Two streams of literature examine the nature of emotions in voice or speech contexts. On the one hand, several studies stemming from the communication and marketing literature capture emotions via speech content, focusing on comparing speech to text (cf. Berger et al., 2022; Schindler et al., 2023). This stream aims to analyze emotions expressed explicitly through speech content, which can be achieved using text mining algorithms on the content of the interactions. Research results highlight the importance of investigating voice-based emotions in VA interactions by showing that emotions are more relevant in spoken conversations than in writing. This is due to the fact that oral communication is more unstructured (Berger et al., 2022), less planned, and more spontaneous than written communication (Schindler et al., 2023). Emotional words are typically more salient and easier to access, and therefore more likely to be present in oral communication, leading to an increased presence of emotionality in the content of speech. Thus, speech is more emotion-laden (Berger et al., 2022) and more subjective than written communication, which in turn might have a strong effect on the user experience when interacting with a VA.
On the other hand, research on vocal prosody postulates that, when speaking, consumers make use of the voice as a vehicle of communication, which can convey implicit emotional expressions irrespective of the words chosen (Crumpton and Bethel, 2016), as “the way in which we speak often accurately reveals our current emotional state” (Hildebrand et al., 2020, p. 364). Unlike text, speech includes an auditory component, which can be analyzed independently via voice tone to understand implicitly expressed emotions of individuals regardless of the speech content. Vocal prosody, the communication of emotions through speech (Crumpton and Bethel, 2016), performs a critical function by providing information about affective states and, consequently, gives important cues to facilitate recognition of personal emotion (Iredale et al., 2013). Vocal features, such as pitch, timing, and loudness have been identified as features of speech that correlate with emotions, for a comprehensive review, please consult Hildebrand et al. (2020). Pitch is the frequency of the vibration of the vocal folds when a person is speaking; timing refers to the speed and pauses with which a person speaks; and loudness is defined as the speaking volume of a person. Typically, higher values of all three dimensions suggest arousal, which can be related to emotions such as happiness or fear, while lower values for pitch, loudness, and timing might indicate calmness or boredom (Huang et al., 2021). Gasteiger et al. (2022) showed that these dimensions are the most used and most effective prosody dimensions when it comes to detecting human emotions in human–machine interactions. Recent advances from the field of human-centered computing provide initial evidence of the usefulness of using both speech-content and voice-tone user-expressed emotions in user experience research (e.g. Fan et al., 2019, 2021), as not all dimensions of emotional expression might be captured otherwise.
In summary, emotions in speech can be expressed via speech content as well as via voice tone. Speech is relatively more emotion-laden than other channels of expression and, given the overall importance of consumer emotions in shaping satisfaction, represents a promising avenue to investigate.
2.2 Existing research on VAs and emotions
Recent literature has turned to understanding the emotions of VA users, and we provide an overview in Table 1. The majority of existing studies are in line with the general literature on consumer emotions in finding that positive emotions enhance satisfaction (Gelbrich et al., 2021; Hernández-Ortega and Ferreira, 2021; Mari et al., 2024). Jain et al. (2023) add to the literature that negative emotions may reduce service quality, especially when the user experiences strong negative emotions. Hernández-Ortega and Ferreira (2021), like Jain et al. (2023), rely on survey-based methods to show how emotions toward VAs in general affect performance evaluations and behavioral intentions. Gelbrich et al. (2021) and Mari et al. (2024), on the other hand, rely on online and field studies to understand how self-assessed emotions after a VA interaction can explain satisfaction and behavioral intentions. Although Jain et al. (2023) use text mining of consumer reviews to show field evidence for their theoretical framework, all studies rely on self-assessed measurements of consumer emotions to test their predictions empirically. Interestingly, all studies focus on one discrete emotion, often a positive one (e.g. empathy, warmth, or love). This leaves room for studies that focus on positive and negative emotions at the same time. Furthermore, the studies focus on different device characteristics such as emotional capabilities (Gelbrich et al., 2021), smart or social experiences (Hernández-Ortega and Ferreira, 2021; Mari et al., 2024), or general perceptions of quality and similarity (Jain et al., 2023).
Literature overview of emotions and VA
| Study | Research context and findings | Research method | Emotion | Emotion measurement | Different device typesa | Different usage scenariosa | Device interactiona |
|---|---|---|---|---|---|---|---|
| Gelbrich et al. (2021) | Investigate the impact of emotional support from digital assistants on user satisfaction and persistence. Four studies compare assistants with and without emotional support, revealing that emotional support significantly enhances satisfaction in both failure and success contexts, mediated by the perceived warmth of the assistant | Online experiments (scenarios and online interaction) | Warmth | Manipulated, self-reported measures | ✗ | ✗ | ✓ |
| Hernández-Ortega and Ferreira (2021) | Explore how smart experiences influence love for smart VAs and the significance for service loyalty. Findings show that smart experiences enhance love (passion, intimacy, and commitment), boosting service loyalty. Intimacy is key for electronic word-of-mouth, while commitment affects word-of-mouth intentions | Online survey | Love (passion, intimacy, commitment) | Self-reported measures | ✗ | ✓ | ✗ |
| Ma et al. (2022) | Examine how virtual assistants should respond to negative emotions like sadness, anger, and fear. Participants interacted with animated avatars, and emotions were detected by a voice algorithm. Findings show that interactions mainly elicited neutral emotions, with females displaying more emotional responses than males | Online experiment | Happiness, sadness, anger, and fear | Manipulated, voice-tone measures | ✗ | ✗ | ✓ |
| Jain et al. (2023) | Explore service gaps in VA experiences by examining emotional responses from high and low-arousal groups based on their reviews. Results highlight that poor service quality significantly increases technology irritation only in users with high negative emotional arousal | Mixed methods approach (interviews, review analysis, and survey) | Irritation | Self-reported measures, text mining (user reviews) | ✗ | ✗ | ✗ |
| Mari et al. (2024) | Focus on voice commerce and how empathic AI interactions can enhance consumer experiences. Results show that empathic VAs improve perceptions of ease of use, enjoyment, understanding, and social presence, leading to higher user trust, decision assistance, and favorable responses to product recommendations | Field study | Empathy | Manipulated, self-reported measures | ✗ | ✗ | ✓ |
| Current study | Tests different usage contexts and device types of VA and explores consumers’ expressed emotions via their speech content and voice tone during the interaction as a key element in predicting satisfaction | Laboratory experiments | Positive and negative emotions | Voice-tone measures, speech content (text mining) | ✓ | ✓ | ✓ |
Note(s):
Different device types: different modalities of the VA (e.g. MMVA (e.g. voice, haptic and visual interaction), VOVA (voice-only interaction); different usage scenarios (e.g. different tasks to complete on the VA such as complex or simple tasks) Device interactions: Direct interaction of participants with the VA (i.e. experimental setting)
Therefore, relatively little is known about the different VA types, or about different usage contexts and their potential impact on consumer emotions. As a notable exception, Ma et al. (2022) incorporated voice tone-based consumer emotions, and their study measures consumer reactions to particular emotions in order to provide guidelines on how VAs should react when they detect certain consumer emotions. Nonetheless, there is no study so far that traces objectively measured consumer emotions during different VA interactions and relates them to satisfaction.
To address this gap, we draw on cognitive appraisal theory as an underlying framework, to predict the emotions which a user is likely to experience during a VA interaction in different usage scenarios, and while using different device types.
2.3 Cognitive appraisal theory and VAs
When turning to the origin of emotions, cognitive appraisal theory emerges as a central concept (Watson and Spence, 2007). In addition to classic concepts of classifying emotions into major categories (Plutchik, 1980) or simply using a dimensional approach of valence and arousal (Athiyaman, 1997), cognitive appraisal theory addresses the question of the origin of different emotions. In general, it posits that human emotions are triggered by the process of judging perceived stimuli (Babin and Harris, 2022) and thus provides a framework for understanding how individuals assess and react emotionally to events by identifying four major types of judgments (Watson and Spence, 2007). The most widely used appraisals include outcome desirability, agency, fairness, and certainty as key appraisals that drive perceived emotions to a large degree.
Certainty reflects the perceived predictability of outcomes, shaping emotions like hope or fear that influence user experience and satisfaction (Watson and Spence, 2007). High uncertainty can evoke hopeful or fearful emotions based on users’ expectations, affecting their interaction with a VA from the outset. Responsibility involves determining whether an outcome is attributed to oneself, the VA, or external factors, which significantly affects emotions and behaviors, particularly after negative events (Agrawal et al., 2013). In VA interactions, users often attribute successes or failures to the device (external agency) rather than to themselves, which influences emotions like anger, guilt, gratitude, and pride. Fairness describes whether outcomes and processes are perceived as fair. Perceptions of fairness are crucial in enhancing user satisfaction, especially in customer service contexts or personalized recommendations (Agrawal et al., 2013). Finally, outcome desirability refers to the initial judgment of whether a result benefits one’s well-being, evaluating a situation against personal goals and expectations to evoke positive or negative emotions (Watson and Spence, 2007). For example, if a user requests a local weather update, emotions like frustration or enjoyment will depend on the accuracy and relevance of the VA’s response.
2.4 VAs and different tasks
The current VA literature has not fully addressed how the user experience varies with different tasks (Sung et al., 2023). VAs assist with a broad range of tasks, from entertainment to functional needs, and are evolving to handle more complex tasks (Grewal et al., 2022a). The nature of these tasks is quite diverse and can range, for instance, from interesting to dull or from simple to complex. Research shows that task type and interaction modality (voice vs text) significantly impact user perception of VAs (Cho et al., 2019), and thus different VA types may also be better suited for different tasks. Studies have examined social vs functional tasks (Sung et al., 2023) and hedonic vs utilitarian tasks (Cho et al., 2019). Findings show that task type in combination with different interaction modalities (voice vs text) has a pivotal impact on users’ perception of the VA (Cho et al., 2019), with functional tasks typically leading to more positive attitudes than social tasks (Sung et al., 2023). To our knowledge, no prior studies have investigated how voice interactions for different tasks play out in different VA systems. Building on these findings, we aim to understand how VA types influence users’ emotions and overall responses across various tasks.
2.5 Task valence: pleasant and unpleasant tasks
In daily life, consumers typically need to carry out many different tasks, some of them more pleasant than others. Pleasant tasks are typically preferred over unpleasant ones, often leading consumers to put off the latter, resulting in behavior such as procrastination (Steel, 2007), or simply in higher or lower degrees of motivation and enjoyment when fulfilling them. VAs can help users carry out both types of tasks, and users might have different reasons to use them when solving either task type. For a pleasant task, the focus might be on the enjoyment of doing the task via a VA, while for unpleasant tasks, users might opt for a VA if the system offers an easy and “pain-free” solution.
When we view task pleasantness relative to cognitive appraisal theory, we can assume that outcome desirability and certainty plays a major role in determining the emotions elicited by individuals. On the one hand, the outcome desirability of doing an unpleasant task is typically associated with relief, as failing to do the task might yield even more negative consequences (Graham et al., 2023). Furthermore, users typically try to avoid unpleasant tasks, which are often associated with boredom or frustration (Jokinen, 2015). Thus, they might prefer a relatively certain and pain-free outcome, as the anticipated negative emotions are a main demotivator (Steel, 2007). On the other hand, when individuals interact with a VA for pleasant tasks, both the certainty and the outcome desirability might trigger positive emotion such as anticipation and joy before and during the task (Watson and Spence, 2007).
Completing both types of tasks can lead to satisfaction if the outcome is as desired (i.e. if the task is completed). In the case of unpleasant tasks, satisfaction typically originates from the relief of having completed the task, while in the case of pleasant tasks, the positive emotions experienced might lead to satisfaction (Chitturi et al., 2008). VAs are designed to serve the user for both types of tasks, as they can, for instance, help to book a romantic dinner or a dentist appointment (Newman, 2018). Yet, we propose that there are differences when users use either MMVAs or VOVAs to carry out such tasks. MMVAs are more involving and immersive compared to VOVAs (Hermann, 2021), and people might derive greater joy from interacting with them. This might amplify the effect of experienced positive emotions when completing pleasant tasks, resulting in increased satisfaction. VOVAs, on the other hand, are often evaluated as equally good for simply getting things done (Hoffmann et al., 2019). They are the no-frills version of the product, allowing consumers to accomplish tasks without needing to involve communication channels other than their voice. Conversely, users might prefer a VOVA for an unpleasant task because of the effortlessness of the interaction, which can lead to more positive emotions during task completion and, in turn, to higher satisfaction. A priori, we do not expect differences between speech content-based and voice tone-based emotions, and therefore hypothesize:
Pleasant tasks (vs unpleasant tasks) lead to higher positive user-expressed emotions (speech content and voice tone) and to higher satisfaction when they are performed on MMVA (vs VOVA).
Unpleasant tasks (vs pleasant tasks) lead to higher positive user-expressed emotions (speech content and voice tone) and to higher satisfaction when they are performed on VOVA (vs MMVA).
2.6 Task complexity: simple and complex tasks
Task complexity has been applied as a moderator on task outcome, technology choice, and technology adequacy (Maity and Dass, 2014). Findings indicate that greater task complexity often reduces the quality of task outcomes, since users need greater cognitive effort to understand and solve complex tasks, leaving fewer resources for the development of creative solutions (Jiang and Benbasat, 2007). Furthermore, it is known that more complex tasks are often solved in a person-to-person setting rather than in a virtual environment (Hong et al., 2021). Finally, when solving a task via focal technology, users often prefer different designs of the application within that technology, depending on the complexity of the task (Maity and Dass, 2014).
Studies have found that appraisals such as certainty and agency significantly influence emotions and satisfaction in the context of task complexity. Initially, certainty, which involves the predictability and clarity of outcomes, reduces user anxiety and enhances satisfaction in complex tasks (Lerner and Keltner, 2000). Moreover, agency, which relates to responsibility attribution, affects user frustration and satisfaction by clarifying whether errors are due to the system or the user (Han et al., 2007). Proper handling of these appraisals can improve user experiences by making interactions smoother and reducing frustration (Bagneux et al., 2013).
For simple tasks, research has shown that consumers are somewhat indifferent to whether they use VOVAs or MMVAs (Hoffmann et al., 2019), as both device types can solve the task in a similar way. Nevertheless, there is some evidence that users prefer the simplicity of a VOVA when performing repetitive simple chores (Hermann, 2021). Although VAs have traditionally been limited in their capability to carry out more open and complex tasks (Moriuchi, 2019), the literature mentions that this capability is increasing (Graf and Zessinger, 2022) and projected to increase further in the future (Newman, 2018). Yet, the failure of VAs to solve complex tasks is often mentioned as a major source of negative emotion, frustration, and dissatisfaction (Hermann, 2021). Users might, therefore, anticipate such negative experiences when solving a complex task via a VA, thus increasing the probability of more negative emotions during usage, as predicted by the certainty appraisal. As input, speech is fast, but as output it is slow and tedious (Holcomb and Grainger, 2006). Given that complex tasks involve more information output, the graphical element of MMVAs should enhance their capability of solving them, while VOVAs are limited to speech as an information output. Furthermore, the haptic option of interaction in MMVAs allows consumers to fine-tune results; this might be useful, as complex tasks require more detail and precision than simple tasks, reducing agency toward both the user and the device (Goebel, 2020). This enhanced capability of MMVAs might lower the degree of frustration experienced and thus reduce negative emotions. In turn, for VOVAs, complex tasks might increase the probability of negative user emotions through blame (agency) or bad results (certainty), which might lead to more negative emotions and reduced levels of satisfaction. We therefore hypothesize:
Complex tasks (vs simple tasks). lead to lower negative user-expressed emotions (speech content and voice tone) and to higher satisfaction when they are performed on MMVA (vs VOVA).
Simple tasks (vs complex tasks) lead to lower negative user-expressed emotions (speech content and voice tone) and to higher satisfaction when they are performed on VOVA (vs MMVA).
2.7 VAs and anthropomorphism
Anthropomorphism, the humanization of nonhuman entities by giving them humanlike features, has a long tradition in human–technology interaction. It is prominent in service robot literature, showing mixed results in different contexts (De Keyser and Kunz, 2022). The emergence of VAs has brought similar studies on artificiality, humanness, and anthropomorphism (Sung et al., 2023). Research has yielded varied findings. Fernandes and Oliveira (2021) found no significant effect of VA anthropomorphism on acceptance, while Moriuchi (2021) found positive effects on engagement. Studies have shown that anthropomorphized devices can create greater empathy and are able to provide more pleasurable interactions (De Keyser and Kunz, 2022). Luger and Sellen (2016), on the other hand, suggest that anthropomorphized VAs can create unrealistic expectations, leading to disappointment. Recent findings show that such unrealistic expectations cause users to blame the device disproportionately more, resulting in reduced satisfaction (Xie et al., 2023). Notably, and reflecting the mixed results from academia, anthropomorphism in device positioning varies considerably in the market, with Amazon and Apple using anthropomorphized names (Alexa, Siri), whereas Google opts for a nonanthropomorphized approach (Google Assistant) (see Figure 1).
 The diagram starts from the top center with a box labeled “Device type (M M V A versus V O V A).” Below it, three boxes are arranged vertically on the left side. The topmost box on the left is labeled “Study 1: Task valence (unpleasant versus pleasant).” The box in the middle is labeled “Study 2: Task complexity (simple versus complex),” and the bottom box is labeled “Study 3: Anthropomorphism (anthropomorphized versus nonanthropomorphized device).” On the right side, a large rectangular box is labeled “User-expressed emotions,” which is divided into two sections. The top section is labeled “Positive” and contains two nested rectangles labeled “Positive speech content” and “Positive voice tone.” The bottom section is labeled “Negative” and contains two nested rectangles labeled “Negative speech content” and “Negative voice tone.” Two individual rightward arrows from each “Study” on the left point to “Positive” and “Negative” boxes on the right. A solid rightward arrow from “Study 1” points to the “Positive” box. A dotted rightward diagonal downward arrow from “Study 1” points to the “Negative” box. A solid rightward diagonal downward arrow from “Study 2” points to the “Negative” box. A dotted rightward diagonal upward arrow from “Study 2” points to the “Positive” box. A solid rightward arrow upward from “Study 3” points to the “Positive” box. A dotted rightward arrow from “Study 3” points to the “Negative” box. Two individual rightward solid arrows from the “Positive” and the “Negative” box point to a small box labeled “Satisfaction.” The arrow from “Positive” is labeled “Study 1 and 3,” and the arrow from the “Negative” box is labeled “Study 2.” At the bottom, a legend indicates that solid arrows represent “Hypothesized and tested” and the dashed arrows represent “Not hypothesized but tested.” From the “Device type (M M V A versus V O V A)” at the top, three individual downward arrows point to the solid arrows from each of the three studies.
Conceptual model; Source(s): Created by the authors
The diagram starts from the top center with a box labeled “Device type (M M V A versus V O V A).” Below it, three boxes are arranged vertically on the left side. The topmost box on the left is labeled “Study 1: Task valence (unpleasant versus pleasant).” The box in the middle is labeled “Study 2: Task complexity (simple versus complex),” and the bottom box is labeled “Study 3: Anthropomorphism (anthropomorphized versus nonanthropomorphized device).” On the right side, a large rectangular box is labeled “User-expressed emotions,” which is divided into two sections. The top section is labeled “Positive” and contains two nested rectangles labeled “Positive speech content” and “Positive voice tone.” The bottom section is labeled “Negative” and contains two nested rectangles labeled “Negative speech content” and “Negative voice tone.” Two individual rightward arrows from each “Study” on the left point to “Positive” and “Negative” boxes on the right. A solid rightward arrow from “Study 1” points to the “Positive” box. A dotted rightward diagonal downward arrow from “Study 1” points to the “Negative” box. A solid rightward diagonal downward arrow from “Study 2” points to the “Negative” box. A dotted rightward diagonal upward arrow from “Study 2” points to the “Positive” box. A solid rightward arrow upward from “Study 3” points to the “Positive” box. A dotted rightward arrow from “Study 3” points to the “Negative” box. Two individual rightward solid arrows from the “Positive” and the “Negative” box point to a small box labeled “Satisfaction.” The arrow from “Positive” is labeled “Study 1 and 3,” and the arrow from the “Negative” box is labeled “Study 2.” At the bottom, a legend indicates that solid arrows represent “Hypothesized and tested” and the dashed arrows represent “Not hypothesized but tested.” From the “Device type (M M V A versus V O V A)” at the top, three individual downward arrows point to the solid arrows from each of the three studies.Conceptual model; Source(s): Created by the authors
Combining this logic with VA types brings a new dimension to the existing research stream, and appraisals such as agency or fairness might impact the user’s emotions and thus satisfaction. MMVAs, by offering visual and haptic interaction, provide a richer experience (Moriuchi, 2021) and larger screens, such as on laptops, which might enhance the perception of humanness (Cho et al., 2019). VOVAs, on the other hand, offer more of a simple, “no-frills” experience through the absence of additional displays (Hoffmann et al., 2019). This might make it harder for users to attribute humanlike features to the device and therefore lead to greater disappointment when a VOVA is presented in an anthropomorphized way. Thus, the “gulf of expectations” (Luger and Sellen, 2016) for anthropomorphized devices might be smaller for MMVAs because of the enriched experience, thereby fulfilling the users’ expectations, taking advantage of the anthropomorphized device, and providing a positive emotional experience (Wagner et al., 2019). On the other hand, for VOVAs, the match between expectations and results might be closer for nonanthropomorphized devices, creating greater perceived fit, and thus more positive emotions and higher satisfaction (Luger and Sellen, 2016). We therefore hypothesize:
An anthropomorphized MMVA leads to higher positive user-expressed emotions (speech content and voice tone) and to higher satisfaction compared to a nonanthropomorphized MMVA.
A nonanthropomorphized VOVA device leads to higher positive user-expressed emotions (speech content and voice tone) and to higher satisfaction compared to an anthropomorphized VOVA.
3. Empirical studies
In order to test the three sets of hypotheses, we conducted three laboratory studies in which participants interacted with the different VA types. In general, participants were undergraduate and graduate students from a small European university and were compensated for their participation with course credit. All studies were conducted in a comparable manner and used the same measurements. Participants were administered on a one-by-one basis, and upon arrival at the laboratory, received detailed instructions from an experimenter and signed a consent form to participate, which included agreeing to their voice interactions being recorded. The studies were given ethical approval by the board of directors of the behavioral laboratory in which they were conducted.
In each study, half of the participants interacted with a VOVA and the other half used an MMVA. Both systems were powered by the Google Assistant software. The VOVA was the Nest Mini 2nd generation, and the MMVA was the Nest Hub 2nd generation. The instructions for the VA interaction were presented on a computer screen, which also made it possible to record the interactions of each participant with the VA. To assess the emotions from the interactions, these recordings served as the data source. Speech content emotions were derived from the interaction transcripts via Linguistic Inquiry and Word Count (LIWC15) software (Pennebaker et al., 2015), which has been widely used in research to assess the presence or absence of emotions in text (see Herhausen et al., 2019). Only the participant’s part of each interaction was used to calculate the presence of words relating to positive and negative emotions.
To assess voice tone-based emotions, the recordings for all three studies were processed using the devAIce® model from AudEERING GmbH, which is integrated into the iMotions 9.4 software package. It analyzes voice on three levels: (1) voice; (2) arousal, dominance, and valence; and (3) specific emotions (Wagner et al., 2023). The first and most basic level is prosody, which refers to the characteristics that determine the sound of a voice. Prosody includes frequency, loudness, speaking rate, and intonation. Since these properties relate to how the sound waves vibrate and are perceived by the human ear, these are good metrics for understanding subtle changes in the emotional states of participants. The second level of the voice analysis provides metrics of arousal, dominance, and valence. Arousal measures how passive or active a speaker sounds, dominance assesses the level of control in a speaker’s voice, and valence indicates how positive or negative a speaker sounds. The third level of analysis involves higher-order metrics that categorize the voice into positive and negative emotions such as happy, sad, angry, and neutral, based on the first two levels of voice analysis. The devAIce® model has undergone extensive testing and evaluation for correctness, robustness, fairness, and efficiency (AudEERING Gmbh, 2024). These tests ensure that the three levels of metrics are aligned correctly in testing conditions with or without background noise and with different recording quality. They also ensure that the predictions of the model are consistent across global demographics. We used the third-level analysis results to identify positive and negative voice tone-based emotions.
For both emotional measures, given that much of the data input is typically neutral (Ma et al., 2022), it is possible to use positive and negative emotions separately, which creates room for both positive and negative emotions to be present independently.
Once participants had finished their tasks with the voice assistant, they filled in a follow-up questionnaire, in which the demographics, motivations, and overall satisfaction with the VA were measured. To measure satisfaction, we used a four-item measure based on the work of Oghuma et al. (2016). All measures used 7-point bipolar scales (see Appendix 6). In the following, each study is described and reported in detail.
3.1 Study 1: the role of task pleasantness
To investigate the first set of hypotheses, we conducted a 2 (device type: VOVA vs MMVA) × 2 (task pleasantness: unpleasant task vs pleasant task) between-subjects experiment. Participants were recruited to participate in a study on interactive technology. Task pleasantness was manipulated in a similar way to Sung et al. (2023) and Cho et al. (2019). A list of 10 paired tasks was pretested with a student-convenience sample as part of a class (n = 27) and evaluated on a 7-point scale for their respective pleasantness or unpleasantness. Six pairs of tasks were evaluated similarly for their difficulty but showed significant differences in their pleasantness and thus were given to the participants during the study (see Appendix 1).
Participants were allocated at random to the pleasant or unpleasant condition and were then instructed to perform one task after the other by the VA. In case of repeated failure, they were encouraged to move on to the next task. We recruited 109 respondents for the study; after attention checks, measurement of prior VA experience, and recording revisions, 97 usable responses remained for analysis. The average age of the participants was 22.2 years, and 45% of the respondents were female,. Thirty-seven percent of the sample were undergraduate students, 40% were graduate students, and 20% were postgraduate students. We assessed the frequency of VA use on a bipolar scale from 1 (less than monthly) to 7 (several times daily), and the mean score shows that the participants on average were intermediate VA users (M = 3.35, SD = 1.96). The satisfaction scale (α = 0.85) showed good reliability.
3.1.1 Results
To investigate our hypotheses, we conducted a series of two-way ANOVAs. The analysis of satisfaction yielded nonsignificant main effects for task pleasantness (F(1,93) = 0.43, p = 0.515) and device type (F(1,93) = 0.10, p = 0.748). More importantly, a significant interaction effect was observed (F(1,93) = 5.13, p = 0.026). The pattern of results indicates that, for MMVA, pleasant tasks resulted in greater satisfaction, while for VOVA, unpleasant tasks yield higher satisfaction compared to pleasant tasks (MMMVAUT = 5.56, SD = 0.99; MMMVAPT = 5.93, SD = 0.59; MVOVAUT = 6.11, SD = 0.93; MVOVAPT = 5.63, SD = 1.14; Figure 2), which is as hypothesized. For speech content-based positive emotions, we found a significant main effect for device type (F(1,93) = 8.34, p = 0.005), a nonsignificant effect for task pleasantness (F(1,93) = 2.44, p = 0.121), and a significant interaction effect (F(1,93) = 9.49, p = 0.003). The pattern of the interaction shows positive emotions are stronger in the pleasant task conditions for MMVA, while the opposite is true in the VOVA condition, which is as hypothesized (MMMVAUT = 4.24, SD = 2.46; MMMVAPT = 6.53, SD = 1.58; MVOVAUT = 4.34, SD = 2.27; MVOVAPT = 3.59, SD = 3.16; Figure 2). For voice tone-based positive emotions, we observed a significant main effect for device type (F(1,93) = 5.65; p = 0.020), a nonsignificant effect for task pleasantness (F(1,93) = 0.01, p = 0.903), and a significant interaction effect (F(1,93) = 10.77, p = 0.001). The results show more positive emotions for MMVA in the pleasant task condition, while for VOVA the opposite pattern emerges (MMMVAUT = 4.64, SD = 4.69; MMMVAPT = 7.95, SD = 0.6.18; MVOVAUT = 5.52, SD = 4.47; MVOVAPT = 2.44, SD = 2.81; Figure 2). For negative speech content-based emotions, there were main effects for device type (F(1,93) = 8.93, p = 0.004) and task pleasantness (F(1,93) = 20.28, p = 0.000), and a nonsignificant interaction effect (F(1,93) = 1.54, p = 0.218). The results show more negative emotions for the VOVA condition, as well as for the unpleasant task. For the negative voice tone-based emotions, the results show nonsignificant effects for device type (F(1,93) = 2.51, p = 0.116), task pleasantness (F(1,93) = 0.25, p = 0.615), and the interaction (F(1,93) = 0.03, p = 0.866; figures for the results are shown in Appendix 2).
 The illustration shows three vertical bar graphs. The details of each graph are as follows: First graph (Top Center): The vertical axis of the vertical bar chart is labeled “Satisfaction” and ranges from 5.00 to 6.50 in increments of 0.5 units. The horizontal axis is labeled “User-expressed emotions,” and displays two device types: “M M V A” and “V O V A.” Each device type has two bars: the black bar represents “Unpleasant task” and the light gray bar represents “Pleasant task,” as indicated by the legend on the right. The data from the bars are as follows: M M V A: Unpleasant task: 5.56. Pleasant task: 5.93. V O V A: Unpleasant task: 6.11. Pleasant task: 5.63. The illustration shows three vertical bar graphs. The details of each graph are as follows: First graph (Top Center): The vertical axis of the vertical bar chart is labeled “Satisfaction” and ranges from 5.00 to 6.50 in increments of 0.5 units. The horizontal axis is labeled “User-expressed emotions,” and displays two device types: “M M V A” and “V O V A.” Each device type has two bars: the black bar represents “Unpleasant task” and the light gray bar represents “Pleasant task,” as indicated by the legend on the right. The data from the bars are as follows: M M V A: Unpleasant task: 5.56. Pleasant task: 5.93. V O V A: Unpleasant task: 6.11. Pleasant task: 5.63. A horizontal bar and asterisks are shown above the bars. Second graph (Bottom left): The vertical axis of the vertical bar chart is labeled “Positive voice tone” and ranges from 2.00 to 8.00 in increments of 1.0 units. The horizontal axis displays two device types: “M M V A” and “V O V A.” Each device type has two bars: the black bar represents “Unpleasant task” and the light gray bar represents “Pleasant task.” The data from the bars are as follows: M M V A: Unpleasant task: 4.64. Pleasant task: 7.95. V O V A: Unpleasant task: 5.52. Pleasant task: 2.44. A horizontal bar and double asterisks are shown above the bars. Third graph (Bottom right): The vertical axis of the vertical bar chart is labeled “Positive speech content” and ranges from 2.00 to 7.00 in increments of 1.0 units. The horizontal axis displays two device types: “M M V A” and “V O V A.” Each device type has two bars: the black bar represents “Unpleasant task” and the light gray bar represents “Pleasant task.” The data from the bars are as follows: M M V A: Unpleasant task: 4.24. Pleasant task: 6.53. V O V A: Unpleasant task: 4.34. Pleasant task: 3.59. A horizontal bar and Triple asterisks appear above M M V A, and A horizontal bar and “n.s.” appear above V O V A. The text below the common legend at the bottom right of the first graph explains: triple asterisk p less than 0.01, double asterisk p less than 0.05, asterisk p less than 0.1.
Results for Study 1; Source(s): Created by the authors
The illustration shows three vertical bar graphs. The details of each graph are as follows: First graph (Top Center): The vertical axis of the vertical bar chart is labeled “Satisfaction” and ranges from 5.00 to 6.50 in increments of 0.5 units. The horizontal axis is labeled “User-expressed emotions,” and displays two device types: “M M V A” and “V O V A.” Each device type has two bars: the black bar represents “Unpleasant task” and the light gray bar represents “Pleasant task,” as indicated by the legend on the right. The data from the bars are as follows: M M V A: Unpleasant task: 5.56. Pleasant task: 5.93. V O V A: Unpleasant task: 6.11. Pleasant task: 5.63. The illustration shows three vertical bar graphs. The details of each graph are as follows: First graph (Top Center): The vertical axis of the vertical bar chart is labeled “Satisfaction” and ranges from 5.00 to 6.50 in increments of 0.5 units. The horizontal axis is labeled “User-expressed emotions,” and displays two device types: “M M V A” and “V O V A.” Each device type has two bars: the black bar represents “Unpleasant task” and the light gray bar represents “Pleasant task,” as indicated by the legend on the right. The data from the bars are as follows: M M V A: Unpleasant task: 5.56. Pleasant task: 5.93. V O V A: Unpleasant task: 6.11. Pleasant task: 5.63. A horizontal bar and asterisks are shown above the bars. Second graph (Bottom left): The vertical axis of the vertical bar chart is labeled “Positive voice tone” and ranges from 2.00 to 8.00 in increments of 1.0 units. The horizontal axis displays two device types: “M M V A” and “V O V A.” Each device type has two bars: the black bar represents “Unpleasant task” and the light gray bar represents “Pleasant task.” The data from the bars are as follows: M M V A: Unpleasant task: 4.64. Pleasant task: 7.95. V O V A: Unpleasant task: 5.52. Pleasant task: 2.44. A horizontal bar and double asterisks are shown above the bars. Third graph (Bottom right): The vertical axis of the vertical bar chart is labeled “Positive speech content” and ranges from 2.00 to 7.00 in increments of 1.0 units. The horizontal axis displays two device types: “M M V A” and “V O V A.” Each device type has two bars: the black bar represents “Unpleasant task” and the light gray bar represents “Pleasant task.” The data from the bars are as follows: M M V A: Unpleasant task: 4.24. Pleasant task: 6.53. V O V A: Unpleasant task: 4.34. Pleasant task: 3.59. A horizontal bar and Triple asterisks appear above M M V A, and A horizontal bar and “n.s.” appear above V O V A. The text below the common legend at the bottom right of the first graph explains: triple asterisk p less than 0.01, double asterisk p less than 0.05, asterisk p less than 0.1.Results for Study 1; Source(s): Created by the authors
To test our hypotheses comprehensively, we ran one moderated mediation analysis (Model 8, 90% CI, 5,000 bootstraps; Hayes, 2017), which included task valence (pleasant vs unpleasant) as the independent variable (X), device type as the moderator (W, MMVA vs VOVA) and all four measures for emotions as mediators (M1-M4; positive voice tone and speech content, negative voice tone and speech content) to explain satisfaction, the dependent variable (Y; see Table 2 for an overview of the full analysis). The results show that the positive voice tone-based emotions have a mediating role in explaining satisfaction. The index of moderated mediation (b = 0.22, 90% CI [0.01, 0.49]) and the indirect effect for both MMVA (b = −0.11, 90% CI [−0.29, 0.01]) and VOVA (b = 0.11, 90% CI [0.0001, 0.25]) provide partial support for H1a and H1b. For the positive speech content-based emotions, no mediating results were obtained (b = 0.08, 90% CI [−0.13, 0.55]). Similarly, no mediating effect was found for the negative emotions from voice tone (b = 0.02, 90% CI [−0.07, 0.12]) or speech content (b = −0.10, 90% CI [−0.29, 0.03]). In conclusion, the results of Study 1 provide partial support for our hypotheses, in that a pleasant task carried out via an MMVA seems to trigger stronger positive emotions as well as higher satisfaction, while an unpleasant task carried out via a VOVA shows higher positive emotions and more satisfaction. This holds for both speech-content and voice-tone emotions, but only the voice tone-based positive emotions are significant in explaining differences in satisfaction.
Moderated mediation, Study 1
| Study 1: Moderated mediation (Model 8) | ||||||||||||||||||||
|---|---|---|---|---|---|---|---|---|---|---|---|---|---|---|---|---|---|---|---|---|
| M1 (positive speech content) | M2 (negative speech content) | M3 (positive voice tone) | M4 (negative voice tone) | Y (satisfaction) | ||||||||||||||||
| Antecedent | Coefficient | SE | t | p | Coefficient | SE | t | p | Coefficient | SE | t | p | Coefficient | SE | t | p | Coefficient | SE | t | p |
| X (Task valence) | −5.35 | 1.51 | −3.54 | 0.001*** | 0.11 | 0.85 | 0.12 | 0.901 | −9.71 | 3.06 | −3.17 | 0.002*** | 10.28 | 5.28 | 1.95 | 0.055* | −0.66 | 0.71 | −0.93 | 0.354 |
| M1 (Positive speech content) | 0.03 | 0.04 | 0.59 | 0.560 | ||||||||||||||||
| M2 (Negative speech content) | −0.11 | 0.08 | −1.35 | 0.179 | ||||||||||||||||
| M3 (Positive voice tone) | 0.04 | 0.02 | 1.66 | 0.099* | ||||||||||||||||
| M4 (Negative voice tone) | 0.00 | 0.01 | −0.30 | 0.765 | ||||||||||||||||
| W (Device type) | −6.18 | 1.50 | −4.12 | 0.000*** | −0.44 | 0.84 | −0.52 | 0.605 | −11.91 | 3.04 | −3.92 | 0.002*** | 7.05 | 5.25 | 1.34 | 0.182 | −0.59 | 0.73 | −0.81 | 0.420 |
| X*W | 3.24 | 0.96 | 3.38 | 0.001*** | 0.94 | 0.54 | 1.75 | 0.084* | 6.39 | 1.95 | 3.28 | 0.002*** | −3.81 | 3.36 | −1.13 | 0.260 | 0.63 | 0.45 | 1.39 | 0.168 |
| Constant | 14.81 | 2.36 | 6.29 | 0.000*** | 0.86 | 1.32 | 0.65 | 0.520 | 23.17 | 4.78 | 4.85 | 0.000*** | 4.26 | 8.25 | 0.51 | 0.606 | 6.33 | 1.29 | 4.90 | 0.000*** |
| Model summary | R2 | 0.19 | R2 | 0.34 | R2 | 0.16 | R2 | 0.10 | R2 | 0.11 | ||||||||||
| F (3, 90) | 6.96 | F (3, 90) | 15.7 | F (3, 90) | 5.72 | F (3, 90) | 3.16 | F (7, 86) | 1.50 | |||||||||||
| Moderated mediation M1 (Positive speech content) | Index: 0.08 | BootSE: 0.17 | BootLICI: −0.125 | BootULCI: 0.436 | ||||||||||||||||
| Moderated mediation M2 (Negative speech content) | Index: −0.10 | BootSE: 0.11 | BootLICI: −0.297 | BootULCI: 0.033 | ||||||||||||||||
| Moderated mediation M3 (Positive voice tone) | Index: 0.23 | BootSE: 0.15 | BootLICI: 0.019 | BootULCI: 0.492 | ||||||||||||||||
| Moderated mediation M4 (Negative voice tone) | Index: 0.01 | BootSE: 0.06 | BootLICI: −0.074 | BootULCI: 0.122 | ||||||||||||||||
Note(s): p < 0.01***, <0.05**, <0.1*
3.2 Study 2: the role of task complexity
For the second study, another 2 (device type: VOVA vs MMVA) × 2 (task complexity: simple task vs complex task) between-subjects experiment was carried out. As in Study 1, participants were recruited to participate in a study to test innovative technology. Task complexity was manipulated via a set of paired tasks that were similar in terms of topic but different in their level of complexity or difficulty. Tasks were chosen along the typical VA interaction dimensions and consisted of requests for information, planning, and entertainment; the level of complexity was manipulated by enhancing the scope of the task and also leaving room for interpretation and opinion (Faruk et al., 2023). We pretested them using an MTurk sample of 45 responses that were compensated $0.50 for participation, and the paired tasks were evaluated in terms of task complexity. This resulted in ten pairs of tasks that showed significant differences in their complexity (see Appendix 3). For instance, a simple task asked for the opening times of a popular tourist attraction, while the complex task asked for information on why this particular tourist attraction was special and worth visiting (MST = 2.17; MCT = 3.53; t(44) = −3.82, p < 0.001).
Given that the simple tasks were expected to be completed more quickly than the complex tasks, we gave participants a time window of 4 min in which to complete as many tasks as they could, without telling them beforehand, so that they did not feel any time pressure. Therefore, the task order was randomized to make sure that no order effects occurred. We recruited 106 respondents, and after controlling for attention checks, prior VA usage, and functional voice recordings, 97 respondents were suitable for analysis. Of the respondents, 57% were female, and the average age was 22.7 years. In terms of education, 30% were undergraduate students, 50% were master’s students, and 20% were doctoral students. We evaluated VA user experience as in Study 1, and the average experience was intermediate (M = 3.29, SD = 1.75). In the simple task condition, participants completed on average 8.3 tasks, while in the complex condition, participants completed on average 5.6 tasks.
3.2.1 Results
For satisfaction, we found a significant main effect for device type (F(1,93) = 6.57, p = 0.012), indicating higher overall satisfaction with MMVA, as well as a nonsignificant effect for task complexity (F(1,93) = 1.83, p = 0.180). Most importantly, the interaction of device type and task complexity was significant (F(1,93) = 5.48, p = 0.021), indicating higher satisfaction for VOVA with simple tasks than with complex tasks and a nonsignificant effect for MMVA, which provides support for H2b, but not H2a (MMMVAST = 5.18, SD = 1.30; MMMVACT = 5.43, SD = 1.41; MVOVAST = 5.12, SD = 1.35; MVOVACT = 4.16, SD = 1.06; Figure 3). For speech content-based negative emotions, we find a significant main effect for device type (F(1,93) = 57.34, p = 0.000), indicating more negative emotions for VOVA. The main effect for task complexity was nonsignificant (F(1,93) = 1.40, p = 0.239), but the interaction effect was significant (F(1,93) = 11.18, p = 0.001). The results indicate more negative emotions for VOVA in the complex task scenario, while for MMVA the effect is reversed, which is as hypothesized (MMMVAST = 3.56, SD = 4.42; MMMVACT = 1.37, SD = 2.18; MVOVAST = 7.90, SD = 4.67; MVOVACT = 12.54, SD = 7.13; Figure 3). For voice tone-based negative emotions, the results yield a significant main effect for device type (F(1,93) = 12.08, p = 0.001), indicating more negative emotions for VOVA in general, a nonsignificant effect for task complexity (F(1,93) = 0.31, p = 0.574), and a significant interaction effect (F(1,93) = 11.96, p = 0.001). The pattern of the interaction shows a similar structure to the voice tone-based emotions, as proposed in the hypotheses (MMMVAST = 2.09, SD = 1.74; MMMVACT = 0.70, SD = 1.14; MVOVAST = 2.10, SD = 1.09; MVOVACT = 4.03, SD = 3.89; Figure 3). For positive speech content-based emotions, the results show nonsignificant effects for device type (F(1,93) = 0.02, p = 0.897), task complexity (F(1,93) = 0.00, p = 0.979), and the interaction effect (F(1,93) = 0.63, p = 0.431). For voice tone-based positive emotions, we find a main effect of device type (F(1,93) = 15.02, p = 0.000) and for task complexity (F(1,93) = 14.83, p = 0.000), indicating more positive emotions for VOVA, as well as for the complex tasks. The interaction effect is nonsignificant (F(1,93) = 0.04, p = 0.838) ( Appendix 4).
 The illustration shows three vertical bar graphs. The details of each graph are as follows: First graph (Top Center): The vertical axis of the vertical bar chart is labeled “Satisfaction” and ranges from 3.00 to 6.00 in increments of 0.5 units. The horizontal axis is labeled “User-expressed emotions,” and displays two device types: “M M V A” and “V O V A.” Each device type has two bars: the black bar represents “Simple task” and the light gray bar represents “Complex task,” as indicated by the legend on the right. The data from the bars are as follows: M M V A: Simple task: 5.13. Complex task: 5.48. V O V A: Simple task: 5.30. Complex task: 4.26. A horizontal bar and the label “n.s.” appear above M M V A. A horizontal bar and triple asterisks appear above V O V A. Second graph (Bottom left): The vertical axis of the vertical bar chart is labeled “Negative voice tone” and ranges from 0.00 to 6.00 in increments of 2.0 units. The horizontal axis displays two device types: “M M V A” and “V O V A.” Each device type has two bars: the black bar represents “Simple task” and the light gray bar represents “Complex task.” The data from the bars are as follows: M M V A: Simple task: 2.09. Complex task: 0.70. V O V A: Simple task: 2.10. Complex task: 4.03. A horizontal bar and triple asterisks appear above both M M V A and V O V A. Third graph (Bottom right): The vertical axis of the vertical bar chart is labeled “Negative speech content” and ranges from 0.00 to 14.00 in increments of 2.0 units. The horizontal axis displays two device types: “M M V A” and “V O V A.” Each device type has two bars: the black bar represents “Simple task” and the light gray bar represents “Complex task.” The data from the bars are as follows: M M V A: Simple task: 3.58. Complex task: 1.37. V O V A: Simple task: 7.90. Complex task: 12.54. A horizontal bar and double asterisks appear above M M V A. A horizontal bar and triple asterisks appear above V O V A. The text below the common legend at the bottom right of the first graph explains: triple asterisk p less than 0.01, double asterisk p less than 0.05, asterisk p less than 0.1.
Results for Study 2; Source(s): Created by the authors
The illustration shows three vertical bar graphs. The details of each graph are as follows: First graph (Top Center): The vertical axis of the vertical bar chart is labeled “Satisfaction” and ranges from 3.00 to 6.00 in increments of 0.5 units. The horizontal axis is labeled “User-expressed emotions,” and displays two device types: “M M V A” and “V O V A.” Each device type has two bars: the black bar represents “Simple task” and the light gray bar represents “Complex task,” as indicated by the legend on the right. The data from the bars are as follows: M M V A: Simple task: 5.13. Complex task: 5.48. V O V A: Simple task: 5.30. Complex task: 4.26. A horizontal bar and the label “n.s.” appear above M M V A. A horizontal bar and triple asterisks appear above V O V A. Second graph (Bottom left): The vertical axis of the vertical bar chart is labeled “Negative voice tone” and ranges from 0.00 to 6.00 in increments of 2.0 units. The horizontal axis displays two device types: “M M V A” and “V O V A.” Each device type has two bars: the black bar represents “Simple task” and the light gray bar represents “Complex task.” The data from the bars are as follows: M M V A: Simple task: 2.09. Complex task: 0.70. V O V A: Simple task: 2.10. Complex task: 4.03. A horizontal bar and triple asterisks appear above both M M V A and V O V A. Third graph (Bottom right): The vertical axis of the vertical bar chart is labeled “Negative speech content” and ranges from 0.00 to 14.00 in increments of 2.0 units. The horizontal axis displays two device types: “M M V A” and “V O V A.” Each device type has two bars: the black bar represents “Simple task” and the light gray bar represents “Complex task.” The data from the bars are as follows: M M V A: Simple task: 3.58. Complex task: 1.37. V O V A: Simple task: 7.90. Complex task: 12.54. A horizontal bar and double asterisks appear above M M V A. A horizontal bar and triple asterisks appear above V O V A. The text below the common legend at the bottom right of the first graph explains: triple asterisk p less than 0.01, double asterisk p less than 0.05, asterisk p less than 0.1.Results for Study 2; Source(s): Created by the authors
To test our hypotheses comprehensively, we ran a moderated mediation analysis (Model 8, 90% CI, 5,000 bootstraps; Hayes, 2017), which was specified similarly to study 1, using the positive and negative emotions, both from speech content and voice tone as potential mediators (M1-M4; see Table 3) and defining the task complexity as the independent variable (X), device type as the moderator (W) and satisfaction as the dependent variable (Y). The results show that the negative voice tone-based emotions mediate the effect of task complexity and device type on satisfaction.
Moderated mediation, Study 2
| Study 2: Moderated mediation (Model 8) | ||||||||||||||||||||
|---|---|---|---|---|---|---|---|---|---|---|---|---|---|---|---|---|---|---|---|---|
| M1 (positive speech content) | M2 (negative speech content) | M3 (positive voice tone) | M4 (negative voice tone) | Y (satisfaction) | ||||||||||||||||
| Antecedent | Coefficient | SE | t | p | Coefficient | SE | t | p | Coefficient | SE | t | p | Coefficient | SE | t | p | Coefficient | SE | t | p |
| X (Task complexity) | −1.18 | 1.66 | 0.71 | 0.477 | 11.48 | 3.21 | 3.58 | 0.001*** | 3.13 | 3.03 | 1.03 | 0.305 | 5.25 | 1.50 | 3.49 | 0.001*** | −1.22 | 0.91 | −1.34 | 0.182 |
| M1 (Positive speech content) | 0.00 | 0.05 | 0.08 | 0.938 | ||||||||||||||||
| M2 (Negative speech content) | −0.01 | 0.03 | −0.24 | 0.813 | ||||||||||||||||
| M3 (Positive voice tone) | 0.01 | 0.03 | 0.26 | 0.799 | ||||||||||||||||
| M4 (Negative voice tone) | −0.17 | 0.06 | −3.06 | 0.003*** | ||||||||||||||||
| W (Device type) | −0.76 | 1.69 | −0.45 | 0.651 | 2.52 | 3.26 | 0.77 | 0.443 | −4.34 | 3.08 | −1.41 | 0.163 | 3.31 | 1.53 | 2.16 | 0.033** | −0.54 | 0.85 | 0.64 | 0.524 |
| X*W | 0.80 | 1.06 | 0.76 | 0.449 | −6.85 | 2.05 | −3.34 | 0.001*** | 0.40 | 1.93 | 0.20 | 0.838 | −3.32 | 0.96 | −3.46 | 0.001*** | 0.60 | 0.58 | 1.04 | 0.303 |
| Constant | 6.19 | 2.67 | 2.32 | 0.022** | 0.75 | 5.16 | 0.15 | 0.885 | 9.00 | 4.88 | 1.85 | 0.068 | −3.14 | 2.42 | −1.30 | 0.198 | 6.62 | 1.36 | 4.87 | 0.000*** |
| Model summary | R2 | 0.01 | R2 | 0.44 | R2 | 0.25 | R2 | 0.21 | R2 | 0.22 | ||||||||||
| F (3, 93) | 0.44 | F (3, 93) | 24.26 | F (3, 93) | 10.47 | F (3, 93) | 8.48 | F (7, 89) | 3.63 | |||||||||||
| Moderated mediation M1 (Positive speech content) | Index: 0.00 | BootSE: 0.07 | BootLLCI: −0.120 | BootULCI: 0.110 | ||||||||||||||||
| Moderated mediation M2 (Negative speech content) | Index: 0.04 | BootSE: 0.19 | BootLLCI: −0.289 | BootULCI: 0.326 | ||||||||||||||||
| Moderated mediation M3 (Positive voice tone) | Index: 0.00 | BootSE: 0.06 | BootLLCI: −0.096 | BootULCI: 0.095 | ||||||||||||||||
| Moderated mediation M4 (Negative voice tone) | Index: 0.57 | BootSE: 0.21 | BootLLCI: 0.270 | BootULCI: 0.940 | ||||||||||||||||
Note(s): p < 0.005***, <0.05**, <0.1*
The index of moderated mediation (b = 0.57, 90% CI [0.27, 0.94]) and the indirect effect for both MMVA (b = −0.33, 90% CI [−0.55, −0.12]) and VOVA (b = 0.23, 90% CI [0.08, 0.49]) provide partial support for H2a and H2b. For the negative speech content-based emotions, no mediation was found (b = 0.04, 90% CI [−0.29, 0.33]), which does not support the hypotheses. Additionally, the positive emotions showed no mediating effect for speech content (b = 0.003, 90% CI [−0.12, 0.11]) or for voice tone (b = 0.002, 90% CI [−0.10, 0.09]). In conclusion, in Study 2 we find that satisfaction for simple tasks is higher than for complex tasks on VOVA, while complex tasks yield higher satisfaction on MMVA. This effect can be explained by reduced levels of negative voice tone-based emotions in the respective conditions. While speech content-based emotions are affected in a similar way, no mediating effect to satisfaction is found.
3.3 Study 3: the role of device anthropomorphism
We conducted a 2 (device type: VOVA vs MMVA) × 2 (anthropomorphism: anthropomorphized vs nonanthropomorphized) between-subjects experiment to test our third set of hypotheses. Respondents were recruited under the cover story that they were trying a new beta version of a soon to be launched product. The degree of anthropomorphism of the VA was manipulated using a vignette describing the VA either as an empathic humanlike assistant by the name of Charlie or as a highly efficient technology device by the name of VA_2040, followed by a short paragraph assigning humanlike or machinelike attributes to the device. We pretested the manipulation on MTurk for a compensation of $0.50, with 78 participants using 7-point semantic differential scales. The results show that the description of the devices had an effect on humanlike (vs machinelike) perception of participants (t(77) = −2.69, p = 0.008), as well as for artificial (vs lifelike) (t(77) = 2.13, p = 0.032) and unconscious (vs conscious) (t(77) = 1,78, p = 0.079) ratings of the device, providing confidence in the manipulation. Respondents were then asked to have a free conversation with the VA for around 5 min, for which several suggestions were given (e.g. ask for things to do this evening, for the location of certain places, or to listen to music). Once respondents had completed their interaction, they filled in the questionnaire. In total, 120 respondents were recruited; after attention checks, controlling for prior VA experience, and a revision of the recordings, 109 respondents remained for analysis. Of the participants, 55% were female; 46% were undergraduate students, 45% graduate students, and 9% doctoral students. The average age of the sample was 21.8 years. The prior VA experience of the participants was again at an intermediate level (M = 3.63, SD = 1.94).
3.3.1 Results
We conducted a series of two-way ANOVAs to test the initial results of our manipulations on the variables of interest. For satisfaction, we find nonsignificant main effects for device type (F(1,105) = 0.12, p = 0.735) and anthropomorphism (F(1,105) = 0.17, p = 0.683), and a significant interaction effect (F(1,105) = 5.76, p = 0.018). The pattern of the results reveals that, for VOVA, a nonanthropomorphized device yields to higher satisfaction, while the opposite is true for MMVA, which supports H3a and H3b (MMMVANA = 4.93, SD = 1.21; MMMVAA = 5.36, SD = 1.22; MVOVANA = 5.52, SD = 0.91; MVOVAA = 4.91, SD = 1.14; Figure 4). When looking at the results for positive speech content-based emotions, we find nonsignificant main effects for device type (F(1,105) = 1.79 p = 0.183) and anthropomorphism (F(1,105) = 0.00, p = 0.996), and yet there is a significant interaction effect (F(1,105) = 9.62, p = 0.002), which follows a similar pattern as the effect for satisfaction (MMMVANA = 13.85, SD = 4.58; MMMVAA = 16.17, SD = 3.23; MVOVANA = 15.17, SD = 3.37; MVOVAA = 12.86, SD = 4.18; Figure 4), which is as hypothesized. For positive voice tone emotions, in contrast, we found a significant main effect for device type, indicating more positive emotions for MMVA (F(1,105) = 24.71, p = 0.000), but no significant effect for anthropomorphism (F(1,105) = 0.17 p = 0.680) or the interaction (F(1, 105) = 0.47, p = 0.496). For the negative emotions from speech content, the effects were nonsignificant for device type (F(1,105) = 0.32, p = 0.574), anthropomorphism (F(1,105) = 0.99, p = 0.3221), and the interaction (F(1,105) = 0.38, p = 0.541). Similarly, voice-based negative emotions were not affected by device type (F(1,105) = 2.33 p = 0.130), by anthropomorphism (F(1,105) = 0.29, p = 0.593), or by the interaction (F(1,105) = 3.14, p = 0.079; Appendix 5). In the moderated mediation analysis (Model 8; Hayes, 2017; Table 4 for details) analogously to study 1 and 2 we included the speech content and voice tone measures for both positive and negative emotions as the mediators (M1-M4), anthropomorphism was the independent variable (X) and device type was the moderator (W), while satisfaction was the dependent variable (Y).
 The illustration shows three vertical bar graphs. The details of each graph are as follows: First graph (Top Center): The vertical axis of the vertical bar chart is labeled “Satisfaction” and ranges from 4.50 to 6.00 in increments of 0.5 units. The horizontal axis is labeled “User-expressed emotions,” and displays two device types: “M M V A” and “V O V A.” Each device type has two bars: the black bar represents “Nonanthropomorphized” and the light gray bar represents “Anthropomorphized,” as indicated by the legend on the right. The data from the bars are as follows: M M V A: Nonanthropomorphized: 4.93. Anthropomorphized: 5.36. V O V A: Nonanthropomorphized: 5.52. Anthropomorphized: 4.91. A horizontal bar and asterisk appear above M M V A, and a horizontal bar and double asterisks appear above V O V A. Second graph (Bottom left): The vertical axis of the vertical bar chart is labeled “Positive voice tone” and ranges from 5.00 to 15.00 in increments of 2.0 units. The horizontal axis displays two device types: “M M V A” and “V O V A.” Each device type has two bars: the black bar represents “Nonanthropomorphized” and the light gray bar represents “Anthropomorphized.” The data from the bars are as follows: M M V A: Nonanthropomorphized: 7.89. Anthropomorphized: 7.62. V O V A: Nonanthropomorphized: 12.08. Anthropomorphized: 13.16. A horizontal bar and “n.s.” appear above both M M V A and V O V A. Third graph (Bottom right): The vertical axis of the vertical bar chart is labeled “Positive speech content” and ranges from 10.00 to 17.00 in increments of 1.0 units. The horizontal axis displays two device types: “M M V A” and “V O V A.” Each device type has two bars: the black bar represents “Nonanthropomorphized” and the light gray bar represents “Anthropomorphized.” The data from the bars are as follows: M M V A: Nonanthropomorphized: 13.85. Anthropomorphized: 16.17. V O V A: Nonanthropomorphized: 15.17. Anthropomorphized: 12.86. A horizontal bar and double asterisks appear above both M M V A and V O V A. The text below the common legend at the bottom right of the first graph explains: triple asterisk p less than 0.01, double asterisk p less than 0.05, asterisk p less than 0.1.
Results for Study 3; Source(s): Created by the authors
The illustration shows three vertical bar graphs. The details of each graph are as follows: First graph (Top Center): The vertical axis of the vertical bar chart is labeled “Satisfaction” and ranges from 4.50 to 6.00 in increments of 0.5 units. The horizontal axis is labeled “User-expressed emotions,” and displays two device types: “M M V A” and “V O V A.” Each device type has two bars: the black bar represents “Nonanthropomorphized” and the light gray bar represents “Anthropomorphized,” as indicated by the legend on the right. The data from the bars are as follows: M M V A: Nonanthropomorphized: 4.93. Anthropomorphized: 5.36. V O V A: Nonanthropomorphized: 5.52. Anthropomorphized: 4.91. A horizontal bar and asterisk appear above M M V A, and a horizontal bar and double asterisks appear above V O V A. Second graph (Bottom left): The vertical axis of the vertical bar chart is labeled “Positive voice tone” and ranges from 5.00 to 15.00 in increments of 2.0 units. The horizontal axis displays two device types: “M M V A” and “V O V A.” Each device type has two bars: the black bar represents “Nonanthropomorphized” and the light gray bar represents “Anthropomorphized.” The data from the bars are as follows: M M V A: Nonanthropomorphized: 7.89. Anthropomorphized: 7.62. V O V A: Nonanthropomorphized: 12.08. Anthropomorphized: 13.16. A horizontal bar and “n.s.” appear above both M M V A and V O V A. Third graph (Bottom right): The vertical axis of the vertical bar chart is labeled “Positive speech content” and ranges from 10.00 to 17.00 in increments of 1.0 units. The horizontal axis displays two device types: “M M V A” and “V O V A.” Each device type has two bars: the black bar represents “Nonanthropomorphized” and the light gray bar represents “Anthropomorphized.” The data from the bars are as follows: M M V A: Nonanthropomorphized: 13.85. Anthropomorphized: 16.17. V O V A: Nonanthropomorphized: 15.17. Anthropomorphized: 12.86. A horizontal bar and double asterisks appear above both M M V A and V O V A. The text below the common legend at the bottom right of the first graph explains: triple asterisk p less than 0.01, double asterisk p less than 0.05, asterisk p less than 0.1.Results for Study 3; Source(s): Created by the authors
Moderated mediation, Study 3
| Study 3: Moderated mediation (Model 8) | ||||||||||||||||||||
|---|---|---|---|---|---|---|---|---|---|---|---|---|---|---|---|---|---|---|---|---|
| M1 (positive speech content) | M2 (negative speech content) | M3 (positive voice tone) | M4 (negative voice tone) | Y (satisfaction) | ||||||||||||||||
| Antecedent | Coefficient | SE | t | p | Coefficient | SE | t | p | Coefficient | SE | t | p | Coefficient | SE | t | p | Coefficient | SE | t | p |
| X (Device anthropomorphism) | 7.04 | 2.46 | 2.86 | 0.795 | 0.35 | 0.55 | 0.64 | 0.526 | −1.60 | 6.37 | −0.25 | 0.803 | 3.05 | 2.02 | 1.51 | 0.135 | 2.26 | 0.74 | 3.07 | 0.003*** |
| M1 (Positive speech content) | −0.06 | 0.03 | −2.01 | 0.037** | ||||||||||||||||
| M2 (Negative speech content) | 0.03 | 0.13 | 0.27 | 0.791 | ||||||||||||||||
| M3 (Positive voice tone) | 0.01 | 0.01 | 0.49 | 0.622 | ||||||||||||||||
| M4 (Negative voice tone) | 0.00 | 0.04 | 0.03 | 0.975 | ||||||||||||||||
| W (Device type) | 10.83 | 3.97 | 2.73 | 0.008*** | 0.76 | 0.89 | 0.85 | 0.399 | 4.53 | 10.27 | 0.44 | 0.660 | 6.63 | 3.26 | 2.03 | 0.045** | 3.86 | 1.18 | 3.26 | 0.002*** |
| X*W | −4.72 | 1.55 | −3.04 | 0.003*** | −0.34 | 0.35 | −0.98 | 0.329 | 1.71 | 4.02 | 0.43 | 0.671 | −2.26 | 1.28 | −1.77 | 0.080* | −1.56 | 0.47 | −3.33 | 0.001*** |
| Constant | −1.63 | 6.24 | −0.26 | 0.795 | 0.60 | 1.40 | 0.43 | 0.671 | 13.59 | 16.15 | 0.84 | 0.402 | −4.61 | 5.13 | −0.90 | 0.371 | 0.39 | 1.78 | 0.22 | 0.828 |
| Model summary | R2 | 0.10 | R2 | 0.02 | R2 | 0.17 | R2 | 0.05 | R2 | 0.12 | ||||||||||
| F (3, 99) | 3.62 | F (3, 99) | 0.75 | F (3, 99) | 6.68 | F (3, 99) | 1.88 | F (7, 95) | 1.87 | |||||||||||
| Moderated mediation M1 (Positive speech content) | Index: 0.30 | BootSE: 0.16 | BootLICI: 0.069 | BootULCI: 0.571 | ||||||||||||||||
| Moderated mediation M2 (Negative speech content) | Index: −0.01 | BootSE: 0.07 | BootLICI: −0.138 | BootULCI: 0.076 | ||||||||||||||||
| Moderated mediation M3 (Positive voice tone) | Index: 0.01 | BootSE: 0.05 | BootLICI: −0.080 | BootULCI: 0.080 | ||||||||||||||||
| Moderated mediation M4 (Negative voice tone) | Index: 0.00 | BootSE: 0.09 | BootLICI: −0.149 | BootULCI: 0.137 | ||||||||||||||||
Note(s): p < 0.005***, <0.05**, <0.1*
We find a significant path from device type via positive speech-content emotions to satisfaction, showing a significant index of moderated mediation (b = 0.29, 90% CI [0.06, 0.57]). The indirect effects for both MMVA (b = −0.14, 90% CI [−0.32, −0.01]) and VOVA (b = 0.15, 90% CI [0.02, 0.31]) were significant, giving partial support to H3a and H3b (see Table 4). For positive voice tone emotions (b = 0.01, 90% CI [−0.08, 0.08]), no effects were found, and thus no support was given for the hypotheses. For negative speech content (b = −0.01, 90% CI [−0.14, 0.08]) and voice tone (b = −0.003, 90% CI [−0.15, 0.14]), no significant mediation results were obtained. In conclusion, Study 3 shows that the device positioning interacts with the device type, yielding higher positive speech-content emotions and satisfaction for an anthropomorphized MMVA and for a nonanthropomorphized VOVA, which partially supports our hypotheses.
4. Discussion
In summary, we show by means of three empirical studies that the emotions experienced by a user during a VA interaction can explain satisfaction, and that both the device type and the usage context interact to impact user satisfaction when using a VA. Our results indicate that it is beneficial to measure emotions both via voice tone and via speech content, as both emotional dimensions are impacted by the usage context and the device type, and both can be useful for predicting user satisfaction (see Figure 1).
In greater detail, we find that pleasant tasks lead to higher satisfaction for MMVA, whereas unpleasant tasks lead to greater satisfaction for VOVA. The moderated mediation results show that positive voice-tone emotions were able to explain this effect. Users express more positive emotions for a pleasant task on MMVA, while the opposite is true for VOVA. Second, we find that, for task complexity, individuals are more satisfied when they solve complex tasks through MMVA and simple tasks through VOVA. The results also show that negative emotions measured via voice-tone mediated this effect in such a way that reduced negative emotions drove higher levels of satisfaction. In terms of anthropomorphism, our results show that individuals express higher satisfaction with MMVA when it is anthropomorphized and with VOVA when it is nonanthropomorphized. This relationship is mediated by positive speech-content emotions and shows that more positively expressed emotions yield higher satisfaction.
A particularly interesting finding is the differential effect of voice tone-based emotions or speech content-based emotions on satisfaction. For the different task dimensions (Studies 1 and 2), we find that the voice tone is the driving factor in predicting satisfaction, whereas for device anthropomorphism the speech content is pivotal.
Thus, it appears that, for task-related aspects, relevant emotions are expressed via voice-tone, while for device-related aspects, consumers articulate their emotions directly via words. It seems that when using the VA for different tasks, relevant emotions are rather articulated via voice tone, but when perceiving the device either as a machine or more like a human being, users rather change the amount of emotional words. For the task-related aspects, users use similar words, but alter their tone to articulate the emotions, while users seem to alter their language in the latter case, as the device changes its identity, similarly as people change their language when talking to different audiences (Luo et al., 2019). Our findings are summarized in Table 5.
Summary of results
| Study | Objective | n | Manipulation | Results on user satisfaction | Mediating role of user-expressed emotions | Implications |
|---|---|---|---|---|---|---|
| 1 | Test the effect of task valence (pleasant vs unpleasant) on user satisfaction using either VOVA or MMVA devices | 97 | 10 pretested tasks that were either pleasant or unpleasant needed to be solved via either a VOVA or an MMVA | On an MMVA, user satisfaction is higher for pleasant tasks than for unpleasant tasks. On VOVA, user satisfaction is higher for unpleasant than for pleasant tasks | Positive Emotions: On an MMVA, positive voice tone and positive speech content are higher for pleasant than for unpleasant tasks. On a VOVA, positive voice tone and positive speech content are higher for unpleasant than for pleasant tasks. Mediation: The interaction between task valence and device type on satisfaction is mediated by positive voice tone | MMVA are better for pleasant tasks while VOVA are better for unpleasant tasks. In both cases users express more positive emotions in their voice tone, which explains the observed results. VA makers and app producers could minimize visuals for unpleasant tasks on MMVAs and incentivize the use of additional devices such as smartphones for pleasant tasks on VOVA |
| 2 | Test the effect of task complexity (vs simplicity) on user satisfaction using either VOVA or MMVA devices | 97 | 10 pretested tasks that were either simple or complex needed to be solved via a VOVA or an MMVA. Interactions were kept constant to 4 min, and the tasks were randomized | On an MMVA, user satisfaction is similar for complex and simple tasks. On a VOVA, user satisfaction is higher for simple than for complex tasks | Negative Emotions: On an MMVA, negative voice tone and negative speech content are higher for simple than for complex tasks. On a VOVA, negative voice tone and negative speech content are higher for complex than for simple tasks. Mediation: The interaction between task complexity and device type on satisfaction is mediated by negative voice tone | MMVA can handle complex and simple tasks equally well, while VOVA are better for simple tasks. Users express fewer negative emotions in their voice tone when doing a complex task on an MMVA and when doing a simple task on a VOVA, which explains the observed results. VA makers and app producers should try to prevent frustration during complex tasks by offering visual interaction |
| 3 | Test the effect of VA-anthropomorphization (vs Non-anthropomorphization on user satisfaction using either VOVA or MMVA devices | 109 | The VOVA or the MMVA were either positioned as anthropomorphized or non-anthropomorphized products (pretested). Users then freely interacted with the device for 5 min | An anthropomorphized MMVA yields higher user satisfaction than a non-anthropomorphized MMVA. An anthropomorphized VOVA yields higher user satisfaction than a non-anthropomorphized VOVA | Positive Emotions: On an MMVA, positive speech content is higher for an anthropomorphized than for a nonanthropomorphized device On a VOVA, positive speech content is higher for can anthropomorphized than for a nonanthropomorphized device. The level of anthropomorphism does not affect positive voice tone. Mediation: The interaction between anthropomorphism and device type on satisfaction is mediated by positve speech content | Anthropomorphism for VA works better on MMVA than on VOVA. Users express more positive emotions in their speech towards an anthropomorphized MMVA and a nonanthropomorphized VOVA, which explains the observed results. VA makers and app producers can position MMVA and VOVA disfferently to reach higher user satisfaction |
4.1 Theoretical contributions
This study makes a substantive procedural contribution to the literature on user experience and voice-based consumer interaction by introducing a novel, multimodal methodological approach that captures user-expressed emotions through both voice tone and speech content. While prior research has primarily relied on self-reported emotions or unidimensional data sources such as text-based reviews (e.g. Jain et al., 2023), our study responds to recent calls for more objective and multimodal methods in capturing emotions (Hildebrand et al., 2020; Grewal et al., 2022b). By combining voice analytics and text mining, we provide a more holistic and granular assessment of user-expressed emotions, accounting for both how something is said (voice tone) and what is said (speech content).
This approach enables a more granular analysis of emotional expression, allowing us to differentiate user-expressed emotions through prosodic cues and semantic content, and to examine their respective roles in shaping user satisfaction. Importantly, our findings show that voice tone and speech content do not always yield converging results, indicating that each dimension offers unique diagnostic value in understanding users’ emotional states. This divergence underscores the need for multidimensional emotion assessments in voice-based interactions. Furthermore, our work highlights the unique affordances of voice as a communication channel in human–technology interaction: compared to text or graphical interfaces, voice offers spontaneous, rich, and emotionally expressive cues that are less filtered and more contextually grounded (Mahr and Huh, 2022). By operationalizing these features through an innovative measurement procedure, we contribute a scalable framework for advancing research on emotional dynamics in smart technologies and service encounters.
In addition to advancing measurement, this research contributes to theory by integrating cognitive appraisal theory (Watson and Spence, 2007) with a multimodal assessment of user-expressed emotions. By linking specific emotional expressions—captured via speech content and vocal tone—to the underlying cognitive appraisals triggered during VA interactions, we offer a more nuanced explanation of how and why certain emotional responses arise. This integration moves beyond existing literature that often treats emotion as a post-hoc outcome or self-reported state (e.g. Hernández-Ortega and Ferreira, 2021; Jain et al., 2023), by grounding emotional expressions in appraisals such as outcome desirability, agency, fairness, and certainty. In doing so, our study extends the use of cognitive appraisal theory by showing how objective, algorithmically derived emotion data can be used to infer appraisal-driven emotion processes in real time. This linkage of theory and method provides a more predictive framework for understanding how user emotions unfold in human–technology interactions, and how they ultimately shape satisfaction. Thus, our findings connect emerging emotion measurement techniques to an established theoretical lens, enabling deeper insights into consumer experience with voice technology.
Finally, this study offers an integrative contribution to the broader domain of voice assistant research by synthesizing disparate strands of literature on emotion measurement, device modality, and contextual task characteristics (Table 1). While prior research has often examined these dimensions in isolation, our findings reveal that user-expressed emotions—objectively captured through both speech content and vocal tone—are not only predictive of satisfaction but are also contingent on the type of voice assistant (MMVA vs VOVA) and the nature of the task (e.g. pleasant vs unpleasant, simple vs complex). This layered perspective demonstrates that the emotional impact of VA interactions is shaped by a dynamic interplay between device capabilities and situational demands. By integrating these elements into a unified framework, we contribute a more holistic understanding of how voice-based technologies shape user experience. This domain-level integration advances theory in service management, digital interaction, and emotion research by highlighting the need for multimodal, context-sensitive models when evaluating satisfaction in human–machine interactions (Grewal et al., 2022b).
4.2 Managerial implications
Our study yields various implications for VA producers, as well as for companies interested in creating VA-powered service applications. Given that our findings show the mediating role of users’ emotions during a VA interaction to predict satisfaction, VA and VA app producers could use automated sentiment analysis capabilities including automatic voice tone and speech content assessment to design and test new and better user experiences for their devices. Our study shows that tracking user-expressed emotions by measuring what was said (speech content-based) and how it was said (voice tone-based) might help to predict the user experience. As a result, VA devices might be able to react in ways that enhance positively expressed emotions and decrease negative emotions to enhance user satisfaction from the interaction. This would be a great step toward more frequent and enjoyable VA usage.
Furthermore, our findings show the advantages and disadvantages of the two most popular VA device types (VOVA and MMVA). Users prefer to accomplish pleasant tasks in a rich and joyful environment, which makes MMVA the perfect choice for such tasks. Entertainment-based apps should therefore focus on generating a rich and multisensory experience. For unpleasant tasks, it seems that consumers simply want to get them done and appreciate not being confronted with any features not necessary for the task in hand. VA app designers can make use of these findings by ensuring that interfaces for completing unpleasant tasks are kept as minimal and simple as possible to avoid frustration and in-depth thinking about the task. In either case (pleasant or unpleasant task), positive voice-based emotions drive the results.
For complex tasks, on the other hand, it seems that VOVA simply cannot display the required amount of information and therefore provokes user frustration and confusion, thus making multimodal interaction necessary. VA app designers could therefore focus on automatic integration of other devices, such as the user’s smartphone or smartwatch, when solving such tasks, in order to enhance the visual environment. For instance, a summary report of the task outcome (e.g. a list of recommendations or a graphic description) could be sent directly to another device owned by the user to enhance the experience. Interestingly, for complex tasks, the motivation to use an MMVA is not driven by positive emotions but rather by the absence of negative emotions. This means that apps dealing with complex tasks should also focus on straightforward design and ease of use rather than on having a rich and enjoyable user experience.
Finally, in relation to VA anthropomorphism, our results show that it is important that customers do not feel that they have been overpromised. A no-frills VOVA device might provoke frustration by not being able to generate the necessary level of positive emotions to make an experience believable. On the other hand, MMVA can profit from such an anthropomorphized positioning and generate a more enjoyable customer experience.
4.3 Limitations and suggestions for further research
Our research has a number of limitations that generate ideas for future research. First, despite showing the relevance of both voice tone-based and speech content-based emotions in predicting customer satisfaction, our study cannot determine in which types of situations each emotional measurement becomes more relevant and why. As outlined in the discussion, future research should investigate these questions in greater detail to identify the facilitating and inhibiting conditions for emotional expression via voice tone or speech content.
Second, the conceptualization of emotions applied in this research could be further refined. For reasons of simplicity, we distinguish only emotional valence for both speech content and voice tone, but we acknowledge the fundamental role of emotional arousal in driving consumer behavior (e.g. Herhausen et al., 2019). Future studies might take this into consideration to achieve even better and more nuanced predictions of customer satisfaction. Furthermore, using the framework established by Hildebrand et al. (2020), more fine-tuned measurements of voice-tone related emotions might help to develop a more detailed understanding of our results. Finally, our estimation for speech content focuses on explicitly articulated emotions. Recently, Luangrath et al. (2023) established a method to estimate implicit emotions based on textual information. Including such measurements would further complete the picture of user-expressed emotions.
Third, we identify two different task dimensions, which cover a broad set of potential VA uses but are by no means exhaustive. For instance, Grewal et al. (2022a) provide an interesting framework for how voice-based interactions might assist the customer decision-making process. Further research could combine the findings from our research with the outlined framework to give detailed guidance for VA-based services along the consumer decision-making process.
Fourth, because of limitations in sample sizes, we did not focus on individual differences in this study. Nonetheless, personal preferences in how information is processed have been shown to be relevant in the field of innovative digital technology adoption and usage (Hilken et al., 2017), and future research should focus on this point. Furthermore, our studies are short, one-time user experiences in a laboratory; therefore, the long-term external validity of our results is subject to further research. This is particularly relevant as real-life interactions with VAs can vary in their proximity, background noise level and recording quality, which has been shown as relevant when analyzing sound recordings (Busquet et al., 2024).
Finally, we did not manipulate the VA responses, despite evidence from the field that more empathic VAs can improve the user experience (e.g. Mari et al., 2024). Combining these findings with our contributions, future research could investigate how user-expressed emotions can be influenced by VAs that express varying degrees of empathy or emotions themselves, or by varying the conversation structure (Bergner et al., 2023). This might help to understand the potential of VAs to amplify or reduce consumer emotions via adequate responses in the case of occurrence of either positive or negative user emotions (Ma et al., 2022).
The authors thank the participants of the 2023 Frontiers in Service Conference, as well as the participants of the virtual thought leader workshop on “Rise of Voice Conversation Capabilities in Smart Service Systems” for their useful feedback.
Appendix 1
Tasks for Study 1
| Task | Pleasantness | SD | Task | Pleasantness | SD | t | df | p |
|---|---|---|---|---|---|---|---|---|
| Could you tell me a joke? | 5.41 | 1.62 | Could you tell me a sad truth? | 4.48 | 1.72 | 1.71 | 26 | <0.1 |
| What is some positive news about the climate today? | 5.63 | 1.74 | What challenges is our environment facing today? | 3.89 | 1.85 | 4.06 | 26 | <0.01 |
| What movies are playing in cinemas today in Barcelona? | 4.56 | 2.04 | Are there many thefts in Barcelona? | 3.00 | 1.84 | 2.94 | 26 | <0.01 |
| What is the price of a flight from Barcelona to Rome? | 5.11 | 1.63 | Book a dentist appointment | 4.22 | 2.06 | 2.22 | 26 | <0.05 |
| Add “Graduation” to my calendar | 5.41 | 1.87 | Add “Funeral” to my calendar | 2.11 | 1.6 | 7.56 | 26 | <0.001 |
| Play a happy song | 6.44 | 0.85 | Play a sad song | 2.89 | 1.99 | 8.00 | 26 | <0.001 |
Appendix 2 Additional graphs for negative emotions, Study 1. Source(s): Created by the authors
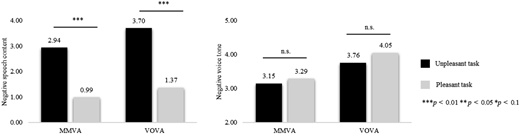
Appendix 3
Tasks for Study 2
| Task | ST | M | SD | CT | Mean | SD | t | p |
|---|---|---|---|---|---|---|---|---|
| Food | Could you find restaurants nearby? | 2.68 | 1.22 | What’s special about Catalan cuisine? | 3.37 | 1.82 | −2.02 | <0.05 |
| Sagrada Familia | What are the opening times of the Sagrada Familia in Barcelona? | 2.17 | 1.26 | Why is the Sagrada Familia a unique type of architecture? | 3.53 | 2.08 | −3.82 | <0.001 |
| Supermarket | Can you remind me to go to the supermarket this afternoon? | 2.33 | 1.26 | Can you tell me a supermarket in Barcelona that sells all the ingredients for Indian curry dishes? | 2.97 | 1.67 | −2.02 | <0.05 |
| Flights/travel | What are flight ticket prices from Barcelona to Paris next month? | 2.35 | 1.31 | What would be the best place to visit in Europe this fall? | 3.57 | 1.68 | −4.35 | <0.001 |
| Translation | How can you say “hello” in Spanish? | 2.08 | 1.22 | Can you show me how to introduce myself in Chinese? | 2.68 | 1.56 | −2.77 | <0.01 |
| Finance/stock | What is the stock value of Apple today? | 2.31 | 1.42 | What is the best stock right now to invest in and why? | 3.40 | 2.13 | −2.94 | <0.01 |
| Unit conversation | What is 6 ft in centimeters? | 2.22 | 1.27 | Can you tell me why the metric system is used more frequently than the imperial system? | 3.48 | 1.94 | −3.36 | <0.001 |
| Music | Play music | 2.40 | 1.49 | Why is rap music special? | 3.22 | 1.69 | −2.69 | <0.01 |
Appendix 4 Additional graphs for positive emotions, Study 2. Source(s): Created by the authors
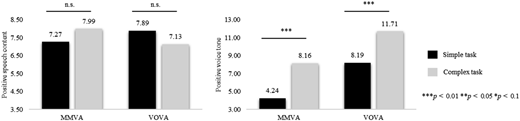
Appendix 5 Additional graphs for negative emotions, Study 3. Source(s): Created by the authors
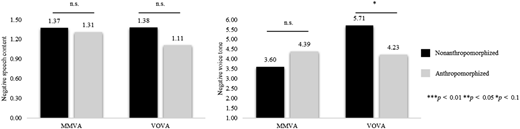
Appendix 6
Items for satisfaction
| How do you feel about your overall experience of using the voice assistant? | |
|---|---|
| Very dissatisfied (1) | (7) Very satisfied |
| Very displeased (1) | (7) Very pleased |
| Very frustrated (1) | (7) Very contented |
| Very unpleasant (1) | (7) Very pleasant |
