This paper is part II of a two-part review of automated valuation models (AVMs). Part II examines what is required for AVMs to be reliable, fair and production-ready in high-stakes valuation practice, focussing on validation, uncertainty quantification, market coverage, data enrichment including environmental, social and governance (ESG) and synthetic data, fairness and bias, and governance. Part I covers the methodological foundations, the AVM pipeline and the main model families.
The paper follows the same narrative, practitioner informed review approach set out in Part I, synthesising peer-reviewed literature, binding regulatory and professional standards, and publicly available AVM provider documentation. Findings are consolidated in an evidence map that distinguishes established, emerging and speculative claims.
The review identifies four findings. First, data quality and granularity set the upper bound of AVM performance more fundamentally than model complexity. Second, calibrated prediction intervals and periodic backtesting are prerequisites for high-stakes use. Third, ESG signals and synthetic data expand the AVM data frontier but remain governance-sensitive. Fourth, hybrid human and AVM architectures prove most resilient, aligning with empirical and regulatory expectations.
Providers should attach calibrated prediction intervals to every AVM output. Users should monitor performance through periodic backtesting and bias audits. Regulators should treat AVM governance as part of broader model risk management.
The paper offers an integrative synthesis of data, uncertainty and governance in AVMs and positions hybrid human and AVM architectures as the most defensible operating model under current regulatory expectations.
1. Introduction
Automated valuation models (AVMs) have moved from technical support systems to instruments with direct consequences for lending, portfolio management, capital allocation and market oversight. Part I of this review sets out the methodological foundations, the AVM pipeline and the main model families and situates them within the international regulatory landscape and the transparency and performance trade off. Part II turns to the conditions under which AVM outputs become reliable, fair and production ready in high stakes valuation practice.
The distinction is deliberate. Modelling choice, discussed in Part I, defines what an AVM can in principle achieve. Data foundations, validation, uncertainty quantification, fairness and governance, discussed here, define whether that potential is delivered under real deployment conditions. The recent regulatory turn (European Union, 2024; Federal Register, 2024; Bank of England, 2023) has made this second set of questions binding rather than aspirational.
Part II is structured around two guiding questions that complement those addressed in Part I:
In what ways do data availability, data quality and the integration of alternative and multimodal data sources influence AVM performance and applicability?
Which cross-cutting methodological, ethical and data-related challenges, including uncertainty, fairness and hybrid human AVM governance, shape the reliable deployment of AVMs in practice?
Sections 3–7 address these questions in turn, Section 8 acknowledges the limitations of the review and Section 9 draws implications for AVM providers, users, regulators and researchers. Part II is designed to be read independently, with cross-references to Part I where they matter.
2. Review approach
Part II follows the same review approach as Part I, to which the reader is referred for the full account of source selection, author positionality and declared biases. In brief, the review is narrative and expert-informed rather than systematic. It draws on foundational works, peer-reviewed research, binding regulatory and professional standards, and publicly available AVM provider documentation. A detailed search protocol and source classification are provided in the supplementary material.
3. Validation and uncertainty quantification
Validation asks whether AVM predictions are systematically reliable across time, market segments and property types; uncertainty quantification asks how confident a specific prediction is. Both concerns have moved from the periphery to the centre of AVM practice, driven by supervisory expectations that AVM outputs should be traceable, defensible and accompanied by quantified reliability information. Section 3.1 covers validation approaches and error metrics; Section 3.2 discusses three families of uncertainty methods and their practical implications.
3.1 Validation
Validation typically starts with in-sample metrics, which indicate how well the model fits the training data but reveal little about performance on new data or under changed market conditions. Out-of-sample validation is therefore essential, evaluating generalisability and robustness and lowering the risk that good fit values reflect overfitting. A central method is backtesting: a model trained on an earlier period is applied to later periods, and estimates are compared with realised prices to assess whether modelled relationships remain stable across market phases (Schulz et al., 2014).
AVM results can be benchmarked against both realised transaction prices and expert valuations. Transactions serve as market-based reference points, while expert valuations contribute property-specific assessments. A fair comparison requires methodological differences and the temporal reference to be made explicit. Dispersion metrics (e.g. MAE, RMSE, MAPE) summarise average forecast deviations and facilitate model comparison but reflect aggregated errors and are only partially sensitive to systematic biases. Bias metrics (e.g. MBE, MDBE, LMDPE) should therefore be reported separately, since a model may be biased despite a low average deviation, or exhibit low bias combined with high error dispersion (Steurer et al., 2021; Krause et al., 2020).
3.2 Uncertainty quantification
While point estimates dominate AVM outputs in practice, prediction uncertainty is increasingly recognised as essential for responsible deployment, since uncertainty estimates support risk-adjusted decision-making and regulatory compliance. Three principal approaches can be distinguished. Parametric approaches derive uncertainty from the model’s distributional assumptions: in classical hedonic regression, prediction intervals can be constructed from the estimated residual variance under normality. Distributional regression models such as GAMLSS (Rigby and Stasinopoulos, 2005; Granna et al., 2025) extend this framework by modelling not only the conditional mean but also higher-order parameters (variance, skewness, kurtosis) as functions of covariates, enabling heteroscedastic and asymmetric prediction intervals.
Bayesian approaches provide a principled framework for quantifying both parameter and predictive uncertainty by specifying priors over model parameters and updating them with observed data, yielding posterior predictive distributions from which credible intervals follow directly. In AVM contexts, Bayesian methods have been applied to hedonic and spatial models, including spatially varying coefficient specifications that explicitly capture local heterogeneity in price relationships (Wheeler et al., 2014). Their hierarchical structure also lends itself to informative priors in data-sparse regions. Distribution-free approaches, in particular conformal prediction (CP), have recently attracted attention as a model-agnostic framework with finite-sample coverage guarantees (Angelopoulos and Bates, 2023). CP makes minimal assumptions about the data-generating process and can be applied as a post-hoc wrapper around any point-prediction model, including tree ensembles and neural networks. Locally adaptive variants adjust interval widths to local data density and model difficulty, yielding narrower intervals in well-covered segments and wider intervals in sparse areas, a property well suited to AVMs, where prediction difficulty varies across property types and locations.
Irrespective of approach, calibration, the empirical correspondence between stated and observed coverage, is essential. The practical relevance is direct: prediction intervals translate into loan-to-value (LTV) haircuts, capital provisioning and tolerance bands for desktop revaluations. Supervisors increasingly expect AVM outputs to carry quantified, validated uncertainty rather than point estimates alone (see Part I, Section 1.3). A nominally 90% interval that empirically covers only 75% misstates collateral risk and is hard to defend in a model-validation review.
4. Market coverage and empirical reliability
4.1 Data density and spatial coverage
AVMs are designed to learn relevant market relationships without absorbing random noise (overfitting) or losing important structures (underfitting), which means that only price relationships appearing frequently enough in the training data can be estimated reliably. In data-rich, evenly distributed markets, differentiated and stable results can be obtained; in data-poor or unevenly covered markets, dispersion increases and individual observations carry too much weight. Spatial scaling shapes this balance: locally calibrated models capture micro-locations well but often suffer from a shortage of transactions, while coarser-resolution models prove more robust but smooth out local peculiarities. Seemingly precise figures therefore do not automatically translate into high reliability.
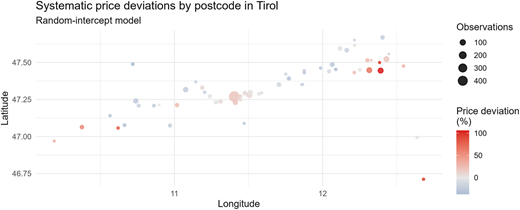
Hierarchical approaches such as mixed-effects models combine global market parameters with local deviations (Gelman and Hill, 2006). Through partial pooling, estimates in data-poor areas are cautiously drawn towards the overall market level without suppressing meaningful local effects. It is also important to take spatial dependencies explicitly into account so that neighbourhood effects do not give rise to distortions. Figure 1 displays residual postcode effects from a random-intercept model, systematic price deviations relative to the level explained by property characteristics. The effects are estimated adaptively and reported only for municipalities with sufficient data; in sparsely populated postcode areas, they are more strongly pulled back towards the overall mean. Stable and comprehensible location effects can thus be derived despite incomplete coverage.
4.2 Applicability across asset classes
AVM suitability differs considerably by property type, since transaction density, standardisation and pricing mechanisms vary. In the residential segment, transactions occur frequently, properties tend to be more standardised, and pricing is largely shaped by broad supply and demand factors. AVMs produce robust, consistent results here, particularly for mass valuations and regular portfolio updates. Office properties are more heterogeneous: price-determining factors such as lease terms, tenant creditworthiness, incentives, space flexibility and location-specific demand risks interact in complex ways. AVMs can indicate market value levels and support portfolio benchmarks, but valuation of individual properties typically calls for supplementary analysis of property-specific cash flows and contractual risks. The generalisability of AVMs must therefore always be assessed in relation to market structure: they are highly suitable for liquid, well-observed and comparable markets, but the need for supplementary methods grows as property individuality increases and transaction density declines.
4.3 Scope of application and spatial aggregation
A key design decision concerns granularity: should a single global model cover the entire market, or should separate local models be trained for sub-markets (regions, segments, price brackets)? Local models reduce bias by explicitly capturing spatial and segment-specific heterogeneity, but at the cost of higher variance. In thin markets, for specialist properties, or during structural disruption, they frequently fail systematically. Granna et al. (2022) show that a global model with data-driven interaction terms, implemented through structured additive regression with spatial smoothing components, systematically addresses this trade-off: spatial heterogeneity is captured through a flexible model structure rather than market segmentation, allowing the data set to be fully exploited while reproducing local price patterns.
Beyond spatial coverage, aggregation decisions influence AVM validity. The modifiable areal unit problem refers to the fact that different spatial delineations can yield different statistical results even when (almost) identical transactions underlie them (Openshaw, 1984). Aggregated spatial units frequently generate seemingly stable relationships that do not hold at the micro level, and the strength and direction of estimated effects may shift without this being driven by real market processes, particularly for location-related variables whose measured effect depends heavily on the chosen spatial definition. Assessments based on different aggregation levels are therefore comparable only to a limited extent. A consistent and transparently documented aggregation strategy is a key prerequisite for the spatial generalisability of AVMs.
4.4 Temporal stability and concept drift
Generalisation over time rests on the assumption that historical price relationships continue to hold, at least approximately. This assumption is reasonable during stable phases but breaks down at economic turning points or after abrupt shifts in interest rates or regulatory regimes. The collapse of the Zillow Instant Buying programme in 2021 (Gudigantala and Mehrotra, 2024) is the most prominent illustration: models trained on pre-shift data reacted too slowly to a changing market. Alongside such abrupt breaks, property markets are subject to concept drift, that is gradual changes in the underlying determinants of price as preferences, technology and institutional frameworks evolve (Gama et al., 2014). AVM performance therefore depends on continuous updating through rolling-window retraining, statistical drift detection on inputs and residuals, and integration into the formal model-validation cycle rather than ad-hoc maintenance.
5. Data enrichment
5.1 Traditional and alternative data sources
AVMs today draw on a wide range of data sources. Traditional sources comprise official data, information from valuation committees and official market reports, which are verified, legally reliable and well established in practice. They are increasingly complemented by current market sources such as listings from property portals, portfolios from estate agent software, rental and contract data, and geodata, which provide greater timeliness, finer spatial resolution and higher content depth. Both categories have limitations: traditional data is frequently time-lagged and spatially aggregated, whereas market-oriented data can be selective or vary in quality. AVMs therefore combine multiple sources, correct for distortions and balance timeliness with coverage.
Alternative data sources such as satellite imagery, mobility data, web information or aggregated sensor data can widen the perspective and enable indirect capture of location and property characteristics, with potential particularly visible where traditional data is incomplete, coarsely aggregated or time-delayed (Koch et al., 2019). Integration is methodologically demanding, since many of these sources are unstructured and heterogeneous, difficult to standardise, and the additional information often remains unclear in specific applications. Unimodal methods extract features from a single alternative modality such as text or image data and frequently serve as a robust baseline, while multimodal approaches integrate features from multiple modalities and, depending on fusion strategy, can deliver additional information gains (Despotovic and Brunauer, 2024). Whether these enrichments translate into added value depends on the specific application context. Parts of alternative data are also proprietary and subject to licensing, which may constrain transparency, long-term availability and comparability across AVM applications.
5.2 ESG integration in AVMs
The integration of environmental, social and governance (ESG) factors into property valuation is being driven by regulatory requirements, investor demand and growing empirical evidence that sustainability characteristics influence property values. The EU Corporate Sustainability Reporting Directive (European Union, 2022) and the EU Taxonomy Regulation (European Union, 2020) oblige financial institutions and real estate companies to disclose sustainability-related information, generating demand for ESG-aware valuation tools.
Empirical research has identified measurable price effects associated with energy efficiency and environmental certification. Studies covering European and US markets commonly report Green Premiums in the range of 3–10% for energy-efficient or certified buildings, although the magnitude varies across market segments, certification schemes and local climate policies (Eichholtz et al., 2010; RICS, 2024). Conversely, Brown Discounts, defined as price penalties for energy-inefficient properties, are increasingly observed, particularly in markets with stringent energy performance requirements (Cajias et al., 2019). The concept of stranding risk has further strengthened the relevance of sustainability in real estate valuation. Frameworks such as the Carbon Risk Real Estate Monitor (CRREM, 2026) provide decarbonisation pathways and carbon budgets that allow investors and valuers to assess whether a property’s carbon intensity is likely to exceed future regulatory or market expectations, thereby increasing the risk of economic obsolescence (Hirsch et al., 2019).
Integrating ESG factors into AVMs entails several methodological challenges. Energy performance certificates, although legally mandated in many markets, are neither comprehensively digitised nor standardised across jurisdictions. Social and governance dimensions like accessibility, community impact and owner governance are even more difficult to quantify and lack established measurement frameworks. Reported green and brown effects reflect predictive premiums embedded in observed transactions, not causal retrofit effects, and ESG features are therefore best modelled as a time-varying hedonic component: their implicit price is unlikely to remain constant as decarbonisation pathways tighten and stranding risk becomes a binding constraint on capital allocation. AVMs estimating static green premiums will produce systematically biased estimates in markets where regulation interacts with the underlying preference structure. Beyond modelling, building standardised ESG data infrastructures and embedding ESG features into AVM architectures remain important areas for both future research and practice.
5.3 Data protection, reproducibility and synthetic data
Data protection requirements and proprietary data sources jointly constrain transparency and reproducibility, since external validation depends on the openness of both model logic and data infrastructure. Synthetic data can help bridge this gap by allowing development and testing without direct access to sensitive original data, and they are widely seen as a promising approach for addressing both data protection requirements and limited data availability. Generative ML models, in particular GANs (Goodfellow et al., 2014) and variational autoencoders (Kingma and Welling, 2014), are able to reproduce the statistical properties of real transaction data without exposing individual data points. Their informative value, however, remains limited whenever real dependencies, rarities and local peculiarities are only incompletely replicated, or existing biases are perpetuated.
A first concern is the model collapse phenomenon: when an AVM is trained iteratively on synthetic data that originate from a predecessor model, distribution errors accumulate across generations and the model converges towards a degenerate representation of the market (Shumailov et al., 2024; Alemohammad et al., 2023). A second signal comes from the market itself. In 2025, MOSTLY AI, one of the leading providers of synthetic tabular data, discontinued its commercial SaaS product and moved to an open-source SDK, which we read as an indication that synthetic data has so far not supported a viable standalone business model beyond narrow compliance applications. A conservative stance is therefore advisable for AVMs: synthetic data can be useful for model prototyping and stress testing, but it is not a substitute for real transaction data in final model training.
6. Fairness, bias and ethics
AVMs, like all data-driven models, can perpetuate, amplify or obscure existing biases in the data on which they are trained. Algorithmic bias in property valuation has drawn considerable regulatory and public attention, particularly in the United States, where empirical studies have documented systematic disparities in AVM outputs across racial and socioeconomic groups (Howell and Korver-Glenn, 2021; Freddie Mac, 2021). Bias in AVMs can arise from several sources. Historical transaction data may reflect discriminatory lending practices, exclusionary zoning policies or racially motivated appraisal practices that systematically undervalued properties in minority neighbourhoods. When AVMs are trained on such data without appropriate correction, they risk reproducing these historical inequities as seemingly objective model outputs. Spatial features such as neighbourhood composition, school district quality or proximity to amenities can act as proxies for protected characteristics and thereby enable indirect discrimination even in the absence of explicitly sensitive variables. The US Consumer Financial Protection Bureau (CFPB, 2023) has cautioned that AVMs may make bias harder to eradicate, since algorithmic complexity obscures the relationship between biased inputs and discriminatory outputs.
Empirical evidence shows that commercial AVMs in the United States display statistically significant disparities in prediction accuracy across racial groups: properties in predominantly Black neighbourhoods experience higher error rates and more frequent undervaluation than properties in predominantly White neighbourhoods (Zhu et al., 2024; Neal et al., 2020). These findings call into question the assumption that replacing human appraisers with algorithmic models automatically removes discriminatory bias.
Mitigation strategies operate at three levels. Pre-processing approaches correct or re-weight training data to reduce historical bias prior to model estimation. In-processing approaches alter the model’s objective function to incorporate fairness constraints alongside predictive accuracy, for example by penalising violations of demographic parity or equalised odds. Post-processing approaches adjust model outputs to satisfy fairness criteria, for instance through group-specific calibration or threshold adjustment. Each approach entails a trade-off between fairness and predictive accuracy, and formal results show that competing fairness criteria (calibration, equalised odds, demographic parity) cannot generally be satisfied simultaneously (Kleinberg et al., 2017; Barocas et al., 2019).
The ethical dimensions of AVM deployment reach beyond statistical fairness. Accountability for biased or erroneous valuations and the ability of affected parties to understand and challenge automated outputs are addressed as governance questions in Section 7. Fairness has moved from a technical goal to a regulatory requirement, most visibly through the explicit non-discrimination clause of the US Interagency Final Rule on Quality Control Standards for AVMs (Federal Register, 2024).
7. Governance and hybrid human–AVM architectures
Governance is the framework that ties validation, uncertainty, data quality and fairness together. The resulting architecture is necessarily hybrid: a data-driven anchor value from the AVM, a quantified statement of its uncertainty and an expert layer that carries contextual knowledge and regulatory responsibility. The regulatory frameworks discussed in Part I converge on a set of implicit requirements: traceability, documented validation, quantified uncertainty, non-discrimination and human oversight for high-stakes decisions. No fully automated AVM currently satisfies these on its own. The EU AI Act (European Union, 2024) makes this explicit for creditworthiness applications, while the US Interagency Final Rule (Federal Register, 2024) does so for mortgage lending; UK model risk management practice (Bank of England, 2023) reaches the same conclusion through a different route. Empirically, ML-based AVMs achieve superior predictive performance but do not resolve the interpretability constraint that shapes regulatory acceptance (Lorenz et al., 2023; Cajias et al., 2021; see Part I, Section 4.6). At the same time, AVM outputs can degrade in ways that are invisible to standard accuracy metrics but visible to a domain expert with property-specific knowledge, as the fairness and drift literatures show (Sections 3 and 6). The expert layer is therefore not a legacy compromise but an active governance instrument.
Operationally, three consequences follow. The AVM should output a point estimate together with a calibrated prediction interval. The expert should be able to override or contextualise the result, and every override should be logged as an input to model monitoring. Validation, uncertainty, fairness and drift should be treated as one integrated model-risk problem, not four separate technical concerns. Recent evidence from practice supports this direction: Kasim et al. (2026) show that practitioner adoption of valuation technology depends heavily on institutional trust and clarity of responsibility, and Renigier-Biłozor et al. (2022) find that acceptance hinges on how well the technology is embedded in professional practice rather than on model sophistication.
Hybrid human and AVM architectures are not a transitional stage on the way to full automation. On current evidence, they are the target state.
8. Limitations
This review is narrative and expert-informed rather than systematic (see Section 2). The evidence base was not screened against a formal quality protocol and selection bias cannot be excluded, particularly where the authors’ domain expertise shaped which strands of literature were followed in depth. The jurisdictional focus on the EU, the UK and the US limits generalisability to markets with markedly different institutional or data environments.
Two topical constraints deserve mention. Commercial AVM providers were reviewed only through publicly accessible documentation; proprietary validation reports were not available, which constrains any claim about production-grade AVM performance. Evidence on ESG integration and on foundation-model or LLM-based approaches remains emergent, and the corresponding statements in this review are provisional rather than settled. Both areas are moving quickly, and we expect the balance of the evidence to shift over the coming years.
9. Conclusions
Part II of this review asked what is required for AVMs to be reliable, fair and production-ready. Table 1 maps the underlying evidence base, and several observations run through it. Data quality, availability and granularity set the upper bound of AVM performance more fundamentally than model complexity. Sections 4 and 5 show that the same modelling approach can produce very different results depending on the density of the underlying data, the treatment of alternative and multimodal sources, and the maturity of the ESG data infrastructure. Model choice matters, but not in isolation from the data it works on.
Uncertainty is a first-class output, not an optional add-on. Prediction intervals, calibration and validation against realised transactions and expert benchmarks are the operational prerequisites for using AVM outputs in high-stakes decisions, and supervisory expectations are moving in the same direction. A point estimate without a defended interval no longer meets the standard of practice.
Fairness and drift are governance problems, not purely technical ones. The empirical evidence on bias and the literature on concept drift both show that AVM performance can degrade in ways that are invisible to average error metrics but visible to a domain expert. This is the argument behind Section 7: the most resilient AVM configuration is hybrid, combining a data-driven anchor with quantified uncertainty and an expert layer that carries contextual and regulatory responsibility.
The implications differ by stakeholder. Table 2 summarises what each group can take from this review.
AVMs will continue to expand in scope, but their credibility will be decided outside the model. The frontier is not model complexity, it is the governance environment in which AVMs are validated, calibrated, audited and combined with human judgement. This environment also reshapes the professional skills that valuers, model developers and supervisors need to bring to it (Cheung, 2025). Delivering that environment, rather than delivering the next model, is the task ahead.
The supplementary material for this article can be found online.