As online course enrollments increase, it is important to understand how common course features influence students' behaviors and performance. Asynchronous online courses often include a discussion forum to promote community through interaction between students and instructors. Students interact both socially and cognitively; instructors' engagement often demonstrates social or teaching presence. Students' engagement in the discussions introduces both intrinsic and extraneous cognitive load. The purpose of this study is to validate an instrument for measuring cognitive load in asynchronous online discussions.
This study presents the validation of the NASA-TLX instrument for measuring cognitive load in asynchronous online discussions in an introductory physics course.
The instrument demonstrated reliability for a model with four subscales for all five discrete tasks. This study is foundational for future work that aims at testing the efficacy of interventions, and reducing extraneous cognitive load in asynchronous online discussions.
Nonresponse error due to the unincentivized, voluntary nature of the survey introduces a sample-related limitation.
This study provides a strong foundation for future research focused on testing the effects of interventions aimed at reducing extraneous cognitive load in asynchronous online discussions.
This is a novel application of the NASA-TLX instrument for measuring cognitive load in asynchronous online discussions.
Introduction
Online undergraduate learning is growing in popularity, with the asynchronous modality representing approximately half of all online courses in recent years (Best Colleges, 2020). Several meta-analyses have reported consistent student grades (and thus course content mastery) in online versus traditional courses (Jahng et al., 2007; Lundberg et al., 2008; Zhao et al., 2005). However, online courses tend to have high withdrawal rates compared to the traditional modality (Atchley et al., 2013; Bawa, 2016; Jaggars et al., 2013a; Jaggars and Bailey, 2010; Murphy and Stewart, 2017; Paden, 2006), particularly in online STEM courses (Griffith et al., 2014; Paden, 2006; Wladis et al., 2012).
Student persistence in learning has been explained through several models, including the student integration model (Tinto, 1987), the social cognitive theory (Bandura, 2002) and the model of student departure (Bean, 1990). Persistence in online learning has key dimensions including learner characteristics, institutional characteristics, external/environmental factors, student's expectations and interpersonal factors. Some dimensions are easily addressed by the institution through institutional support, frameworks and best practices in course design and instruction (Lou et al., 2006). Other elements are challenging to address, including previous degrees and professional experience (Cochran et al., 2014; Dupin-Bryant, 2004; Levy, 2007; Xenos et al., 2002), prior online course experience (Dupin-Bryant, 2004), GPA (Cochran et al., 2014; Harrell and Bower, 2011; Jaggars et al., 2013b; McKinney et al., 2018), external support (Hart, 2012; Park and Choi, 2009), learning style (Harrell and Bower, 2011) and locus of control (Lee et al., 2012). Moderating variables for persistence in online Science, Technology, Engineering, and Mathematics (STEM) courses include demographic variables (e.g. ethnicity (Xu and Jaggars, 2013) and age groups (Wladis et al., 2015; Xu and Jaggars, 2013)) and student characteristics (GPA and prior online course performance (Hachey et al., 2015; Xu and Jaggars, 2013)). These dimensions, elements and moderating variables underscore the complexity of understanding withdrawal reasons from online STEM courses.
In all learning environments, learning tasks and activities demand working memory resources to process information. Intrinsic load results from the amount of mental processing required to understand the task due to task complexity, element interactivity and the task environment (Kalyuga, 2011; Mills, 2016). Extraneous load results from cognitive processes not related to learning due to how material is presented to students, including the split attention effect, modality effect and redundancy effect (Kalyuga, 2011; Mills, 2016). Where possible, extraneous load should be eliminated (or at least reduced) (Kalyuga, 2011). Germane load results from the work required to create a new knowledge schema (Kalyuga, 2011; Mills, 2016). The germane cognitive load is the intentional cognitive processing necessary for learning. Unlike extraneous and intrinsic load, increasing the germane load can enhance learning (Kalyuga, 2011).
High cognitive load – cognitive overload – can interfere with creation of new memories and processing of new information. Cognitive overload – often the result of extraneous and intrinsic load (Stiller and Koster, 2016) – has been connected to attrition (Tyler-Smith, 2006) and lower student satisfaction (Bradford, 2011; Kozan, 2015) in online courses. Subjective mental workload measures used in these studies are best practices at this time (Anmarkrud et al., 2019; Ayres, 2006, 2018), though more work in this area is warranted to further expand our understanding of these relationships.
Cognitive load has received attention within the STEM disciplines in research literature (Mutlu-Bayraktar et al., 2019). Optimizing intrinsic load has shown improvement in pass rate in engineering (Stanislaw, 2020). There is evidence that cognitive load mediates the relationship between learning attitudes and learning intention in certain STEM disciplines (Wu et al., 2022). The relationship between cognitive load and persistence in online STEM courses has not yet been reported in the literature. In certain STEM disciplines, cognitive load influenced academic performance for online students (Stachel et al., 2013).
Online discussions are often a key component of asynchronous courses because of the ability to nurture community, provide formative feedback and establish a learning community (Rovai, 2007). This study presents the novel application of an existing cognitive load instrument for specific, discrete tasks associated with asynchronous online discussions. The tasks identified in this study were understanding expectations, crafting an initial post, reading posts from the instructor and peers, creating reply posts and understanding instructor's feedback and grading. The goal of this study is to better understand the discussion tasks with higher cognitive load and the dimensions that contribute to high cognitive load for specific tasks. We measured perceived cognitive load using the subjective NASA-TLX instrument for five discrete tasks in asynchronous discussions in order to identify the tasks that represent the highest cognitive load and to identify the factors that contribute to the highest cognitive load for each task. Understanding sources of cognitive load is important to understand the best practices in online discussions; the best practices in asynchronous online discussions are still emerging (Fehrman and Watson, 2021).
Materials and methods
Research design
This study will serve as a quantitative descriptive investigation, using survey data. As such, variables were not controlled or manipulated, only measured. Surveys were anonymous. This study was reviewed by the institutional review board and deemed exempt (approval #20–114). Therefore, signed informed consent was not collected. An informational document was provided explaining the purpose of the study, how data will be used, and details regarding the confidentiality of the data (in this case, anonymous). Furthermore, in a preliminary survey question, participants indicated their consent.
Participants
The data for this study were obtained from a medium-sized, private (nonprofit) university. The sample for this study consisted of students enrolled in an introductory physics course over multiple nine-week terms in 2020 and 2021 (n = 578). The survey sample was drawn through nonprobability sample, with a self-selected sample. Survey recruitment was executed through announcements posted via the learning management system as well as institutional email. Survey data were collected anonymously through the online platform, SurveyMonkey, with a 13.5% (N = 78) response rate. With the population size and response rate and a 95% confidence level, the margin of error was 10.5%. This study implemented best practices in educational research, including communicating relevance of the research topic and the use of initial and reminder recruitment messaging (Saleh and Bista, 2017). Educational research response rates across a wide range typically do not provide unbiased population estimates; higher response rates tend to only marginally shift results (Fosnacht et al., 2017).
Instruments and measures
The survey used the raw NASA-TLX instrument to measure self-reported cognitive load. This instrument is an indirect, subjective assessment of mental workload. The raw TLX instrument is a multidimensional assessment that asks respondents to reflect on the cognitive load of specific tasks. The mental effort of dealing with task demands measured in this instrument have been associated with intrinsic load while the germane load has been associated with mental effort in understanding the learning environment and extraneous load has been associated with the mental effort in navigating and information selection demands (Gerjets et al., 2004), though intrinsic versus germane load may be hard to distinguish (Scheiter et al., 2009). This instrument has previously been applied to cognitive load in various educational environments (McQuaid, 2010; Wiebe et al., 2010; Zhang et al., 2011).
The cognitive load of the asynchronous online discussions was operationalized into five tasks: understanding expectations, crafting an initial post, reading posts from instructors and peers, creating reply posts and understanding instructor's feedback and grading. Respondents reported their perceived workload on a scale with 10 gradations for five subscales: mental activity, time pressure, perceived success, effort and frustration. Because the raw TLX allows for dropping of subscales not relevant to the tasks, the “physical activity” subscale was eliminated as the cognitive load for computer mouse operation related to navigating the discussion within the learning management system was anticipated to be minimal.
Data analysis
At the student level, the cognitive load responses were summed across the five factors within each of the five tasks which can be interpreted as the overall cognitive load (Hart, 2006). Frequencies and descriptive statistics were calculated in terms of mean, standard deviation, minimum and maximum values for overall cognitive load for all five tasks.
At the class level, student cognitive load survey responses were aggregated as a weighted mean for comparison to the class average of final overall course scores and to the class average of the overall discussion scores.
To validate the novel use of the cognitive load instrument in asynchronous online discussions, we conducted a confirmatory factory analysis (CFA) in R version 4.0.3 (R Core Team, 2020). The packages that were used to run the CFA were lavaan version 0.6 (Rosseel, 2012) and semPlot version 1.1.2 (Epskamp, 2019). The purpose of the CFA was to determine the strength of the relationship between the items and the latent construct to provide validity evidence of the internal structure of the NASA-TLX with the novel use in asynchronous online discussions. A model was run for each task (expectations, crafting posts, reading posts, creating reply post and instructor feedback) to see how well the five subscales measured the single latent construct of cognitive load. If a student did not answer an item on the NASA-TLX, then the items for that student were removed from the data set. The overall score was calculated for students that had complete data with responses to all items. The factor models were statistically identified by setting the factor loading of the first item equal to 1. The estimation method used was maximum likelihood with list-wise deletion for missing data. To investigate the dimensionality of the cognitive load instrument we evaluated two factor models. We first tested whether a single factor model based on all five subscales adequately predicted the covariance among the items. However, the responses for the subscale of perceived success were different in terms of the distribution of student responses, so a second single factor model was fit removing the subscale of perceived success.
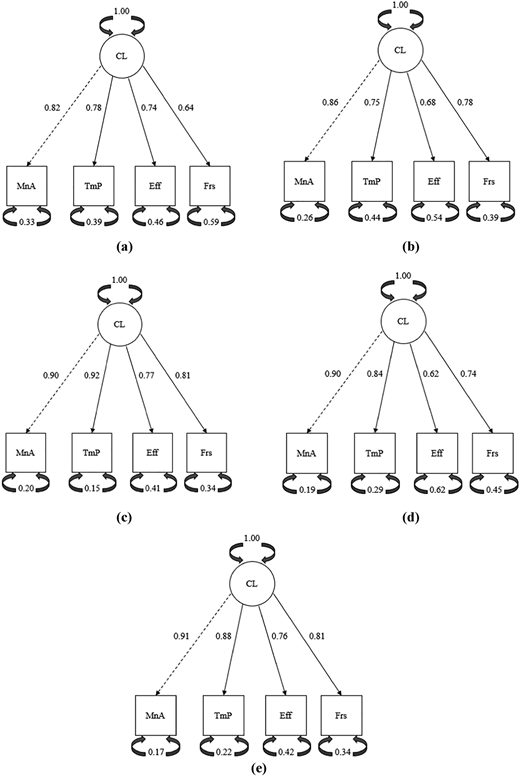
The criteria for empirically evaluating the fit indices for each model were: (1) root mean square error of approximation (RMSEA) at least <0.08, (2) comparative fit index (CFI) and Tucker–Lewis Index (TLI) at least >0.90 and (3) standardized root mean residual (SRMR) < 0.08 (Hu and Bentler, 1999). Chi-square statistics and p-value are very sensitive to sample size so this criterion is no longer relied upon as a basis for accepting or rejecting a model (Hu and Bentler, 1999). The Chi-square statistics and p-values were still reported for each model for reference. The CFA diagram for the model for each discrete task (understanding expectations, crafting the initial post, reading posts, creating reply posts and understanding instructor feedback) displays the standardized factor loadings, indicating the effect of the latent construct (cognitive load) on the observed variable (each of the four subscales: mental activity (MnA), time pressure (TmP), effort (Eff) and frustration (Frs)). The CFA diagram was provided for only the second single factor model that removes the subscale of perceived success.
The reliability of the instrument for each of the five tasks was assessed using the measure of composite reliability (Raykov, 1997). Composite reliability is an alternative method for calculating internal consistency compared to Cronbach's alpha and is based on the factor loadings from a CFA. The equation for calculating composite reliability is as follows:
where lambda () is the standardized factor loading for the item i and ϵ is the error variance for item i. The error variance is defined as one minus the square of the standardized factor loading (). The thresholds for composite reliability are debated within the area of measurement theory but it is reasonable to set a minimum threshold of 0.80 for a define construct with five to eight items (Netemeyer et al., 2003). The composite reliability statistics were run for each task (understanding expectations, crafting the initial post, reading posts, creating reply posts and understanding instructor feedback) for the second single factor model.
Results
Summary statistics
The mean total cognitive load for each of the five tasks is presented in Table 1. Each task had at least one student responding with a 10 on each of the five subscales as seen by the maximums being the largest possible value. Three of the tasks had at least one student reporting a 1 for every subscale to give the lowest possible minimum score of 5. Student-level responses covered all, or nearly all, of the possible interval.
Similar means and standard deviations suggest some consistency in responses for the five tasks. An analysis of variance (p < 0, n = 74; Table 2) demonstrated that they are not all the same.
The weighted average of the subscales for each discrete task contributing to cognitive load in the discussions is presented in Table 3. The tasks with the overall highest cognitive load were understanding what is expected and crafting the initial post. For both tasks, the effort subscale demonstrated the highest cognitive load. The lowest overall cognitive load was reported for the task of integrating instructor feedback into future discussion posts. As with the highest cognitive load tasks, effort in completing these tasks were the most noted source of cognitive load by students. Frustration was consistently the lowest source of cognitive load for each task.
Validation of the raw TLX instrument
The first set of single factor models that were run for all five tasks included all five subscale items for the instrument. The factor loadings for each task for perceived success were low for the absolute value (ranging from −0.3 to −0.2) and the variance was high (ranging from 0.89 to 0.97). The normality assumption for all the items was checked consistently across all five tasks, the responses for perceived success were negatively skewed with most students answering between 6–10 on a scale ranging from 1–10. The item of perceived success was removed from each CFA model for each task to see if that may potentially improve the model fit.
Table 3 shows the model fit indices for the five CFA models for each task with only four of the five subscales of items from the instrument (factor model 2). Factor model 2 fit the data well for all five tasks. The fit for the factor model for the task of expectations included 78 student responses and had adequate fit with only the value of RMSEA slightly higher than the criteria of <0.08 (RMSEA = 0.134, CFI = 0.976, TLI = 0.927). The model fit for the task of crafting the post included 77 student responses and had good fit (RMSEA = 0.070, CFI = 0.994, TLI = 0.982). The factor model for the task of reading posts included 76 student responses and had adequate fit with the value of RMSEA slightly higher than the cut-off criteria (RMSEA = 0.144, CFI = 0.985, TLI = 0.956). The model for the task of creating reply posts included 78 student responses and fit reasonably well with only a slightly high RMSEA value (RMSEA = 0.162, CFI = 0.973, TLI = 0.918). Finally, the factor model for the task of instructor feedback included 78 student responses and had a good fit for the data (RMSEA = 0.000, CFI = 1.000, TLI = 1.012) (see Table 4).
The composite reliability of all four subscale factor models (factor model 2, Figure 1) for each of the tasks was above the threshold cut-off of 0.80. The measures of internal consistency were highest for the task of reading posts (0.914) and instructor feedback (0.908). Therefore, there is evidence of strong correlation among the four subscales which is an indicator the latent construct of cognitive load for each of the five tasks (understanding expectations, crafting the initial post, reading posts, creating reply posts and understanding instructor feedback).
Discussion
Cognitive load
To place cognitive load in the context, five scenarios have been described (Mayer and Moreno, 2003):
Visual channels are overloaded due to too much visual content to process.
Visual and/or auditory channels are overloaded due to too much combined visual and auditory content to process.
Visual and/or auditory channels are overloaded due to the presence of nonessential information.
Visual and/or auditory channels are overloaded due to confusing presentation of material.
Visual and/or auditory channels are overloaded due to the need to hold too much information in memory while trying to integrate new material (i.e. there is insufficient cognitive capacity).
Instructions for participating in the discussions were provided through text. The high cognitive load reported by students for the task of understanding what was expected may be due to too much text included in the instructions (scenario 1), extraneous information in the instructions (scenario 3), poorly organized instructions (scenario 4) or the instructions could be too complex (scenario 5).
Future work will include focus groups to capture student perspectives on the specific source of the high load in these areas. Uncovering the intrinsic and extraneous load from the student viewpoint will identify areas for possible interventions that leave the germane load to draw on working memory processes (Kalyuga, 2011; Mayer and Moreno, 2003; Mills, 2016). Once the source of the high cognitive load is understood, instructional designers can perform a targeted redesign of that aspect of the course. A recent study reported that cognitive load explains approximately 25% of the variance in student satisfaction with an online course (Bradford, 2011). Understanding expectations of time commitment and expectations of difficulty level in an online course has been correlated to persistence in adult, nontraditional learners (James, 2020). Furthermore, the connections between cognitive load and community of inquiry can be explored with “understanding expectations” reflecting cognitive presence and both “crafting an initial post” and “creating reply posts” reflecting social presence (Garrison et al., 2004).
Cognitive load and student performance
In face-to-face learning environments for undergraduate STEM courses, there is evidence to support the correlation between cognitive load and performance. One study reported that statistics exam scores are negatively correlated with intrinsic and extraneous cognitive load (Leppink et al., 2014). Another study reported statistically significant improvements in learning outcomes in an engineering mathematics course related to a cognitive load intervention (Maj, 2020). While research on the relationship between cognitive load and performance in online STEM learning environments is limited, a published dissertation reported that implementing a scaffolding tool to reduce cognitive load in a laboratory course modestly improved laboratory scores (Stachel et al., 2013). This work provides a foundation for a study that evaluates student-level cognitive load, rather than class-level (through a confidential versus anonymous survey).
Limitations
A sample-related limitation of this study is a nonresponse error. The cognitive load survey was voluntary and was not incentivized. This likely reduced participation. Voluntary surveys can over-represent strong opinions, both positive and negative. As this study explored cognitive load, it is reasonable to think that some students may have opted out of participation based on the topic. The response rate fell below ideal sample size parameters. Given the population size, response rate and a 95% confidence level, the margin of error was 10.5%. Due to the sample response rate and the influence of demographic variables, the results may not be generalizable. This work should be replicated with a larger data set to confirm the findings.
Conclusion
The research consistently suggests that cognitive load is important criteria in designing high-quality online courses (Bradford, 2011; Caskurlu et al., 2021). This study presented the validation of a novel use of the NASA-TLX instrument to measure cognitive load in asynchronous online discussions, a common component of online courses. With a validated instrument, a variety of studies can be explored that use perceived cognitive load as a measured variable. For example, future work could explore student-level correlations between cognitive load and both persistence and performance.
The authors would like to acknowledge [removed for blind review] for funding the access to the survey platform used in this study.
Declaration of interest statement: The authors disclose internal funding in support of this project.
Two authors disclose employment as a potential conflict of interest. This has been addressed through (1) use of anonymous data collection, (2) inclusion of an external author and (3) approval of the research through the institutional review board.