

In the recent dynamic market, supply chain disruptions are rapidly increasing with varied customer demand, technological changes, uncertain pandemic events etc. To overcome the unexpected disruptions, supply chain of each business should be resilient and pharmaceutical supply chain (PSC) is no exception. Motivated by the challenges and unexpected pandemic disruptions, this paper aims to examine the performance indicators (PIs) of the resilient PSC and to predict the resilience level for a certain time period in the context of Bangladesh.
The aim of this paper presents a structured framework based on the Delphi method, fuzzy DEMATEL (Decision Making Trial and Evaluation Laboratory) and system dynamics (SD). The proposed methodology was validated using expert's inputs from the relevant field in Bangladesh. This study reveals the influential relationships of indicators and resilience level using fuzzy DEMATEL and SD to improve the resiliency.
Findings revealed that “Supply chain risk orientation”, “Visibility”, “Flexibility”, “Agility in supply chain” and “Collaboration” are the top five influential performance indicators for resilient PSC. The cause and effect relationship found that “IT capability”, “Flexibility”, “Supply chain network design”, “Resource availability”, “Supply chain risk orientation” and “Velocity” were in cause category which play a vital role for establishing resilient supply chain. SD approach has developed a model for predicting the resilience level of the supply chain.
This work is one of the initial contributions in the literature that has targeted on the identification and analysis of the significant PIs and predicting the resilience level of the PSC.
1. Introduction
Over the past few decades, corporate world has become more turbulent and vulnerable in nature due to rapid globalization, varied customers' interest and demand, technological changes, unexpected pandemic outbreaks etc. Firms are facing enormous pressure to manage and control their supply chains effectively. To secure the market position, business organizations are searching for proper strategies that may enhance their strengths in some key areas of their supply chains and operations. Establishing resilient supply chain is one of the fruitful strategies to overcome the adverse situation tactfully as well as to improve the overall business performance (Rajesh, 2018). Over the past few years, a lot of academicians and industry practitioners have shown much interest for the establishment of resilient supply chain (Chowdhury et al., 2019). Moreover, recently, a novel and wide-ranging disruptive pandemic called COVID-19 outbreak has put resiliency into the spotlight. This pandemic has hit the global supply chains adversely. Amid such turbulence, this outbreak has provided organizations a golden opportunity to revisit the strategy and accelerate their capabilities for the adaption of long-term resiliency in their network for managing future challenges (Ivanov, 2020).
A resilient supply chain can sidestep avoidable risks and has the potentiality to bounce back fast from uncertain occurrences. It is to be noted that more than 80% of global firms are now interested for the adoption of resilient supply chain (Bhatia et al., 2013). However, after establishing resilient supply chain, it is required to monitor and measure the performance of supply chain resilience continuously. It is essential for the business organizations to establish relevant and significant performance indicators (PIs) to measure the resilience of the supply chain (Behzadi et al., 2020). Researchers and industry practitioners have performed many studies to identify the most pertinent PIs for measuring supply chain resilience (Hohenstein et al., 2015; Bai and Satir, 2020). Ali et al. (2017) identified some non-financial key performance indicators (KPIs) for measuring supply chain resilience. Stone and Rahimifard (2018) reviewed 137 papers on supply chain from various renowned databases. Their findings also showed that most of the previous literatures were focused only on identification of the PIs of resilient supply chain. However, the companies and supply chain managers require not only the identification but also the understanding of relationships among these PIs to establish better performance evaluation strategy for resilient supply chain. To the best of our knowledge, the resilient supply chain PIs have not been modeled yet to better understand the relationships among them.
As an emerging sector of Bangladesh, pharmaceutical industry has also focused for the proper adoption of resilient supply chain concept. Daily commodity products like rice, oil, electricity etc. have almost simple ad static supply chains. On the other hand, having complex and dynamic structure, PSC face various challenges to establish resilience in the chain. In the context of Bangladesh, this sector plays a vital role providing lifesaving medicines. However, it becomes very difficult to maintain the smooth flow of medicines because huge population of Bangladesh causes the constant fluctuations in customer demand. So, in order to maintain the smooth flow of medicines from producers to customers amid such difficulties, a resilient supply chain is inevitable. There are some significant PIs that, if improved upon, will help the decision makers in making a supply chain more resilient. So, motivated by the current situation, this study proposed a structured framework for modeling the PIs of resilient PSC. However, after reviewing the previous literature and analyzing the research gap, this study raises the following research questions (RQs):
What are the key PIs of resilient supply chain in the context of pharmaceutical industry?
What are the interactions among them?
How can the policy makers predict the resilience level for a certain period?
Based on the above research questions, this study has formulated the following specific research objectives (ROs):
To identify the most significant PIs for measuring the performance of resilient PSC in the context of Bangladesh.
To understand the causality of relationships among them.
To develop a model for predicting the resilience level of the PSC.
To achieve the above objectives, this study has deployed the Delphi based fuzzy DEMATEL approach to identify and analyze the most significant PIs of PSC and developed a SD model for predicting the resilience of the supply chain. The Delphi based fuzzy DEMATEL approach has the advantages of extracting the research data from the experts based on their prior experiences and developing cause and effect diagram along with prominence rank under fuzzy environment (Abdullah and Zulkifli, 2019). After examining the cause and effect relationships among the indicators, SD model is developed. Therefore, integrating fuzzy DEMATEL with SD helps to construct more robust models.
2. Related studies
This section presents the review of previous literature for building a theoretical foundation of this study.
2.1 Supply chain resilience
Over the last few decades, the researchers and supply chain practitioners are working out to establish resilient supply chain to deal with uncertainty and disruptions (Pettit et al., 2019). This concept of supply chain resilience has gained attention because it deals with designing the supply chain to enhance the capability of retuning to its original state from unexpected events or disruptions (Christopher and Peck, 2004; Ralston and Blackhurst, 2020). According to Fiksel et al. (2015), supply chain resilience is an essential proactive approach which helps the companies to reduce traditional risks. Resilient supply chain has the ability to identify the risks, ameliorate the impact and come back rapidly from man-made or natural occurrences (Singh et al., 2019a, b; Lee and Rha, 2016). In today's dynamic market, establishing resilience in the supply chain has become one of the utmost challenges for supply chain specialists and managers.
2.2 Assessment of PSC resilience
PSC is considered to be more complex than the other industries (Zahiri et al., 2017). Nowadays, supply chain resilience has become a widely used area of interest among researchers and supply chain practitioners of pharmaceutical companies. In the supply chain resilience literature, various quantitative approaches have been previously applied by researchers for resilience assessment (Hossain et al., 2019; Yaroson et al., 2019). Pettit et al. (2013) proposed a tool for supply chain resilience assessment and management which was called the SCRAM tool. Another assessment in the literature is the fundamentals of the grey systems theory to evaluate and analyze the supply chain resilience (Rajesh, 2020).
In the recent studies, Rajesh (2018) used VIKOR method for assessing supply chain resilience. Aigbogun et al. (2018) proposed another quantitative cross sectional design for resilience assessment. Another study was conducted with the integrated method of ANP and DEMATEL by Leksono (2019). Ahmed et al. (2020) developed a framework to model the barriers of closed loop supply chain. A logical framework for assessing supply chain resilience based on PIs was provided by Song et al. (2019). The proposed framework provided an insight about resilient supply chain by representing linkages between some indicators and a set of performance measures. Banihashemi et al. (2019) explored the relationship between reverse logistics and sustainability performance.
2.3 Performance indicators (PIs) in the context of resilient PSC
Many researchers have already identified a number of PIs for resilient supply chain. To find out the PIs in the context of resilient PSC, relevant articles were reviewed from various databases (Google scholar, Scopus etc.)using key words such as “supply chain resilience”, “supply chain resilience performance indicators”, “pharmaceutical supply chain performance indicators” etc. After reviewing the literature, we found 19 most relevant supply chain resilience PIs for further analysis. Table 1 represents these 19 PIs with definition. Many researchers emphasized on supply chain collaboration to be an important PI for supply chain resilience although it is very difficult to implement (Christopher and Peck, 2004; Papadopoulos et al., 2017). Some researchers have found that supply chain visibility plays a significant role in establishing resilient supply chain (Swift et al., 2019). Hafezalkotob and Zaman (2019) identified sustainability as an important PI for resilient supply chain. Production capacity also determines the performance of a resilient supply chain (Chowdhury and Quaddus, 2016; Jain et al., 2017; Kaur et al., 2020).
Relevant PIs of resilient PSC
| No | PIs | Definition | Sources |
|---|---|---|---|
| 1 | Collaboration | It is defined as two or tiers of supply chain working jointly in planning and operations | Papadopoulos et al. (2017) |
| 2 | Visibility | Ability of a firm to locate the inventory easily | Swift et al. (2019) |
| 3 | Information sharing | Information sharing among the members is important to improve the resilience of a supply chain | Moktadir et al. (2018) |
| 4 | Agility | Ability of a firm to manufacture and deliver items with short lead times | Kamalahmadi and Parast (2016), Ali et al. (2017), Christopher and Peck (2004) |
| 5 | Flexibility | Ability of a firm to restructure their operations and strategy to respond quickly to customer demands | Pettit et al. (2013) |
| 6 | Sustainability | Related to supply chain network in terms of environment and waste costs | Hafezalkotob and Zamani (2019), Yang et al. (2018) |
| 7 | Redundancy | A firm must create redundancy in terms of capacity throughout the supply chain to improve the resilience | Ali et al. (2017), Christopher and Peck (2004) |
| 8 | Creating robust supply chain | Ability to protect against disruptions and reduce their impact once they occur | Papadopoulos et al. (2017) |
| 9 | SC risk orientation | Orientation of supply chain risk factors across the firm | Christopher and Peck (2004) |
| 10 | Available resource | Availability of required resources to improve the supply chain resilience | Christopher and Peck (2004), Chowdhury and Quaddus (2016) |
| 11 | Velocity | Ability of the firm to complete the supply chain activities as quickly as possible | Christopher and Peck (2004) |
| 12 | Production capacity | The maximum volume of products that can be produced by a firm | Chowdhury and Quaddus (2016) |
| 13 | Revenue sharing | Revenue sharing among the different tiers of supply chain | Yu et al. (2020) |
| 14 | Partnership for risk sharing | Partnership among the different tiers of supply chain for risk sharing | Jain et al. (2017) |
| 15 | Adaptability | Ability to adjust the supply chain design when the market demand shifts | Chowdhury and Quaddus (2016), Jain et al. (2017) |
| 16 | SC network design | Efficient supply chain design affects the resilience of the supply chain | Moktadir et al. (2018); Tang, 2006 |
| 17 | Security | Security and privacy of data, information and other activities across the supply chain | Jain et al. (2017) |
| 18 | Awareness/sensitiveness | Real time monitoring of each activities within a supply chain | Jain et al. (2017) |
| 19 | Market position | Competitive position of a firm in the market | Fiksel et al. (2015) |
2.4 Research gaps and research problem definition
For the past few decades, researchers have contributed a lot in the field of resilient supply chain performance measurement. All the research studies provide resilience supply chain PIs for overall organization. However, identification of proper PIs and modeling those indicators to assess supply chain resilience for pharmaceutical industries are still required further investigations. Therefore, the goals of this study are to identify and analyze the appropriate PIs and to develop a model for predicting the resiliency level in the context of Bangladeshi pharmaceutical company. To address these research gaps, the contributions of this study and problem definition are stated as follows:
Finding the major PIs in the field of pharmaceutical industry supply chains.
Evaluating the ranking of these indicators according to their influence and identifying the cause and effect relationship.
Building a SD model for predicting the resiliency level.
3. Methods
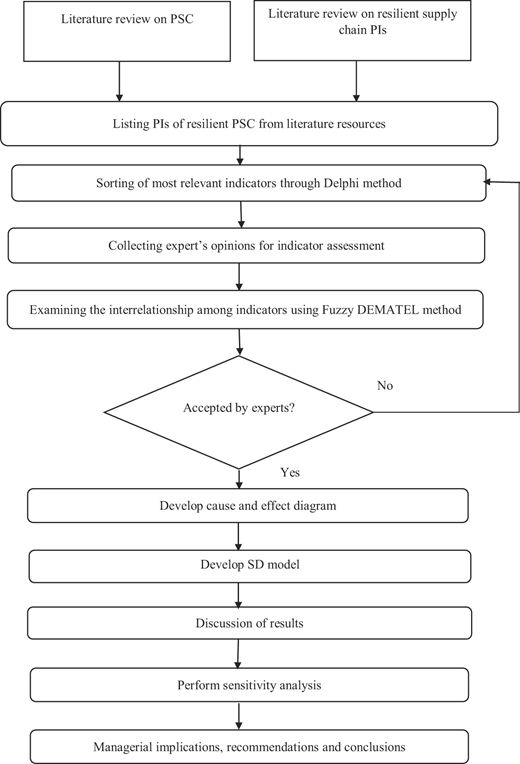
In this section, the details of the proposed methodology for analyzing the PIs and assessing the resilience of PSC have been explained. Figure 1 shows the flow diagram of the proposed research framework.
3.1 Performance indicators selection using Delphi method
In this study, the Delphi method has been applied to identify the significant PIs of resilient PSC in two phases after reviewing the previous literature. It is an iterative process of collecting and assessing data from a group of experts through a series of structured questionnaires (Jason and Glenwick, 2016; Lee and Seo, 2016). This tool is extensively used in supply chain, demand forecasting and complex decision making. (Belton et al., 2019; Moktadir et al., 2019).
In phase 1, most relevant indicators of resilient PSC were selected by the industrial experts using primary questionnaire ( Appendix 1) and in phase 2, evaluation of comprehensive relationships among these indicators was done by evaluators using the secondary questionnaire ( Appendix 2). Using the judgmental sampling technique, 10 pharmaceutical companies of Bangladesh were selected that were trying to identify and evaluate the PIs for improving their performance level. Due to confidentiality, symbolic names were used instead of the real names of these companies. For phase 1, 20 respondents were selected using purposive sampling method (Guarte and Barrios, 2006). The profile of the case pharmaceutical companies and the respondents are represented in Table 2.
Profile of case pharmaceutical companies and respondents
| Name of company | Respondents | Year of experience | Company size (employees, annual sales turn over ) |
|---|---|---|---|
| “A” Pharmaceutical limited | Supply chain manager | 15 years | Employee: 47,000 Turnover (2016): USD 544million |
| Logistics manager | 12 years | ||
| Production manager | 10 years | ||
| “B” Pharmaceutical limited | Logistics manager | 11 years | Employee: 32,000 Turnover (2017): USD 238 million |
| Assistant logistics manager | 5 years | ||
| Supply chain executive | 3 years | ||
| “C” Pharmaceutical limited | Senior supply chain manager | 15 years | Employee: 14,000 Turnover (2017): USD 102 million |
| Supply chain manager | 12 years | ||
| Logistics manager | 7 years | ||
| “D” Pharmaceutical limited | Production manager | 11 years | Employee: 8,000 Turnover (2018): USD 89 million |
| Logistics manager | 9 years | ||
| Supply chain manager | 8 years | ||
| “E” Pharmaceutical limited | Production manager | 7 years | Employee: 8,000 Turnover (2018): USD 89 million |
| Supply chain manager | 8 years | ||
| “F” Pharmaceutical limited | Supply chain manager | 10 years | Employee: 5,000 Turnover (2018): USD 70 million |
| Logistics manager | 8 years | ||
| “G” Pharmaceutical limited | Supply chain manager | 8 years | Employee: around 5000\ Turnover (2018): USD 60 million |
| “H” Pharmaceutical limited | Supply chain executive | 4 years | Employee: around 3000 Turnover (2018): around USD 50 million |
| “I” Pharmaceutical limited | Production executive | 3 years | Employee: around 3000 Turnover (2018): USD 50 million |
| “” Pharmaceutical limited | Assistant logistic manager | 4 years | Employee: around 3000 Turnover (2018): USD 45 million |
Initially, a total of 19 PIs of resilient PSC were identified after reviewing previous literature resources (Table 1). The primary questionnaire ( Appendix 1) was sent to the respondents through email to select the most relevant PIs from these 19 PIs. The purpose of the study was communicated with them and they were requested to provide their feedback to check the validity of those PIs for PSC. They were given the chance to add or remove any indicator of resilient PSC. Based on the experts' opinions, a total of 12 PIs were sorted out. Table 3 presents the identified PIs through Delphi method.
The list of PIs identified through the Delphi method
| Performance indicators | Code |
|---|---|
| Collaboration | PI1 |
| SC risk orientation | PI2 |
| SC network design | PI3 |
| Creating robust supply chain | PI4 |
| Velocity | PI5 |
| Sustainability | PI6 |
| Flexibility | PI7 |
| Information sharing | PI8 |
| Visibility | PI9 |
| Adaptability | PI10 |
| Available resources | PI11 |
| Agility | PI12 |
3.2 Relationship assessment of PIs using fuzzy DEMATEL
3.2.1 Fuzzy set theory
The fuzzy theory was proposed and introduced by Zadeh (1965). This tool mainly deals with the vagueness problems of linguistic variables in reality. It has the capability of assessing the subjective and imprecise judgments provided by individuals or expert panels. In this study, a widely used and well- established triangular fuzzy number (TFN) has been considered. Before using fuzzy based tools, fuzzy numbers are required to convert into crisp values (defuzzification).Among various methods, Converting Fuzzy data into the Crisp Scores (CFCS) is extensive in terms of providing better crisp values than other similar methods (Wu and Lee, 2007). According to membership functions, the total score can be found as a weighted average. Let, , mean the degree of criterion that affects criterion and fuzzy questionnaires (. The crisp value of ith criteria can be obtained by four steps as follows (Opricovic and Tzeng, 2003):
Step 1. Perform normalization
where ;
Step 2: Calculate the right (s) and left (s) normalized values
Step 3: Estimate total normalized crisp values
Step 4: Compute crisp values
3.2.2 Fuzzy DEMATEL method
The Decision Making Trial and Evaluation Laboratory (DEMATEL) approach is a simple method for evaluating the relationship among various alternatives based on the pair-wise comparison. This method was first proposed by Fontela and Gabus (1974). It was widely used in analyzing complex structural models of causality between complex factors. Integrating fuzzy systems with DEMATEL enables the decision-makers to evaluate the complex factors easily (which are difficult to quantify and usually expressed with linguistic variables). Table 4 shows the triangular fuzzy linguistic scale for direct relation criteria. The steps of fuzzy-DEMATEL are presented as follows (Kazancoglu et al., 2018):
Step 1: Development of the fuzzy initial direct relation matrix by integrating the inputs from experts.
Step 2: Development of crisp direct relation matrix using Eqns (1)–(7).
Step 3: Construction of standardized matrix using the following equation
where
Step 4: Total relation matrix construction using the following equation
where indicates the identity matrix.
Step 5: Then the degree of influential impact and the degree of influenced impact are calculated as follows:
Step 6: In this step, and are calculated. indicates the prominence vector and indicates the relation vector.
Step 7: Finally, the causal diagram is developed using the prominence vector and relation vector.
4. An illustrative example
For verifying the proposed methodology, a pharmaceutical company located in Tangail, Bangladesh was selected to analyze the PIs and predict the resilience level of the supply chain. Due to confidentiality, the name of the case company has been kept anonymous. For the assessment of the relationships among the performance indicators using fuzzy DEMATEL for the case company, 5 evaluators were selected. In fuzzy DEMATEL, 4–12 evaluators are suitable for data collection. In this study, five evaluators were selected to keep the calculation simple. They were selected based on their working experience and positions in the relevant department. The profile of these five evaluators has been shown in Table 5. The questionnaire (Table A4) was sent through email after explaining to them the objectives of the study.
4.1 Assessment of resilient PSC performance indicators
At this stage of the study, performance indicators of resilient PSC of the selected pharmaceutical company were assessed using the fuzzy DEMATEL method. The resilience performance indicators represented in Table 3 were selected for the case company. Then, through the secondary questionnaire ( Appendix 2), the data were obtained from the five professional evaluators for fuzzy DEMATEL. The linguistic scale shown in Table 4 was used through the one-to-one interview for data collection. The fuzzy DEMATEL method was applied through the following steps.
4.1.1 Step 1: development of the fuzzy initial direct relation matrix
At first, the pair wise comparisons among the resilience PSC indicators were constructed by using the fuzzy linguistic variables. The linguistic assessment by the five evaluators is shown in Table A5 in Appendix 3. These linguistic variables were then converted into triangular fuzzy numbers and fuzzy initial direct relation matrix was developed by taking the average of these fuzzy numbers. The fuzzy initial direct relation matrix is shown in Table A6 in Appendix 3.
Linguistic assessment by the five evaluators
| PI1 | PI2 | PI3 | PI4 | PI5 | PI6 | |
|---|---|---|---|---|---|---|
| PI1 | (N,N,N,N,N) | (VH,H,H,VH,H) | (H,VH,H,H,H) | (VH,H,H,H,L) | (VH,H,L,L,L) | (VH,H,L,L,L) |
| PI2 | (VH,VH,H,H,H) | (N,N,N,N,N) | (VH,H,H,H.L) | (VH,VH,H,L,L) | (L,L,L,L,L) | (VH,H,H,H,H) |
| PI3 | (H,H,H,VH,H) | (L,L,L,L,L) | (N,N,N,N,N) | (VH,H,H,H,H) | (VL,VL,L,H,L) | (VL,L,L,L,L) |
| PI4 | (VH,VH,H,H,VH) | (H,L,L,H,H) | (L,L,L,L,L) | (N,N,N,N,N) | (N,N,VL,VL,VL) | (L,H,H,H,L) |
| PI5 | (L,L,L,H,H) | (L,H,H,H,L) | (VL,L,L,L,L) | (VL,VL,VL,VL,L) | (N,N,N,N,N) | (VH,VH,H,H,H) |
| PI6 | (VL,VL,L,L,L) | (L,L,L,H,H) | (VL,VL,N,VL,VL) | (VL,N,VL,VL,L) | (L,L,L,L,L) | (N,N,N,N,N) |
| PI7 | (VH,H,H,H,H) | (VH,VH,H,H,H) | (VL,L,L,L,L) | (VL,VL,VL,L,H) | (VH,VH,VH,VH,VH) | (VH,H,H,H,H) |
| PI8 | (VH,H,VH,VH,VH) | (VH,VH,H,L,L) | (VL,VL,VL,VL,L) | (VL,L,L,L,L) | (N,VL,L,L,H) | (VH,VH,H,H,H) |
| PI9 | (L,L,L,H,H) | (L,H,H,H,H) | (H,L,H,L,H) | (L,L,L,L,L) | (L,H,H,H,H) | (H,H,H,H,H) |
| PI10 | (VH,VH,VH,VH,VH) | (H,H,H,H,H) | (L,L,L,L,L) | (VL,VL,VL,L,L) | (L,L,L,L,L) | (VH,VH,H,H,H,H) |
| PI11 | (L,L,H,H,H) | (H,H,H,L,L) | (L,H,H,H,H) | (H,H,L,L,H) | (H,L,L,H,H) | (H,H,H,H,H) |
| PI12 | (H,H,L,L,L) | (L,L,L,H,H) | (L,H,H,H,H) | (L,L,H,H,H) | (L,L,L,L,H) | (L,H,H,L,L) |
| PI7 | PI8 | PI9 | PI10 | PI11 | PI12 | |
|---|---|---|---|---|---|---|
| PI1 | (L,H,H,H,H) | (VH,H,H,H,H) | (VH,H,L,L,L) | (H,L,L,L,L) | (L,H,L,L,L) | (L,L,H,H,L) |
| PI2 | (L,H,L,L,L) | (L,H,H,H,L) | (H,H,H,VH,VH) | (VH,H,VH,VH,VH) | (H,L,L,L,L) | (VH,VH,H,H,H) |
| PI3 | (N,N,VL,VL,VL) | (H,VH,VH,H,H) | (H,H,H,H,H) | (L,L,L,L,H) | (VH,VH,H,H,H) | (H,H,VH,VH,VH) |
| PI4 | (VL,VL,VL,L,L) | (VL,L,H,H,H) | (VL,VL,VL,VL,L) | (VL,L,L,L,L) | (VL,VL,L,H,H) | (VL,VL,L,L,H,) |
| PI5 | (H,H,LH,H,H) | (N,N,VL,L,L) | (L,L,L,L,H) | (L,L,H,H,H) | (N,VL,L,L,L) | (L,L,H,VH,VH) |
| PI6 | (L,L,L,L,L) | (VL,VL,VL,VL,L) | (L,H,H,H,H) | (L,L,L,H,H) | (H,H,L,L,H) | (VH,VH,VH,H,H) |
| PI7 | (N,N,N,N,N) | (VL,L,L,L,H) | (H,VL,L,H,H) | (H,VH,VH,H,H) | (H,L,H,L,H) | (VH,VH,H,H,H) |
| PI8 | (VH,H.H,H,H) | (N,N,N,N,N) | (H,VH,VH,VH,VH) | (L,L,L,L,L) | (H,H,H,L,L) | (VL,VH,VH,VH,H) |
| PI9 | (H,H,H,H,L) | (VL,VL,VL,VL,L) | (N,N,N,N,N) | (VL,L,H,H,H) | (H,H,H,H,H) | (VL,L,L,H,VH) |
| PI10 | (L,L,L,L,H) | (L,L,L,H,H) | (VL,L,H,H,H) | (N,N,N,N,N) | (N,VL,VL,L,L) | (VL,VL,L,L,L) |
| PI11 | (H,H,H,H,H) | (L,L,L,L,L) | (VL,L,H,H,H) | (L,L,L,L,L) | (N,N,N,N,N) | (L,L,L,H,H) |
| PI12 | (L,L,L,L,L) | (VL,VL,L,L,L) | (VL,L,L,H,H) | (VL,VL,L,L,VL) | (VL,VL,VL,L,L) | (N,N,N,N,N) |
The fuzzy initial direct relation matrix (average)
| PI1 | PI2 | PI3 | PI4 | PI5 | PI6 | |
|---|---|---|---|---|---|---|
| PI1 | (0, 0, 0.25) | (0.6, 0.85, 1) | (0.55, 0.8, 1) | (0.5, 0.75, 0.95) | (0.4, 0.65, 0.85) | (0.4, 0.65, 0.85) |
| PI2 | (0.6, 0.85, 1) | (0, 0, 0.25) | (0.5, 0.75, 0.95) | (0.5, 0.75, 0.9) | (0.25, 0.5, 0.75) | (0.55, 0.8, 1) |
| PI3 | (0.55, 0.8, 1) | (0.25, 0.5, 0.75) | (0, 0, 0.25) | (0.55, 0.8, 1) | (0.2, 0.45, 0.7) | (0.2, 0.45, 0.7) |
| PI4 | (0.65, 0.9, 1) | (0.4, 0.65, 0.9) | (0.25, 0.5, 0.75) | (0, 0, 0.25) | (0, 0.15, 0.4) | (0.4, 0.65, 0.9) |
| PI5 | (0.35, 0.6, 0.85) | (0.4, 0.65, 0.9) | (0.2, 0.45, 0.7) | (0.05, 0.3, 0.55) | (0, 0, 0.25) | (0.6, 0.85, 1) |
| PI6 | (0.15, 0.4, 0.65) | (0.35, 0.6, 0.85) | (0, 0.2, 0.45) | (0.05, 0.2, 0.45) | (0.25, 0.5, 0.75) | (0, 0, 0.25) |
| PI7 | (0.55, 0.8, 1) | (0.6, 0.85, 1) | (0.2, 0.45, 0.7) | (0.15, 0.4, 0.65) | (0.75, 1, 1) | (0.55, 0.8, 1) |
| PI8 | (0.7, 0.95, 1) | (0.5, 0.75, 0.9) | (0.05, 0.3, 0.55) | (0.2, 0.45, 0.7) | (0.2, 0.4, 0.65) | (0.65, 0.9, 1) |
| PI9 | (0.35, 0.6, 0.85) | (0.45, 0.7, 0.95) | (0.4, 0.65, 0.9) | (0.25, 0.5, 0.75) | (0.45, 0.7, 0.95) | (0.55, 0.8, 1) |
| PI10 | (0.75, 1, 1) | (0.55, 0.8, 1) | (0.25, 0.5, 0.75) | (0.1, 0.35, 0.6) | (0.25, 0.5, 0.75) | (0.6, 0.85, 1) |
| PI11 | (0.4, 0.65, 0.9) | (0.4, 0.65, 0.9) | (0.45, 0.7, 0.95) | (0.4, 0.65, 0.9) | (0.4, 0.655, 0.9) | (0.5, 0.75, 1) |
| PI12 | (0.35, 0.6, 0.85) | (0.35, 0.6, 0.85) | (0.45, 0.7, 0.95) | (0.4, 0.65, 0.95) | (0.3, 0.55, 0.85) | (0.35, 0.6, 0.85) |
| PI7 | PI8 | PI9 | PI10 | PI11 | PI12 | |
|---|---|---|---|---|---|---|
| PI1 | (0.45, 0.7, 0.95) | (0.55, 0.8, 1) | (0.4, 0.65, 0.85) | (0.3, 0.55, 0.8) | (0.3, 0.55, 0.8) | (0.35, 0.6, 0.85) |
| PI2 | (0.3, 0.55, 0.8) | (0.4, 0.65, 0.9) | (0.6, 0.85, 1) | (0.7, 0.95, 1) | (0.3, 0.55, 0.8) | (0.6, 0.85, 1) |
| PI3 | (0, 0.15, 0.4) | (0.6, 0.85, 1) | (0.5, 0.75, 1) | (0.3, 0.55, 0.8) | (0.6, 0.85, 1) | (0.65, 0.9, 1) |
| PI4 | (0.1, 0.35, 0.6) | (0.35, 0.6, 0.85) | (0.05, 0.3, 0.55) | (0.2, 0.45, 0.7) | (0.25, 0.5, 0.75) | (0.2, 0.45, 0.7) |
| PI5 | (0.5, 0.75, 1) | (0.1, 0.3, 0.55) | (0.3, 0.55, 0.8) | (0, 4, 0.65, 0.9) | (0.15, 0.35, 0.6) | (0.5, 0.75, 0.9) |
| PI6 | (0.25, 0.5, 0.75) | (0.05, 0.3, 0.55) | (0.45, 0.7, 0.95) | (0.35, 0.6, 0.85) | (0.4, 0.65, 0.9) | (0.65, 0.9, 1) |
| PI7 | (0, 0, 0.25) | (0.25, 0.5, 0.75) | (0.25, 0.5, 0.75) | (0.6, 0.85, 1) | (0.35, 0.6, 0.85) | (0.6, 0.85, 1) |
| PI8 | (0.55, 0.8, 1) | (0, 0, 0.25) | (0.7, 0.95, 1) | (0.25, 0.5, 0.75) | (0.4, 0.65, 0.9) | (0.65, 0.9, 0.1) |
| PI9 | (0.45, 0.7, 0.95) | (0.05, 0.3, 0.55) | (0, 0, 0.25) | (0.35, 0.6, 0.85) | (0.5, 0.75, 1) | (0.35, 0.6, 0.8) |
| PI10 | (0.3, 0.55, 0.8) | (0.35, 0.6, 0.85) | (0.35, 0.6, 0.85) | (0, 0, 0.25) | (0.1, 0.3, 0.55) | (0.15, 0.4, 0.65) |
| PI11 | (0.5, 0.75, 1) | (0.25, 0.6, 0.85) | (0.35, 0.25, 0.5) | (0.25, 0.5, 0.75) | (0, 0, 0.25) | (0.35, 0.6, 0.85) |
| PI12 | (0.25, 0.5, 0.75) | (0.3, 0.55, 0.8) | (0.15, 0.4, 0.65) | (0.1, 0.35, 0.6) | (0.1, 0.35, 0.6) | (0, 0, 0.25) |
4.1.2 Step 2: constructing the crisp direct relation and total relation matrix
The crisp direct relation matrix from the average fuzzy initial direct relation matrix was computed using Eqn (1)–(7). The total relation matrix was derived from the crisp relation matrix using Eqns (8) and (9). The total relation matrix is shown in Table A7 in Appendix 3.
Total relation matrix
| PI1 | PI2 | PI3 | PI4 | PI5 | PI6 | PI7 | PI8 | PI9 | PI10 | PI11 | PI12 | |
|---|---|---|---|---|---|---|---|---|---|---|---|---|
| PI1 | 0.601 | 0.657 | 0.561 | 0.542 | 0.549 | 0.665 | 0.568 | 0.546 | 0.605 | 0.569 | 0.542 | 0.646 |
| PI2 | 0.710 | 0.599 | 0.578 | 0.562 | 0.557 | 0.705 | 0.575 | 0.552 | 0.647 | 0.627 | 0.562 | 0.692 |
| PI3 | 0.646 | 0.592 | 0.456 | 0.523 | 0.502 | 0.612 | 0.489 | 0.524 | 0.584 | 0.537 | 0.541 | 0.637 |
| PI4 | 0.563 | 0.519 | 0.433 | 0.371 | 0.401 | 0.539 | 0.430 | 0.431 | 0.460 | 0.451 | 0.435 | 0.508 |
| PI5 | 0.574 | 0.557 | 0.459 | 0.431 | 0.418 | 0.598 | 0.502 | 0.431 | 0.518 | 0.506 | 0.453 | 0.575 |
| PI6 | 0.514 | 0.513 | 0.405 | 0.392 | 0.436 | 0.474 | 0.446 | 0.397 | 0.496 | 0.466 | 0.447 | 0.548 |
| PI7 | 0.679 | 0.658 | 0.529 | 0.508 | 0.585 | 0.681 | 0.500 | 0.516 | 0.592 | 0.598 | 0.544 | 0.668 |
| PI8 | 0.691 | 0.648 | 0.515 | 0.514 | 0.530 | 0.689 | 0.579 | 0.464 | 0.633 | 0.564 | 0.551 | 0.672 |
| PI9 | 0.618 | 0.603 | 0.514 | 0.486 | 0.523 | 0.637 | 0.533 | 0.465 | 0.502 | 0.539 | 0.526 | 0.603 |
| PI10 | 0.634 | 0.592 | 0.482 | 0.454 | 0.485 | 0.620 | 0.501 | 0.477 | 0.544 | 0.459 | 0.466 | 0.564 |
| PI11 | 0.631 | 0.606 | 0.525 | 0.506 | 0.524 | 0.641 | 0.544 | 0.490 | 0.569 | 0.535 | 0.458 | 0.612 |
| PI12 | 0.553 | 0.531 | 0.466 | 0.450 | 0.453 | 0.552 | 0.459 | 0.424 | 0.498 | 0.458 | 0.436 | 0.479 |
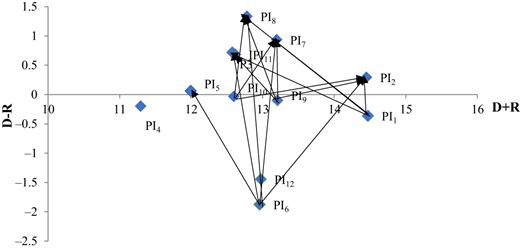
4.1.3 Step 3: deriving the prominence vector and the cause-effect diagram
The degree of influential impact and the degree of influenced impact were calculated from the total relation matrix using Eqns (10) and (11). Finally, the prominence vector and relation vector were obtained. Prominence vector and relation vector along with the ranking were represented in Tables 6 and 7 respectively. To develop the cause and effect diagram, the relation vector was used. All the indicators having positive relation values were grouped into cause group and indicators with negative relation values were grouped into an effect group.
5. Results and discussion
5.1 Cause and effect relationships among the performance indicators
In this section, the findings from the implementation of fuzzy DEMATEL have been discussed. The scores indicate the relative importance of the resilient PSC performance indicators. Therefore, a higher score of the indicators represents higher priority in the indicator's ranking system. Table 6 represents the prominence vector of the resilience PIs obtained from the fuzzy DEMATEL. According to the prominence vector, the top five performance indicators are “Collaboration (PI1)”, “SC risk orientation (PI2)”, “Visibility (PI9)”, “Flexibility (PI7)” and “Agility (PI12)” which were ranked based on scores. “Available resource (PI11)”, “Adaptability (PI10)”, “SC network design (PI3)”, “Velocity (PI5)” and “Robustness (PI4)” are the last five PIs in the prominence ranking although they have significant impact on the resilience of PSC.
The cause and effect relationships of these PIs of resilience PSC can be understood from the relation vector (Table 7). The score represents the relation characteristics of the indicators. The positive score indicates the cause group and negative score indicates the effect group. According to the relation vector, “IT capability (PI8)”, “Flexibility (PI7)”, “SC network design (PI3)”, “Available resource (PI11)”, “SC risk orientation (PI2)” and “Velocity (PI5)” were grouped into cause category since they have positive scores. On the other hand, “Sustainability (PI6)”, “Agility (PI12)”, “Collaboration (PI1)”, “Creating robust supply chain (PI4)”, “Visibility (PI9)” and “Adaptability (PI10)” were grouped into effect category. All these six indicators are influenced by other performance indicators. Figure 2 shows the cause and effect relation of the resilient supply chain performance indicators.
“Information sharing (PI8)” has got the first position in the cause category. This indicator has significant impact on establishing resilient PSC. Lack of proper information sharing causes inefficiency of coordinating action and disruptions in overall supply chain (Yu et al., 2020). It is very important to exchange the right information, for increasing resilience within the supply chain (Faisal et al., 2006). Colicchia et al. (2019) also found information sharing as one of the significant performance indicators of supply chain. To maximize resilience in the PSC, it is important to make a community of active partners within the current, complex, indeterminate supply chain environment and proper information should flow between all partners of this particular group (Setak et al., 2018; Tohidi et al., 2017). The top management should take action to concern about their information sharing to build resilient PSC. The second indicator in the causal group is “Flexibility (PI7)”. Lack of flexibility causes fluctuation in lead times and delays in product quality and information (Giannoccaro et al., 2003). The numerous styles of flexibility may boost the resilience of PSC, together with versatile travel, versatile work game plans (Pettit et al., 2013). “SC network design (PI3)” is another important causal indicator for resilient PSC. Poor network design is responsible for production of short deliveries, poor quality issues and delays. It is important for a proper understanding of the architecture of the supply chain network to make supply chain resilient (Giannoccaro et al., 2018). Rajesh (2019) performed a study on resilient supply chain and showed that network design has a significant influence on the performance of the resilient supply chain. “Available resources (PI11)” is the key to manage the resilience in the supply chain. When resources are available, it makes it easier to mitigate any disruption. “SC risk orientation (PI11)” is another causal indicator in case of PSC. However, risk orientation in the pharmaceutical supply chain is very difficult. An organization should take necessary action to identify and understand supply chain risks and take proper mitigation actions.
The effect category includes six indicators that can be highly affected by the factors in the cause group. “Sustainability (PI6)”, and “Agility (PI12)” hold the first and second position of the effect group respectively and they are highly interrelated. Lack of information sharing, limited resources, product complexity and environmental uncertainty affect these two factors. Different policies and management strategies should be taken by supply and operations managers to increase SC risk orientation and increase flexibility. Another crucial indicator is supply chain “Visibility (PI9)”. It can be affected by supply chain network design, flexibility, supply chain adaptability and collaboration in supply chain. “Adaptability (PI5)” is the last indicator in the effect group. The stability of the supply chain depends on the flexibility of the system to respond to transitory problems and market fluctuations (Chowdhury and Quaddus, 2016). Supply chain and operations managers should formulate strategy to improve the supply chain resilience by setting target for these performance indicators and following proper action plan.
5.2 System dynamics model for measuring resilience of PSC
System dynamics (SD) model has been developed for predicting the PSC resilience after identifying the cause group and effect group from the fuzzy DEMATEL. The system dynamics (SD) model was constructed in two phases. In the first phase, cause group and effect group were translated into partial causal loop diagram (CLD) and stock and flow diagram was developed from the causal loop diagram in the second phase. These phases are described as follows:
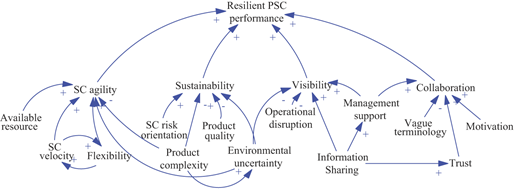
5.2.1 Phase 1: causal loop diagram (CLD) development
A causal loop diagram (CLD) of PSC resilience PIs was developed based on the cause and effect group derived from the fuzzy DEMATEL and some other auxiliary variables. These auxiliary variables were selected with the help of experts in Delphi phase. These variable were selected based on their prior experiences. Auxiliary variables are related to the main variables and the values of auxiliary variables are required to predict the values of stocks and flows. The values of auxiliary variables were collected from the case company. The eight most influential resilience PIs from the prominence vector (Table 7) were selected for developing the causal loop diagram. Table 8 presents the list of these resilience PIs and auxiliary variables.
Description of PIs and auxiliary variables for CLD
| CLD variables | Description |
|---|---|
| Product complexity | Complexity in the product technology or manufacturing |
| Product quality | Ability of the product to fulfill and meet customer requirements |
| SC agility | Description is given in Table 5 |
| Environmental uncertainty | Changes in the business environment on which the company has little influence |
| Operational disruption | Disruptions in the production and distribution system |
| Vague terminology | Usage of imprecise and unclear terms and jargons |
| Absence of trust | Lack of trust among partners, employers and workers |
| Motivation | Initiatives taken by the management to increase enthusiasm among the workers |
| Coordination | The act of making people involved in strategic and operational plan and managing their activities |
| Management support | Support from the top management by providing adequate resources and empowering the managers |
| Supply chain network complexity | Degree of complexity in supply chain structure that consist of the supply members-upstream suppliers and downstream customers |
| Effectiveness of SC network design | Effect of SC network design in increasing the collaboration |
| SC flexibility | Description is given in Table 3 |
| SC velocity | Description is given in Table 3 |
| Sustainability | Description is given in Table 3 |
| SC risk orientation | Description is given in Table 3 |
| Available resource | Description is given in Table 3 |
| Regulation | Laws or legal issues imposed by the government |
| Lack of collaboration | Opposite in collaboration which is given in Table 3 |
| Lack of visibility | Opposite in visibility which is given in Table 3 |
For developing the CLD, Vensim PLE version 32 software has been used. The causal loop diagram is shown in Figure 3.
5.2.2 Phase 2: stock and flow diagram development
At the next step, stock and flow diagram was developed with the information from the CLD. Figure 4 shows the stock and flow diagram for predicting the resilience level of PSC. Here, the “SC Resilience” is the main stock. The other stocks in the model are “SC Agility”, “Sustainability”, “Lack of collaboration” and “Lack of visibility”. Flows and the auxiliary variables have been created according to the information from the CLD.
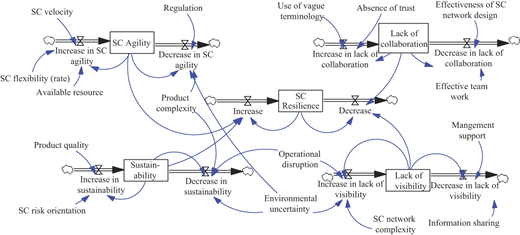
The equation was set for each flow in the model by consulting with the experts. Then, this model was implemented to the case pharmaceutical company for predicting the resilience level of the supply chain. At first, the initial values of each stock were given after consulting with the case pharmaceutical company's top management. Then, the target values of each auxiliary variables were given in the model. This data was given by the supply chain department of the case company and they set the values of each variable ranges between 0 and 1 considering the current condition of each variable. Then, the simulation was run for 100 months for observing the resilience level for the case pharmaceutical company. The equations and initial values used for different variables in the model are given below:
| SC velocity = 0.1 |
| SC flexibility (Rate) = 0.1 |
| Available resource = 0.2 |
| SC Agility *Available resource * SC velocity * SC flexibility (rate) |
| SC Agility = Initial SC Agility + increase in SC agility – decrease in SC agility |
| Initial SC Agility = 0.1 |
| Decrease in SC Agility = SC Agility * product Complexity * Environment Uncertainly * Regulation |
| Regulation = 0.1 |
| Product complexity = 0.02 |
| Product quality = 0.1 |
| SC risk orientation = 0.1 |
| Increase in sustainability = Sustainability * Product quality * SC risk orientation |
| Sustainability = Initial Sustainability + increase in Sustainability – decrease in sustainability |
| Initial Sustainability = 0.2 |
| Decrease in sustainability = Product complexity * Environmental uncertainly * Operational disruption * Sustainability |
| Operational Disruption = 0.03 |
| Environmental uncertainly = 0.02 |
| SC network complexity = 0.01 |
| Increase in lack of visibility = Lack of visibility * SC network complexity * Environmental uncertainly * Operational disruption |
| Information Sharing = 0.02 |
| Management Support = 0.2 |
| Lack of visibility = Initial Lack of visibility + (increase in lack of visibility – decrease in lack of visibility) |
| Initial Lack of visibility = 0.3 |
| Decrease in lack visibility = Lack of visibility * Management support * Information sharing |
| Effective team work = 0.03 |
| Effectiveness of SC network design = 0.05 |
| Absence of trust = 0.03 |
| Use of vague terminology = 0.02 |
| Lack of collaboration = Initial Lack of collaboration + Increase in Lack of collaboration – Decrease in Lack of collaboration |
| Initial Lack of collaboration = 0.01 |
| Increase in Lack of collaboration = Lack of collaboration * Absence of trust * Use of vague terminology |
| Decrease in Lack of collaboration = Lack of collaboration * Effectiveness of SC network design * Effective team work |
| Increase = SC Resilience * (SC Agility * Sustainability) |
| Decrease = SC Resilience * (Lack of collaboration * Lack of visibility) |
| SC Resilience = Initial SC Resilience + (increase – decrease) |
| Initial SC Resilience = 20 |
Figure 5 shows the predicted conditions of supply chain agility, sustainability, collaboration and supply chain visibility. It is noted that if the case pharmaceutical company takes action according to their target, then their supply chain sustainability will improve rapidly. However, supply chain agility will improve very slowly. Besides this, lack of collaboration and lack of visibility will be minimized within the next 100 months.
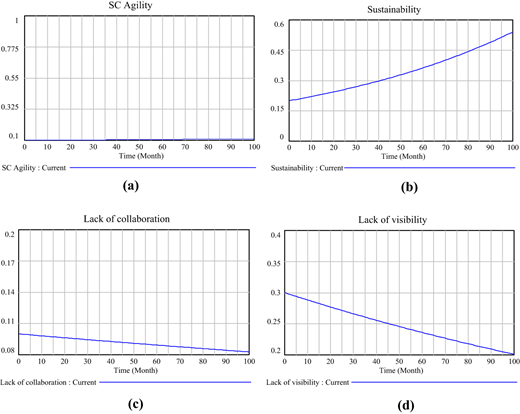
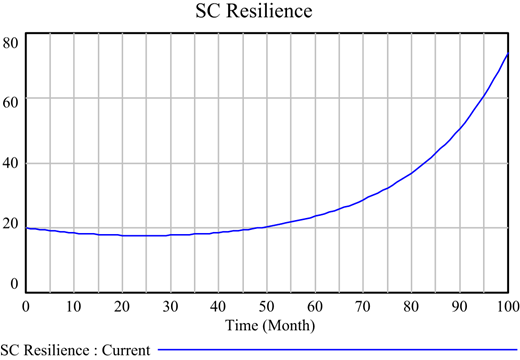
Figure 6 shows the predicted resilience level of the case pharmaceutical company for the next 100 months. At present, the resilience level of the supply chain of the company is 20 which means very low. The curve indicates that the level of supply chain resilience will be improved very quickly after a certain time if the company can maintain their strategy and action plans.
6. Sensitivity analysis
Sensitivity analysis is usually performed to examine the reliability of the decisions made by the evaluators (Tanino, 1999). Sensitivity analysis is conducted by keeping equal weights and adjusts more weights to any evaluator to realize the effects of using various combinations of decision criteria weight (Goodridge, 2016). In this study, the results obtained from fuzzy DEMATEL have been verified by performing sensitivity analysis. Five scenarios were assumed to conduct this sensitivity analysis. Different weights of evaluators were given based on their working experience in different scenarios which is shown in Table 9.
Different importance weights of evaluators in sensitivity analysis
| Evaluators | Scenario-1 | Scenario-2 | Scenario-3 | Scenario-4 | Scenario-5 |
|---|---|---|---|---|---|
| Evaluator-1 | 0.2 | 0.4 | 0.4 | 0.3 | 0.35 |
| Evaluator-2 | 0.2 | 0.2 | 0.3 | 0.3 | 0.2 |
| Evaluator-3 | 0.2 | 0.2 | 0.15 | 0.2 | 0.2 |
| Evaluator-4 | 0.2 | 0.1 | 0.1 | 0.1 | 0.1 |
| Evaluator-5 | 0.2 | 0.1 | 0.05 | 0.1 | 0.15 |
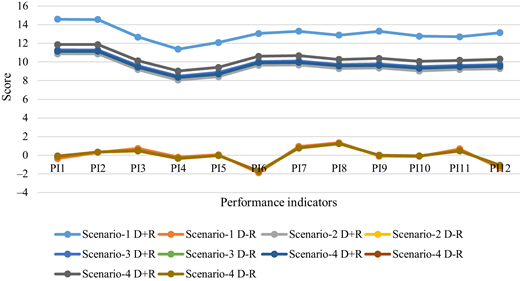
Initially, each evaluator was given equal weight (Scenario-1). After that, the weights of the evaluators were changed based on their working experiences to analyze how much the prominence rank, and the cause and effect relations vary. Since Evaluator 1 and Evaluator 2 were more experienced than all other evaluators, their weights were assigned higher than other evaluators in the next three scenarios. Then the cumulative average initial matrix was derived shown in appendix D4. Then, the fuzzy DEMATEL was applied on the same data in each scenario to observe the reliability of the results. Figure 7 shows the results obtained in different scenarios. Prominence rank of the resilient PSC performance indicators was stable in different scenarios although the weights of the evaluators were varied. Accordingly, the cause and effect relations among the resilient PSC performance indicators were varied a little with insignificant impact in each scenario. Cause group and effect group hold the same members in each scenario. Therefore, it is clear that the obtained results are not much sensitive to the variation of weights among the evaluators which indicates the high reliability of the results of the current research. As a result, the understanding of evaluators about the resilient pharmaceutical supply chain is adequate for this study.
7. Managerial implications
The major contribution of this work is the identification and prioritization of PIs of resilient PSC, which are significant to increase resilience as well as to improve overall performance. Another contribution of this work is a proposed SD model that can be used to measure resilience of PSC by simulating performance level for a certain time. After the recognition of fundamental knowledge and the strengthening of resilient supply chain PIs and the result of simulation, the business manager will be able to enhance resilient supply chain performance by introducing constructive supply chain policies. This research will help policymakers to identify the most relevant metrics of success and recommend ways to improve the outcomes in PSC. Some of the policies are also recommended for helping managers to improve PSC resilience, given as below:
Improving the resilience of a PSC requires understanding and selecting the appropriate PIs of the resilient supply chain to optimize the efforts. This research will be helpful for the supply chain professionals and researchers to select the appropriate indicators and understand the relationships among them to improve the resilience of a supply chain.
The pharmaceutical sector must formulate an effective strategy to improve the resilience of the supply chain. However, the effectiveness of the strategy must be assessed and the resilience level of the supply chain must be predicted on a regular basis. The fuzzy-DEMAEL part of this study will help the supply chain managers to formulate an effective strategy and the proposed SD model will help to predict the resilience level of the PSC.
8. Conclusions and future research directions
Establishing resilience in the supply chain has become one of the major challenges for the pharmaceutical industries. However, a structured framework is required to identify the PIs for developing resilient PSC successfully. Motivated by the drawbacks of previous research as well as the current pandemic situation, this study presents an integrated approach (Delphi based fuzzy DEMATEL and SD model) for assessing the contextual relationships among the indicators and predicting the resilience level for a certain time period.
There are three major findings in this study. First, from the Delphi method, 12 most relevant PIs for resilient PSC were identified. Second, this study applied Fuzzy DEMATEL to determine the causal relationships among the identified PIs. This study contributes to the existing supply chain literature by exploring the relationships among the PIs of resilient PSC and developing an SD model to predict the resilience level. Here, the values of the elements of the developed SD model were set according to the assumptions of the top management of the case company. The model can be more robust if the real value for each element of the model is set.
Although this research indicates new insights into resilient PSC indicators, the research inevitably has limitations regarding data collection and validation. As in this research work, only 12 PIs are considered. More indicators can be analyzed to develop the model using fuzzy DEMATEL and system dynamics in further analysis. As the model is developed and verified on the basis of expert's opinions, biases can occur. The results of this study can be compared with other methods such as fuzzy TISM, grey based TISM etc. While the focus of this research is mainly on the PSC of Bangladesh, the proposed model can be applied to other industries, such as beverage, construction, manufacturing, service and so on, for identifying resilient supply chain performance indicators.
Most relevant performance indicators of resilient PSC
| No | Performance indicators types | Yes/no | 5: Highly important and 1: Very weakly important | ||||
|---|---|---|---|---|---|---|---|
| 1 | 2 | 3 | 4 | 5 | |||
| 1 | Agility | ||||||
| 2 | Flexibility | ||||||
| 3 | Creating robust supply chain | ||||||
| 4 | Redundancy | ||||||
| 5 | Visibility | ||||||
| 6 | IT capability/information sharing | ||||||
| 7 | Collaboration | ||||||
| 8 | Sustainability | ||||||
| 9 | Supply chain risk orientation | ||||||
| 10 | Velocity | ||||||
| 11 | Adaptability | ||||||
| 12 | SC network design | ||||||
| 13 | Market position | ||||||
| 14 | Security | ||||||
| 15 | Risk control | ||||||
| 16 | Public-private partnership | ||||||
| 17 | Awareness | ||||||
| 18 | Production capacity | ||||||
| 19 | Available resources | ||||||
Identified the most relevant performance indicators
| List of identified performance indicators | Code |
|---|---|
| Collaboration | PI1 |
| SC risk orientation | PI2 |
| SC network design | PI3 |
| Robustness | PI4 |
| Velocity | PI5 |
| Sustainability | PI6 |
| Flexibility | PI7 |
| Information Sharing | PI8 |
| Visibility | PI9 |
| Adaptability | PI10 |
| Available resources | PI11 |
| Agility | PI12 |
References
Further reading
Appendix 1
Primary questionnaires:
Background information of the respondent:
(a) Name:
(b) Name of the companies:
(c) Designation:
(d) Years of experience:
(e) Major job responsibilities:
The most relevant indicators of resilient PSC were identified with the help of literature resources are following
The most relevant indicators of resilient PSC were identified with the help of industrial experts using primary questionnaire are following
Appendix 2
Secondary questionnaire
Q.3 Do you realize the assessment scale that we provided to assess the selected performance indicators? Please fill the pair wise relation:
Please provide your opinion based on the following scale: No influence (N), Very low influence (VL), Low influence (L), High influence (H) and Very high influence (VH).
Expert name:
Linguistic assessment of comprehensive relationship of these indicators using the secondary questionnaire
