This paper investigates the interplay between policy capacity dimensions and state-society co-production during crises. Through analysis of Hong Kong and Singapore’s COVID-19 management, it examines how variations in policy capacity configurations, particularly political and integration capacities, shaped societal engagement.
A comparative case study methodology analyzes Hong Kong and Singapore’s pandemic responses (2020-2022). This study uses secondary qualitative data, including government documents, academic research, news archives, and public health statistics, to compare policies and state-society interactions.
Both city-states possessed strong analytical and operational capacities, but outcomes differed based on political and integration capacities. Singapore leveraged high public trust and effective coordination for state-directed, high-compliance co-production (e.g., vaccination, contact tracing). Hong Kong, facing a trust deficit and coordination challenges, experienced fragmented co-production with mandated compliance alongside autonomous civil society action. Political and integration capacities critically determine the state’s ability to mobilize society and the resulting co-production modes. A reciprocal relationship exists between state actions, trust, and cooperation, influencing outcomes via feedback loops.
This study offers a nuanced analysis beyond state strength, showing how specific capacity dimensions (political/analytical/operational) shape crisis governance and co-production. It illuminates mechanisms linking capacity configurations to co-production forms and highlights the crucial roles of trust and policy coherence, providing insights for understanding crisis management and building resilient state-society relations.
Introduction
The COVID-19 pandemic tested governments worldwide, revealing significant variations in policy capacity and state-society relationships across jurisdictions (Capano et al., 2020; Dunlop et al., 2020). Understanding why some governments navigated the pandemic more effectively, particularly in mobilizing societal cooperation, remains critical for both policy and academic inquiry. This study explores this question through a comparative analysis of Hong Kong and Singapore, two densely populated Asian city-states sharing similarities in economic structure, administrative traditions, and prior SARS experience. Despite these parallels, their COVID-19 management trajectories, particularly concerning state-society interaction, diverged notably (Wong et al., 2021). This divergence presents a compelling puzzle: how did variations in state capabilities and state-society relations produce different patterns of crisis governance in these otherwise comparable settings?
While existing literature has examined pandemic responses globally, focusing primarily on institutional structures or cultural factors in isolation, less attention has been paid to how different dimensions of policy capacity interact to shape state-society co-production during prolonged crises (Wan et al., 2020). Co-production — the collaborative effort between state actors and citizens in achieving public goals (Ostrom, 1996; Bovaird, 2007) — became particularly salient during the pandemic, from adherence to health measures to participation in vaccination programs. This paper explores how differences in state policy capacity configurations, particularly political legitimacy and policy integration, shaped divergent co-production patterns in Hong Kong and Singapore.
The authors draw upon the policy capacity framework, conceptualizing it as encompassing analytical, operational, political, and integration dimensions (Howlett and Ramesh, 2016; Wu et al., 2018). Analytical capacity involves gathering and processing information for policy formulation, while operational capacity concerns resources and bureaucratic machinery for implementation. Political capacity relates to garnering consensus, managing conflict, and securing legitimacy, with public trust being crucial (Brenton et al., 2022). Integration capacity involves coordinating actions effectively across government agencies and policy domains. This paper examines how strengths and weaknesses across these dimensions influenced pandemic management approaches and population engagement in both cities.
This research contributes to literature in several ways. First, it offers a nuanced understanding of how the interplay between specific capacity dimensions — political and integration capacities — critically shapes crisis response effectiveness (Boin et al., 2017; Christensen and Lægreid, 2020). Second, it illuminates mechanisms through which capacity configurations influence the form of state-society co-production, whether state-directed compliance, autonomous citizen action, or collaborative partnerships (Brandsen and Honingh, 2016). Third, it analyzes the evolution of responses over time, highlighting the reciprocal relationship between state actions, societal responses, and public trust (Sztompka, 1999; OECD, 2017). Finally, through focused comparison of two relevant yet contrasting cases, it provides context-sensitive insights for enhancing governmental resilience and fostering more effective state-society collaboration in future crises.
The paper proceeds as follows: literature review on state policy capacity and co-production in crisis contexts, outline on the methodology, a comparative analysis of Hong Kong and Singapore’s COVID-19 responses, focusing on capacity dimensions and co-production patterns. Then it discusses theoretical and policy implications, and concludes with key arguments and contributions.
Literature review: theoretical framework
Co-production and policy capacity in crisis contexts
Co-production — collaborative effort between state and citizens in service delivery —represents a shift toward participatory governance (Bovaird, 2007). During crises, co-production becomes essential yet paradoxically difficult: crises demand rapid societal mobilization beyond state capacity alone, but simultaneously create conditions hostile to collaboration through uncertainty, time pressure, and trust erosion (Boin et al., 2017).
The policy capacity framework (Wu et al., 2018) provides an analytical lens by disaggregating governmental capabilities into distinct dimensions. Analytical capacity involves information gathering and processing for policy formulation. Operational capacity concerns resources and implementation machinery. Political capacity relates to garnering consensus and securing legitimacy through public trust (Brenton et al., 2022). Integration capacity involves coordinating actions across government agencies and policy domains (Howlett and Ramesh, 2016).
Different capacity dimensions specifically influence co-production potential during crises. Analytical capacity must integrate across the state-society divide—the state's ability to analyze data must connect with local knowledge for shared sense-making amidst uncertainty (Boin et al., 2017). Operational capacity must link state resources with societal capabilities like volunteer networks for effective implementation (Wan et al., 2020). Political capacity serves as the foundation — trust determines public willingness to collaborate with demanding measures (Christensen and Lægreid, 2020). However, individual capacities are insufficient without integration — the synergistic alignment preventing fragmentation under crisis pressures.
Comparative COVID-19 research: insights and limitations
The COVID-19 pandemic generated extensive comparative research. Quantitative studies linked policy stringency to health outcomes (Hale et al., 2021). Institutional analyses highlighted governance structures, comparing federal systems like Germany and Canada with unitary systems such as France and South Korea (Capano et al., 2020; Desson et al., 2020). Political research examined trust differences between democratic and authoritarian regimes (Ji et al., 2024), while cultural analyses explored how collective versus individualistic values influenced cooperation (Gelfand et al., 2021).
While valuable, these studies reveal critical gaps. Most treat state and society as separate entities — either measuring government policies’ impact on populations or societal traits’ influence on government action — while overlooking the interactive dynamics in which both continuously shape each other. Reliance on standardized metrics enhances comparability but obscures the mechanisms through which policies succeed or fail in context. Similarly, focusing on isolated variables (institutions, trust, or culture) cannot explain why similar factors produce divergent outcomes across settings. Finally, the predominantly static approaches underplay how crisis responses evolve through feedback loops and path dependencies.
Theoretical framework: linking capacity configurations to co-production modes
Building on the policy capacity framework and addressing gaps in comparative COVID-19 research, this study conceptualizes pandemic response as emerging from dynamic interaction between policy capacity configurations and modes of state-society co-production. Rather than examining isolated factors, we analyze how multiple capacity dimensions — analytical, operational, political, and integration — combine to enable or constrain different forms of collaborative action. Through longitudinal analysis of Hong Kong and Singapore, we trace the mechanisms and feedback processes that shape crisis trajectories — how initial capacity deployments influence societal responses, which then reinforce or undermine subsequent state capacity.
This interactive framework generates four propositions:
- -
Proposition 1 (Capacity integration): Crisis co-production effectiveness depends not merely on the separate presence of analytical, operational, and political capacities, but on their coherent integration across government and societal actors.
- -
Proposition 2 (Political capacity primacy): Political capacity, manifested through trust-based state-society relations, serves as a foundational enabler that conditions the effectiveness of analytical and operational capacities in crisis co-production.
- -
Proposition 3 (Temporal evolution): The relative importance and required configuration of integrated capacities shift across crisis stages (e.g., preparedness, initial response, sustained mitigation, recovery), influencing the nature and effectiveness of co-production over time.
- -
Proposition 4 (Reciprocal enhancement): Effective co-production mechanisms, when successfully implemented, can potentially strengthen both government and societal capacities over time, creating positive feedback loops that enhance overall crisis management resilience.
These propositions guide the investigation into why similar city-states achieved divergent outcomes through different collaborative patterns, advancing theoretical understanding of crisis governance beyond existing comparative studies.
Research methods
Research design
This study employs a qualitative, comparative case study approach to analyze how state policy capacity dimensions influence state-society co-production during COVID-19 crisis response. Moving beyond descriptive accounts, we systematically compare the deployment and integration of analytical, operational, and political capacities, assessing their relationship with collaborative dynamics in Hong Kong and Singapore. This comparative approach allows identification of common patterns and divergent pathways, contributing to understanding factors enabling or constraining co-production under crisis conditions (Capano et al., 2020).
Case selection
Hong Kong and Singapore were selected as comparative cases based on criteria offering analytical leverage. Both are high-density, globally connected city-states with advanced economies and prior SARS epidemic experience in 2003, suggesting potentially high baseline capacities for pandemic response (Wong et al., 2021). However, they possess distinct political systems and state-society relations trajectories, which were expected to produce different political capacity configurations and societal engagement approaches. These similarities and differences provide a valuable basis for comparing how policy capacity variations impact crisis response collaboration. The analysis spans from initial outbreak detection in early 2020 through key pandemic management phases to early 2022, allowing examination of evolving dynamics.
Data collection
The analysis relies on systematically collected secondary qualitative data to ensure comprehensive coverage and facilitate triangulation across diverse sources. Data were gathered from six primary categories: official government documents (policy statements, legislative records, budget documents, press releases, briefing transcripts); public health data and reports (surveillance dashboards, epidemiological assessments); reports from international organizations such as the World Health Organization; peer-reviewed academic literature analyzing pandemic responses; reputable local and international media providing contemporaneous accounts; and materials from civil society organizations, non-governmental organizations, and business associations.
Data were gathered through targeted searches of government websites, academic databases (e.g., PubMed, Scopus), news databases, and organizational websites, focusing on materials published within the defined temporal scope. Triangulation across these diverse source types was employed throughout to corroborate findings and enhance analytical validity.
Data analysis
This study employed a qualitative comparative approach, integrating process tracing elements to identify potential causal mechanisms linking policy capacity configurations to co-production outcomes. The analysis was guided by a structured framework assessing four key dimensions of state policy capacity and their relationship with co-production dynamics, as operationalized in Table 1. This table provides specific empirical indicators for each dimension, derived from the literature. Evidence from collected data pertaining to these indicators was identified, extracted, and systematically categorized for both cities.
The analytical process involved three main stages. First, within-case analysis was conducted for each city, mapping event sequences and policy responses chronologically and assessing different policy capacities' deployment and interplay during distinct crisis phases. This stage focused on identifying capacity use patterns and co-production efforts within each context. Second, cross-case comparison systematically compared the within-case findings, focusing on policy capacity configuration and integration variations, observed state-society relations, and resulting co-production dynamics. Third, pattern matching connected empirical observations back to theoretical expectations derived from our policy capacity and co-production framework, particularly concerning relationships outlined in our propositions.
This framework-guided, multi-step approach ensured systematic application of Table 1 indicators to the data, allowing structured qualitative assessments of capacity levels and co-production characteristics. Triangulation across diverse data sources corroborated specific findings and strengthened overall interpretation validity. Comparative analysis results are presented thematically in the subsequent Case Analysis section, structured around core capacity dimensions, co-production dynamics, and temporal aspects.
Limitations
This study acknowledges certain inherent limitations. Primary reliance on secondary sources means analysis depends on publicly accessible document availability, scope, and potential biases; access to internal government deliberations or comprehensive real-time citizen perspective data was limited. Furthermore, qualitatively assessing complex concepts such as ‘trust’ or ‘integration effectiveness’ from documentary evidence involves interpretation and cannot achieve quantitative metric precision. Finally, while the comparative design enhances analytical leverage by contrasting relevant cases, findings may be influenced by context-specific factors not fully captured by the capacity framework. Therefore, generalizability to vastly different political or socio-economic contexts should be approached cautiously.
Case analysis: policy capacity and co-production in Hong Kong and Singapore
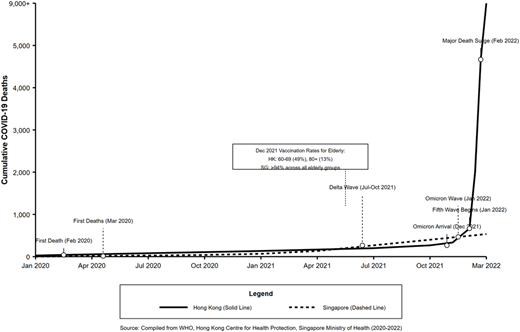
This section comparatively analyzes the COVID-19 pandemic responses of Hong Kong (HK) and Singapore (SG), focusing on how state policy capacity shaped state-society co-production dynamics. Both city-states entered the pandemic as high-capacity jurisdictions with prior SARS experience, yet their distinct political contexts and evolving state-society relations led to divergent trajectories (Tan et al., 2021). This analysis examines the period from early 2020 through early 2022, covering key policy shifts and public health outcomes. The Comparative Timeline of COVID-19 Deaths in Hong Kong and Singapore (Figure 1) provides a visual representation of how mortality outcomes dramatically diverged during this period. The analysis compares core policy capacities, examines co-production dynamics, and analyzes temporal shifts, linking empirical findings to the study’s propositions.
Comparing policy capacity dimensions
Analytical capacity
Both city-states leveraged strong public health infrastructure yet differed significantly in analytical capacity integration and application. Singapore demonstrated superior integration through its Ministry of Health, rapidly scaling testing and establishing data platforms linking testing to achieve 25 tests per 1,000 people by early May 2020 (compared to Hong Kong’s 21.7, Table 1), tracing via TraceTogether, and clinical data (Gan, 2020a). TraceTogether achieved high public adoption, covering an estimated 85.1 percent of the population, which enabled near real-time analysis. Hong Kong’s data systems appeared more fragmented; its LeaveHomeSafe app faced greater public resistance, limiting timely data integration (LegCo HK, 2021).
While both cities utilized expert epidemiological panels, the translation of this advice into policy differed. Singapore’s Multi-Ministry Taskforce structure more effectively translated expert advice into coordinated policy action (Yuen et al., 2021). Hong Kong sometimes faced challenges achieving this translation amidst evolving political dynamics. Singapore's more integrated analytical infrastructure facilitated a clearer epidemiological picture, enhancing evidence-informed measures. This underscores how analytical capacity structure and integration impacts coordinated state-society action (Proposition 1).
Operational capacity
Operational capacity showed critical differences in coordination effectiveness and scale, particularly at the state-society interface. Singapore demonstrated rapid resource mobilization for mask distribution, facility construction, and testing, leveraging public-private partnerships coordinated under the Multi-Ministry Taskforce. Hong Kong, despite significant resource allocation, faced coordination challenges and perceived slowness. This was reflected in baseline health system readiness, with Hong Kong possessing 7.6 critical care beds per 100,000 people compared to Singapore’s 11.7 (Phua et al., 2024). The operational gaps became particularly evident when the Omicron wave overwhelmed systems in early 2022 (Cheung et al., 2022).
Singapore’s ‘whole-of-government’ approach generally achieved coherent implementation linking state actions with societal actors effectively, even when facing challenges like dormitory outbreaks requiring adaptation (Abdullah and Kim, 2020). Hong Kong’s coordination between departments and with community support providers appeared less fluid, sometimes leading to implementation gaps or autonomous community action rather than integrated efforts (Matus et al., 2023). Singapore’s operational agility enabled more efficient implementation of measures requiring public cooperation, while Hong Kong’s operational hurdles constrained response plan execution, highlighting the link between operational failures and political capacity deficits (Proposition 2).
Political capacity
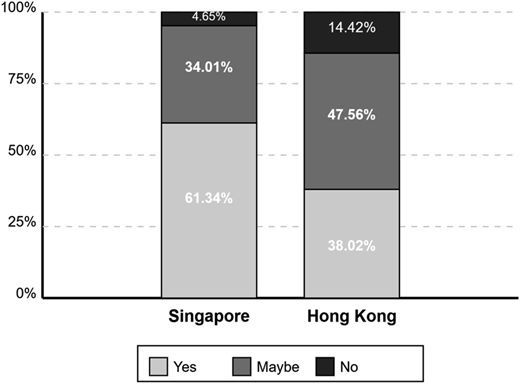
Political capacity was the starkest differentiator, shaping co-production through variations in trust and communication. Singapore’s government benefited from high pre-existing trust and political stability, which enabled clear messaging about collective responsibility and broad compliance. This is reflected in Figure 2, where vaccine hesitancy was far lower among Singaporeans than in Hong Kong (Rozek et al., 2021).
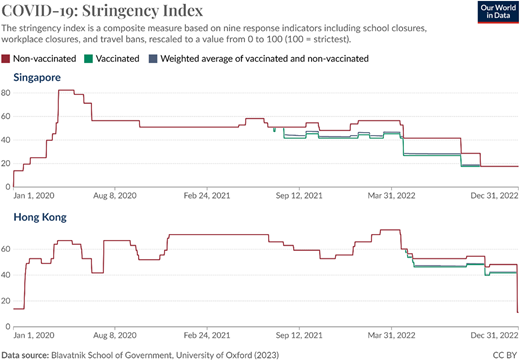
Trust also allowed Singapore to sustain decisive, high-stringency measures. As Figure 3 illustrates, its restrictions were sharper and more consistent than Hong Kong’s, which fluctuated at lower levels. Hong Kong, by contrast, faced a significant trust deficit following the 2019 social unrest (Hartley and Jarvis, 2020). Communication was often perceived as inconsistent, undermining legitimacy and complicating consensus-building (Chung et al., 2022). This deficit limited voluntary cooperation and forced greater reliance on mandates, which achieved weaker results.
These differences provide strong support for Proposition 2. Singapore’s robust political capacity enabled effective co-production and public cooperation with stringent measures, while Hong Kong’s diminished political capacity constrained implementation. The lower maxima of Hong Kong’s stringency index underscore this point: authorities faced limits on restrictions because of compromised legitimacy.
Integration of capacities
The ability to integrate analytical insights, operational actions, and political strategies also diverged significantly. Singapore’s Multi-Ministry Taskforce provided a structure explicitly designed for cross-cutting coordination, facilitating a relatively coherent flow from risk assessment to policy adjustment backed by unified messaging (Yuen et al., 2021).
Hong Kong’s coordination mechanisms appeared to struggle more with seamless integration. Observers noted instances where policy shifts seemed disconnected from operational realities or lacked clear political communication, suggesting silos between analytical advice, logistics, and public messaging (Matus et al., 2023).
State-society coordination often felt reactive, lacking platforms for proactive joint planning. This comparison aligns with Proposition 1 regarding integration importance. Singapore's structurally embedded mechanisms fostered greater policy coherence, creating a stable environment conducive to state-led co-production. Hong Kong’s challenges undermined public confidence and state-society collaborations. Effective integration is necessary to translate other capacities into coherent, trusted action.
Societal capacities and state interaction
Beyond state capacity, co-production is shaped by inherent societal capacities—including resources, networks, and mobilization potential of civil society organizations (CSOs), community groups, and the private sector. The two cities entered the pandemic with distinct societal landscapes. Hong Kong possessed a traditionally vibrant civil society ecosystem demonstrating capacity for autonomous mobilization, although it faced increasing political pressures following 2019 (Wan et al., 2020; Hartley and Aldag, 2025). Singapore featured a well-resourced civil society landscape operating in closer alignment with the state, with key coordinating bodies facilitating state-society partnerships.
In Hong Kong, societal capacity manifested through widespread autonomous bottom-up initiatives, particularly when state responses were perceived as inadequate. This autonomous action stemmed from existing civic capacity and responses to perceived state gaps. However, it remained fragmented, facing integration challenges with state responses (Matus et al., 2023).
In Singapore, societal capacity was primarily leveraged through state-coordinated channels and established partnerships. The People’s Association mobilized volunteers for government initiatives like assisting the digitally disadvantaged population to use the tracking and tracing technologies (Hansen and Dahiya, 2025). The private sector was deeply integrated into the response through numerous public-private partnerships contributing expertise and resources for technological solutions and logistical operations (Temasek Foundation, 2021). The dominant mode of societal contribution was channeled through and supportive of the state’s overall strategy. This was enabled by high state integration capacity and existing collaborative frameworks. State actions structured these contributions, which enhanced aligned capacities and private efficiency.
This approach maximized coordination within the state’s strategy. Hong Kong’s perceived state gaps and motivated civil society fostered autonomous co-production. Yet, weak state-society integration mechanisms potentially limited overall synergy and effectiveness.
Co-production dynamics
The observed co-production dynamics reflected underlying capacity differences.
Singapore fostered predominantly state-led, compliant co-production, enabled by strong political, operational, and integration capacities. This was evident in high TraceTogether adoption rates, broad adherence to safe management measures, and state-coordinated volunteerism (Hansen and Dahiya, 2025). Public-private partnerships scaling up testing capacity or operating care facilities exemplified state-directed co-production leveraging societal resources under government guidance (Tan et al., 2021). The successful vaccination campaign, with high coverage (Figure 4), exemplifies effective state-society co-production.
Hong Kong exhibited more mixed, contested, and autonomous co-production, shaped by lower political trust and integration challenges. Mandated compliance occurred, but voluntary initiatives like LeaveHomeSafe met resistance indicating state-led co-production requires public consent (LegCo HK, 2021; Wong, 2022). Where state action was perceived as slow or untrustworthy, significant autonomous co-production emerged from civil society as described above. This bottom-up activity demonstrated societal resilience but highlighted weaker state-society integration compared to Singapore’s model.
Hong Kong’s vaccination campaign faced high initial hesitancy (Figure 2), leading to low elderly coverage. This failure contributed to high Omicron fatality rates. Capacity configurations determined not just if co-production happened, but crucially what kind (state-led compliant vs. autonomous/substitutive) and how effectively it aligned with state efforts, leading to divergent outcomes.
Temporal dynamics and reciprocal effects
The capacity-coproduction relationship evolved dynamically, creating divergent feedback loops (Proposition 3). Both cities initially leveraged SARS experience, but sustained transmission tested capacities differently.
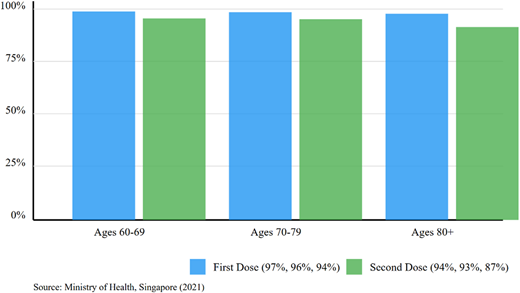
In Singapore, early successes reinforced political capacity, creating a positive feedback loop facilitating later measures. Immigrant dormitory outbreaks, an operational failure, triggered learning and adaptive capacity (Abdullah and Kim, 2020). This adaptation contributed to an efficient vaccine rollout achieving remarkably high coverage across all age groups, including over 94 percent first-dose coverage among the elderly by December 2021 (Figure 4). This success further reinforced trust and adaptation.
In Hong Kong, early community co-production showed societal capacity but didn't translate into sustained trust in the state. Policy fatigue, perceived inconsistencies, and political tensions eroded voluntary co-production willingness (Chung et al., 2022). The vaccine rollout faced greater initial hesitancy and achieved significantly lower coverage, particularly among the elderly, (13.4 percent for those over 80 by late 2021 (Tan et al., 2021)). The lower coverage and operational strains contributed to Omicron’s devastating impact in early 2022 (Table 2). This suggests a negative feedback loop: capacity failures hampered vaccine co-production, leading to poor adoption outcomes, and further damaged public confidence.
The contrasting trajectories provide compelling evidence for reciprocal effects (Proposition 4), where Singapore's successes reinforced trust and capacity, while Hong Kong’s struggles exacerbated deficits.
Synthesis of comparative findings
This comparative analysis reveals distinct pathways in Hong Kong and Singapore’s COVID-19 responses, rooted in state policy capacity configurations and their interplay with society evidenced in the Comparison of Crisis Responses (Table 3).
Singapore’s response demonstrates the power of integrating strong analytical, operational, and political capacities. This synergy fostered a state-led, high-compliance co-production model that proved highly effective. In contrast, Hong Kong’s efforts were constrained by weaker political capacity and integration challenges, despite its significant resources. This resulted in a more contested form of co-production, a heavier reliance on mandates, and more severe outcomes during the Omicron wave.
These findings directly support the theoretical propositions. The comparison underscores the importance of Integration Capacity (P1) for policy coherence and affirms the critical mediating role of Political Capacity (P2) in securing public cooperation. The analysis also illustrates the Temporal Dynamics (P3) of this relationship and provides compelling evidence for Reciprocal Effects (P4), showing how initial outcomes reshaped subsequent public trust and the overall response trajectory.
Discussion
The comparative analysis of Hong Kong and Singapore’s COVID-19 responses reveals how different configurations of state capacity produce divergent patterns of state-society co-production. These findings offer critical insights into the mechanisms that shape effective crisis governance. Both cities had strong analytical and operational resources, but outcomes were mediated by political and integration capacities. Singapore combined high trust with effective integration (Yuen et al., 2021; Quah, 2020), producing a state-directed, high-compliance model. Hong Kong’s trust deficit and weak integration, by contrast, led to fragmented co-production marked by mandates and parallel civil society initiatives (Hartley and Jarvis, 2020; Matus et al., 2023; Wan et al., 2020).
Theoretical implications: capacity, co-production, and crisis dynamics
The findings offer several contributions to the literature on state capacity, co-production, and crisis governance.
First, this study affirms the critical role of political capacity. The contrast between Singapore’s ability to leverage high public trust for compliance and Hong Kong’s struggles demonstrates that analytical and operational resources are insufficient without the political legitimacy to mobilize society. This deficit has tangible consequences; the difficulty in achieving high vaccination coverage among Hong Kong’s elderly, for example, directly contributed to divergent public health outcomes during the Omicron wave. Our analysis thus reinforces that trust is not a peripheral concern but a critical resource for effective crisis governance (Sztompka, 1999).
Second, the authors highlight the necessity of integration capacity for a coherent response. Singapore’s Taskforce model achieved a more effective ‘joined-up government’ than Hong Kong’s fragmented coordination mechanisms (Matus et al., 2023). Effective integration — linking analytical assessments to operational plans with coherent political messaging — is essential for building public confidence and enabling synergistic action (Howlett, 2023). Without it, even strong individual capacities can fail to produce effective overall performance.
Third, the analysis shows how state capacity configurations shape the very mode of co-production that emerges in a crisis. As shown in Table 4, Singapore’s high-capacity, high-trust environment facilitated a predominantly state-initiated co-production, marked by coordinated engagement and sustained compliance (Bovaird, 2007). In contrast, Hong Kong’s low-trust context created barriers to state-led initiatives, leading to a landscape where citizen-initiated, ‘gap-filling’ efforts operated in parallel to mandated compliance (Brandsen and Honingh, 2016). This demonstrates that co-production is not monolithic; its form and effectiveness are shaped by the underlying policy capacity of the state.
Finally, the findings reveal the dynamic interplay between capacity and co-production over time (Boin et al., 2017). We find strong evidence of reciprocal effects, where state actions, public responses, and trust levels create feedback loops. The contrasting trajectories are illustrative: Singapore's relative success appeared to reinforce trust, while Hong Kong’s struggles likely eroded it further. This suggests that successful co-production can build political capacity, while failures can deplete it, making future collaboration more challenging.
This multi-dimensional approach advances crisis governance theory by demonstrating how capacity interactions, rather than isolated factors, determine collaborative outcomes — a mechanism overlooked in previous comparative COVID-19 research that focused on single variables such as institutional structures or cultural factors.
Policy implications
Our findings offer several lessons for enhancing crisis management, emphasizing the need for proactive, long-term investment in governance structures.
First, governments must invest in both political and integration capacity before a crisis hits. Crises expose pre-existing levels of public trust, which cannot be manufactured quickly in an emergency. Therefore, sustained investment in transparency and stakeholder engagement is crucial for building the foundation needed for effective co-production (OECD, 2017). This must be paired with robust integration mechanisms that effectively link analytical insights, operational capabilities, and political strategy. Possessing technical expertise alone is insufficient if these foundational capacities are weak.
Second, governments should acknowledge and strategically engage with the different modes of co-production that emerge during a crisis. While state-led initiatives are vital, fostering space for autonomous civil society action can significantly enhance community resilience, particularly where public trust is low (Brandsen et al., 2018). Ignoring or suppressing such bottom-up efforts is counterproductive, as it misses opportunities to leverage societal resources and goodwill.
Finally, these insights extend beyond high-capacity city-states like Hong Kong and Singapore. In resource-constrained settings, governments may lack extensive operational infrastructure but can still invest strategically in political capacity through transparent communication and genuine community engagement. Where state resources are limited, creating clear coordination mechanisms for citizen-initiated co-production may prove more cost-effective than attempting to build comprehensive state-led systems.
Limitations and future research
This study acknowledges certain limitations inherent in its design and data sources. The primary reliance on secondary qualitative data restricted access to internal governmental decision-making processes and real-time citizen perspectives beyond what was publicly reported. Furthermore, qualitatively measuring complex concepts such as ‘integration capacity’ or ‘public trust’ necessarily involves interpretation.
While the comparative design utilizing Hong Kong and Singapore enhances analytical leverage due to their relevant similarities and differences, the findings remain specific to these unique contexts, and caution should be exercised when considering generalizability to vastly different political or socio-economic settings.
Future research could fruitfully build upon these findings through quantitative methods to develop more precise measures for the various capacity dimensions and co-production levels, potentially allowing for statistical testing of identified relationships. Expanding the comparative analysis to include different types of political regimes or countries with varying socio-economic characteristics could further test the robustness and generalizability of the conclusions. Additionally, deeper ethnographic or interview-based research could provide richer, micro-level insights into the dynamics of state-society interactions and lived experiences of citizens and officials engaged in co-production efforts during crises.
Conclusion
This comparative study of Hong Kong and Singapore’s responses to the COVID-19 pandemic illuminates the complex relationship between state policy capacity and state-society co-production in crisis management. The analysis revealed distinct trajectories shaped by variations in capacity dimensions and state-society relations. While both city-states possessed substantial analytical and operational resources, their ability to translate these into effective, collaborative crisis management diverged considerably.
Singapore’s experience illustrates the power of synergy. High public trust and strong integration capacity allowed the state to translate its analytical and operational strengths into a coherent, state-led co-production model, resulting in high public compliance with demanding health measures (Prime Minister’s Office Singapore, 2023).
Conversely, Hong Kong’s experience illustrated the challenges posed by diminished political capacity and difficulties in policy integration (Matus et al., 2023). Despite considerable resources, lower trust hampered state-led co-production, resulting in fragmented responses combining mandated compliance with autonomous civil society action.
This research underscores that analytical capacities alone are insufficient for effective crisis governance. Political dimensions of policy capacity (trust and legitimacy) and coordination aspects critically mediate societal mobilization. The study highlights that co-production forms — whether state-led, citizen-initiated, or substitutive — are contingent on policy capacity configurations and state-society relations (Brandsen and Honingh, 2016). Importantly, this relationship is dynamic, with initial outcomes feeding back to shape subsequent trust, cooperation, and crisis trajectory (Boin et al., 2017).
This study contributes to a deeper understanding of the intricate dynamics between state power, societal engagement, and effective governance under pressure, offering valuable lessons for strengthening preparedness and fostering more collaborative state-society relationships in navigating future crises. By moving beyond static assessments of state strength to examine the specific dimensions of capacity that enable effective co-production, we provide insights for both scholars and practitioners seeking to enhance crisis resilience through more nuanced approaches to state-society collaboration.
This paper forms part of Special Section on “Policy Capacity Framework in Implementation Analysis Across Different Contexts in the World”, guest edited by Dr Fabiana C. Saddi, Dr Stephen Peckham and Dr Nagina Khan.