


Virtual schools are a growing field in education. The growth reflects the spreading understanding that online courses and programs can serve a wide variety of students and needs (Watson & Gemin, 2009). The demand is continuing for expansion of online programs (Manzo, 2009). This past decade has seen a steady increase in the number of students selecting this form of instruction. With this growth comes the burden of establishing adequate school sizes in an effort to help students perform well both in their classes and on state testing. According to the Projections of Education Statistics to 2021 (Hussar & Bailey, 2013), total public and private elementary and secondary school enrollment was 55 million in fall 2010, representing a 6% increase since fall 1996. The International Association for K–12 Online Learning states that online learning in K–12 schools is growing explosively (iNACOL, 2009). The major appeal for many students in choosing this type of education is the flexibility that is offered from the comfort and safety of their home. Included are benefits of fewer distractions that interrupt instructional time, working at the student’s own pace, and being able to travel without negative consequences in school. Online education has the potential to bring quality education to those students who may not be able to find it in a traditional classroom (Mills, 2011).
Enrollment in K–12 online learning is growing at an exponential rate throughout the United States. Currently, all 50 states offer K–12 online learning (Kennedy & Archambault, 2012). Educational institutions need to understand how to best support their students throughout their educational careers and provide the best training to prepare a 21st century workforce (Hanasky, 2010). Virtual schools are not the answer for improving schools, but they are an important addition that augments the available resources for schools. Virtual schooling is more of a hybrid of public, charter, and home schooling, with ample dashes of tutoring and independent study thrown in, all turbocharged by Internet technology (Greenway & Vanourek, 2006).
Research Problem
The trend and demand for virtual education has grown nationwide (McNally, 2012). With an increase in students choosing this type of education, inevitably the demand for schools of this type of educational instruction has increased in number. The purpose of this study was to determine the extent of the relationship between virtual school size and student achievement in virtual schools in a southwestern state. For the purpose of this study, achievement was measured by student performance on state testing scores. The study used descriptive and inferential statistics to analyze enrollment size and State of Texas Assessments of Academic Readiness (STAAR) English Language Arts/Reading in Grades 5 and 8, Math in Grades 5 and 8, English I, English II, and Algebra I testing scores in regard to race and gender.
Theoretical Framework
The theoretical framework used for this study is the economies of scale. Marshall (1961) referred to the advantages of production on a large scale as economies of skill, economies of machinery, and economies of supplies. This basic description includes three concepts that reduce the average cost per unit through an increase in overall production efficiency. Economies of scale are often cited in education literature as being one of the drivers for the deployment of e-learning. They are used to support the notions that policy toward e-learning should promote scale efficiencies, that larger institutions will be better able to compete in the future, and that there should be substantial investment in the development of elearning materials and online courses (Morris, 2008).
All virtual schools used in this study were managed by private companies that operate for a profit but are categorized as public schools through charter school agreements. In this study, the economies of scale theory was used to determine the extent of the relationship between virtual school size and student achievement in virtual schools in a southwestern state.
Deficiencies in the Evidence
For the purpose of this study, student achievement was determined by a student’s ability to obtain a minimum passing score on statewide testing of general standards. Student preference in choosing which virtual school to attend can be based on several characteristics of the school, including school size. Few studies have been conducted to determine the overall effectiveness and impact on student achievement that occurs as a result of students in Grades 6 to 12 taking courses through an online platform (McNally, 2012). Though numerous studies have been performed on school size in this southwestern state, this researcher was not able to find any virtual school size studies for this state. Moreover, the research on virtual school size in general is limited.
There is controversy over whether small, medium, or large schools are the most effective. Although a plethora of reforms has been suggested to improve U.S. high schools, in urban districts, the small school reform model is particularly popular (Iatarola, Schwartz, Stiefel, & Chellman, 2008). Furthermore, technology has opened up new pathways for small schools to provide rigorous curriculum through online instruction (Wu, Hsu, & Hwang, 2008).
Conversely, large school benefits include being able to hire well qualified teachers, more access to technology, and facilities that may impact student achievement (Zoda, Slate, & Combs, 2011). These researchers examined Texas elementary brick-and-mortar school size and its effect on student performance in reading, writing, and math. They reported students enrolled in large schools demonstrated higher student achievement on the Texas Assessment of Knowledge and Skills Reading, Math, and Writing examinations compared to students enrolled in small or very small elementary schools.
It could be debated whether or not size in a virtual school has an impact on student achievement or even whether it matters, since students do not attend an actual building. Simonson (2004) states that a group made up mostly of administrators believes distance education courses do not require a classroom, and one course can have dozens, even hundreds, of students enrolled. While an abundance of research is available discussing relationships of brick-and-mortar school size and its effect on student achievement, there is a limited quantity of academic discussion and information available in regard to the virtual setting. This study of school size and its effect on student achievement in virtual schools was an attempt to add to the literature and bridge the chasm between the virtual and brick-and-mortar learning environments.
Purpose of the Study
The purpose of this study was to determine the extent of the relationship between virtual school size and student achievement in virtual schools in a southwestern state. For the purpose of this study, achievement was measured by student performance on state testing scores. The study used descriptive and inferential statistics to analyze enrollment size and STAAR English Language Arts/Reading in Grades 5 and 8, Math in Grades 5 and 8, English I, English II, and Algebra I testing scores in regard to race and gender.
Participants
The data for this research project were collected from the state education website. The target population was students who attended virtual schools in a southwestern state in the 2013–2016 school years. Students testing in Grades 5 and 8 for math and reading and students testing in Grades 9 to 12 for English I, English II, and Algebra I comprised the target population. Four public virtual schools ranging in enrollment from 108 to 6,477 students in a southwestern state housed the target population (Texas Educational Agency [TEA], 2017a).
According to the state’s Texas Academic Performance Reports (TAPR), the racial breakdown of students was categorized as African American, Hispanic, White, American Indian, Asian, Pacific Islander, and two or more races. For the purposes of this research study, the following racial categories were used: Black, Caucasian, Hispanic, American Indian, Asian, Pacific Islander, and two or more races. The data for each school were obtained by retrieving the school’s TAPR for the 2013–16 school years from the state education website.
For the 2015–16 school year, all virtual schools reported students enrolled. Table 1 reveals the total number of enrolled students in the four virtual schools that were researched in this study. Schools 5 and 6 were omitted from the study because they were evaluated using an alternative accountability rating. School 4 enrollment numbers were tabulated by combining elementary, middle, and high school data from the TAPR report for the year.
2013–16 Total Number of Students Enrolled in Virtual Schools in a Southwestern State
| Virtual School | 2013–2014 | 2014–2015 | 2015–2016 |
|---|---|---|---|
| School 1 | 108 | 246 | 379 |
| School 2 | 5,999 | 6,477 | 3,324 |
| School 3 | 3,887 | 4,443 | 5,106 |
| School 4 | 125 | 185 | 658 |
Note: The above data were retrieved from TEA (2017a), TAPR for the individual schools for 2013–2016.
Table 2 reveals the number of students enrolled in School 1 for the 2013–16 school years. As indicated above, School 1 was established in the 2013–14 school year. This school has the second fewest number of students enrolled for every year that was evaluated.
School 1 Number of Enrolled Students and Percentage by Grade Level and Year
| School Year and Grade Level | 2013–2014 | 2014–2015 | 2015–2016 | |||
|---|---|---|---|---|---|---|
| Number | Percentage | Number | Percentage | Number | Percentage | |
| Grade 4 | 0 | 0.0 | 0 | 0 | 10 | 2.6 |
| Grade 5 | 0 | 0.0 | 11 | 4.5 | 14 | 3.7 |
| Grade 6 | 14 | 13.0 | 19 | 7.7 | 24 | 6.3 |
| Grade 7 | 18 | 16.7 | 33 | 13.4 | 50 | 13.2 |
| Grade 8 | 24 | 22.2 | 44 | 17.9 | 52 | 13.7 |
| Grade 9 | 21 | 19.4 | 41 | 16.7 | 61 | 16.1 |
| Grade 10 | 17 | 15.7 | 44 | 17.9 | 60 | 15.8 |
| Grade 11 | 14 | 13.0 | 32 | 13.0 | 62 | 16.4 |
| Grade 12 | 0 | 0.0 | 22 | 8.9 | 46 | 12.1 |
Note: The above data were retrieved from TEA (2017a), TAPR for School 1.
Table 3 reveals the number of students enrolled in School 2 for the 2013–16 school years. School 2 was established in the 2008’2009 school year. This school has the highest number of students enrolled for the 2013–14 and 2014–2015 school years.
School 2 Number of Enrolled Students and Percentage by Grade Level and Year
| School Year and Grade Level | 2013–2014 | 2014–2015 | 2015–2016 | |||
|---|---|---|---|---|---|---|
| Number | Percentage | Number | Percentage | Number | Percentage | |
| Grade 2 | 0 | 0.0 | 1 | 0.0 | 0 | 0.0 |
| Grade 3 | 235 | 3.9 | 228 | 3.5 | 213 | 6.4 |
| Grade 4 | 301 | 5.0 | 381 | 5.9 | 358 | 10.8 |
| Grade 5 | 516 | 8.6 | 499 | 7.7 | 395 | 11.9 |
| Grade 6 | 573 | 9.6 | 612 | 9.4 | 603 | 18.1 |
| Grade 7 | 873 | 14.6 | 769 | 11.9 | 811 | 24.4 |
| Grade 8 | 982 | 16.4 | 1,068 | 16.5 | 944 | 28.4 |
| Grade 9 | 1,070 | 17.8 | 1,072 | 16.6 | 0 | 0.0 |
| Grade 10 | 669 | 11.2 | 832 | 12.8 | 0 | 0.0 |
| Grade 11 | 524 | 8.7 | 671 | 10.4 | 0 | 0.0 |
| Grade 12 | 256 | 4.3 | 344 | 5.3 | 0 | 0.0 |
Note: The above data were retrieved from TEA (2017a), TAPR for School 2.
Table 4 reveals the number of students enrolled in School 3 for the 2013–16 school years. School 3 was established in the 2008–2009 school year. This school has the highest number of students enrolled for the 2015–2016 school year. This school has the second highest number of students enrolled for the three school years that were studied.
School 3 Number of Enrolled Students and Percentage by Grade Level and Year
| School Year and Grade Level | 2013–2014 | 2014–2015 | 2015–2016 | |||
|---|---|---|---|---|---|---|
| Number | Percentage | Number | Percentage | Number | Percentage | |
| Grade 3 | 136 | 3.5 | 149 | 3.4 | 153 | 3.0 |
| Grade 4 | 212 | 5.5 | 204 | 4.6 | 203 | 4.0 |
| Grade 5 | 282 | 7.3 | 249 | 5.6 | 269 | 5.3 |
| Grade 6 | 337 | 8.7 | 345 | 7.8 | 351 | 6.9 |
| Grade 7 | 487 | 12.5 | 393 | 8.8 | 456 | 8.9 |
| Grade 8 | 645 | 16.6 | 577 | 13.0 | 586 | 11.5 |
| Grade 9 | 572 | 14.7 | 723 | 16.3 | 966 | 18.9 |
| Grade 10 | 746 | 19.2 | 797 | 17.9 | 841 | 16.5 |
| Grade 11 | 299 | 7.7 | 674 | 15.2 | 794 | 15.6 |
| Grade 12 | 171 | 4.4 | 332 | 7.5 | 487 | 9.5 |
Note: The above data were retrieved from TEA (2017a), TAPR for School 3.
Table 5 reveals the number of students enrolled in School 4 for the 2013–16 school years. School 4 was established in the 2013–14 school year. This school has the third fewest students enrolled. Data for this virtual school were reported separately by school level into the TAPR system. For the purpose of this study, the information was compiled into one school.
School 4 Number of Enrolled Students and Percentage by Grade Level and Year
| School Year and Grade Level | 2013–2014 | 2014–2015 | 2015–2016 | |||
|---|---|---|---|---|---|---|
| Number | Percentage | Number | Percentage | Number | Percentage | |
| Grade 3 | 5 | 3.96 | 1 | .54 | 23 | 3.50 |
| Grade 4 | 4 | 3.17 | 13 | 7.03 | 43 | 6.53 |
| Grade 5 | 5 | 3.96 | 3 | 1.62 | 52 | 7.90 |
| Grade 6 | 6 | 4.76 | 7 | 3.78 | 61 | 9.27 |
| Grade 7 | 17 | 13.29 | 20 | 10.81 | 82 | 12.46 |
| Grade 8 | 13 | 11.11 | 20 | 10.81 | 96 | 14.59 |
| Grade 9 | 27 | 21.43 | 41 | 22.16 | 80 | 12.16 |
| Grade 10 | 19 | 15.08 | 38 | 20.54 | 93 | 14.13 |
| Grade 11 | 13 | 10.32 | 27 | 14.59 | 83 | 12.61 |
| Grade 12 | 16 | 12.70 | 15 | 8.11 | 45 | 6.84 |
Note: The above data were retrieved from TEA (2017a), TAPR for School 4.
Instruments
The state assessments continue to be based on the TEKS, the standards designed to prepare students to succeed in college and careers and to compete globally (TEA, 2017d). However, consistent with a growing national consensus regarding the need to provide a more clearly articulated K-16 education program that focuses on fewer skills and addresses those skills in a deeper manner, the TEA is implementing a new assessment model for the STAAR tests for elementary, middle, and high school (TEA, 2017c). The source of data for this study is results from the STAAR.
According to the education agency for this state (TEA, 2017b), Texas provides annual academic accountability ratings to its public school districts, charters, and schools. The ratings are based largely on performance on state standardized tests and graduation rates. The ratings examine student achievement, student progress, efforts to close the achievement gap, and postsecondary readiness. The state accountability system assigns one of three academic ratings to each district and campus: Met Standard, Met Alternative Standard, or Improvement Required. Below is a description of individual tests for the STAAR testing program that were used in this study according to TEA (2017b).
Demographic Characteristics
The racial breakdown of students is categorized as Black, Hispanic, White, American Indian, Asian, Pacific Islander, and Two or more races. For the purposes of this research study, the following racial categories were used: Black, Hispanic, Caucasian, Asian, and Two or more races. The categories of American Indian and Pacific Islander were not used because there was not enough representation amongst the schools for these groups. Gender is categorized by male and female. No other demographic information was included in this study.
Table 6 shows the total racial distribution of students enrolled in Southwestern state virtual schools in 2013–14. Table 7 shows the total gender distribution of students enrolled in Southwestern state virtual schools in 2013–16.
2013–2016 Total Racial Distribution of Students Enrolled in Virtual Schools in a Southwestern State
| Virtual School | Black | Caucasian | Hispanic | American Indian | Asian | Pacific Islander | Two or More Races |
|---|---|---|---|---|---|---|---|
| School 1 | 41 | 529 | 87 | 1 | 27 | 2 | 46 |
| School 2 | 1,863 | 8,252 | 4,514 | 85 | 438 | 28 | 620 |
| School 3 | 1,495 | 7,280 | 3,590 | 131 | 412 | 63 | 475 |
| School 4 | 98 | 508 | 272 | 5 | 43 | 3 | 39 |
Note: The above data were retrieved from TEA (2017a), TAPR for the individual schools for 2013–2014.
2013–2016 Total Gender Distribution of Students in Virtual Schools in a Southwestern State
| Virtual School | Male | Female |
|---|---|---|
| School 1 | 278 | 455 |
| School 2 | 7,045 | 8,755 |
| School 3 | 5,427 | 8,016 |
| School 4 | 443 | 746 |
Note: The above data were retrieved from TEA (2017a) website for the individual schools for 2014–2015.
Data Analysis
In order to test the research questions, the achievement percentages and the student sample sizes were averaged across the 3 school years studied within each ethnic group. Data on achievement within the two smaller schools was limited, so, to increase the power of the comparisons, virtual school size was operationalized by grouping together the two schools with more than 3,000 students enrolled, and by grouping together the two schools with under 1,000 students enrolled. The average achievement percentages representing all 3 years were again averaged across the two smaller schools and across the two larger schools within each racial group. The average number of students representing all 3 years were summed across the two smaller schools and across the two larger schools within each racial group. Finally, the achievement percentages were averaged across all racial groups, and the numbers of students represented were summed across all racial groups to create overall achievement data representing all racial groups and all school years.
Achievement percentages were not available for all years within each racial group, so only the average number of students represented by the existing percentages was used in the calculations. For example, achievement percentages were only available for Black students in School 4 during the 2015–2016 school year, and no data were available on Black students in School 1 during any of the 3 years. Therefore, the small school achievement percentages for Black students across all years were represented by School 4 achievement percentages for Black students in the 2015–2016 school year, and the associated sample size was represented by the 68 Black students attending School 4 during the 2015–2016 school year.
Once achievement data had been compiled according to the protocols detailed above, z tests were computed to compare the achievement percentages between the smaller versus the larger schools within each racial group and across all racial groups combined. The overall results to address the main components of the research questions are presented in Table 8.
Comparison of Large Versus Small School STAAR Percentage at Phase-In Satisfactory Standard or Above All Grades for 2013–2016
| Test | Large Schools | Small Schools | z | p < | ||
|---|---|---|---|---|---|---|
| % | N | % | N | |||
| Read 5 | 82.3 | 9,646 | 100.0 | 628 | −11.5 | 0.001 |
| Math 5 | 66.7 | 9,075 | 92.3 | 849 | −15.4 | 0.001 |
| Read 8 | 91.1 | 9,646 | 98.9 | 369 | −5.3 | 0.001 |
| Math 8 | 74.6 | 9,062 | 84.2 | 327 | −3.9 | 0.001 |
| English I | 77.7 | 9,712 | 96.1 | 643 | −11.1 | 0.001 |
| English II | 78.7 | 9,799 | 96.3 | 661 | −10.9 | 0.001 |
| Algebra I | 72.5 | 9,712 | 91.3 | 560 | −9.8 | 0.001 |
Comparison of Large Versus Small School STAAR Percentage at Phase-In Satisfactory Standard or Above All Grades for 2013–2016 for Black Students
| Test | Large Schools | Small Schools | z | p < | ||
|---|---|---|---|---|---|---|
| % | N | % | N | |||
| Read 5 | 71.3 | 1,119 | 100.0 | 68 | −5.2 | 0.001 |
| Math 5 | 43.8 | 1,060 | 100.0 | 68 | −9.0 | 0.001 |
| Read 8 | 88.0 | 1,119 | ||||
| Math 8 | 56.8 | 1,060 | ||||
| English I | 68.3 | 1,119 | 100.0 | 68 | −5.5 | 0.001 |
| English II | 65.2 | 1.206 | 100.0 | 68 | −5.9 | 0.001 |
| Algebra I | 59.3 | 1.119 | 100.0 | 68 | −6.7 | 0.001 |
Comparison of Large Versus Small School STAAR Percentage at Phase-In Satisfactory Standard or Above All Grades for 2013–2016 for Caucasian Students
| Test | Large Schools | Small Schools | z | p < | ||
|---|---|---|---|---|---|---|
| % | N | % | N | |||
| Read 5 | 84.0 | 5,177 | 100.0 | 442 | −9.1 | 0.001 |
| Math 5 | 71.8 | 4,851 | 97.0 | 599 | −13.4 | 0.001 |
| Read 8 | 90.8 | 5,177 | 97.8 | 264 | −3.9 | 0.001 |
| Math 8 | 72.3 | 4,851 | 86.7 | 246 | −5.0 | 0.001 |
| English I | 73.7 | 5,177 | 89.0 | 395 | −6.8 | 0.001 |
| English II | 79.0 | 5,177 | 92.6 | 395 | −6.5 | 0.001 |
| Algebra I | 72.2 | 5,177 | 91.0 | 322 | −7.4 | 0.001 |
Comparison of Large Versus Small School STAAR Percentage at Phase-In Satisfactory Standard or Above All Grades for 2013–2016 for Caucasian Students
| Test | Large Schools | Small Schools | z | p < | ||
|---|---|---|---|---|---|---|
| % | N | % | N | |||
| Read 5 | 83.5 | 2,701 | 100.0 | 118 | −4.8 | 0.001 |
| Math 5 | 59.5 | 2,530 | 80.0 | 182 | −5.5 | 0.001 |
| Read 8 | 89.8 | 2,701 | 100.0 | 105 | −3.4 | 0.001 |
| Math 8 | 71.0 | 2,530 | 80.0 | 52 | −1.4 | NS |
| English I | 72.5 | 2,701 | 91.5 | 118 | −4.6 | 0.001 |
| English II | 77.3 | 2,701 | 92.7 | 170 | −4.7 | 0.001 |
| Algebra I | 66.2 | 2,701 | 83.0 | 170 | −4.5 | 0.001 |
Comparison of Large Versus Small School STAAR Percentage at Phase-in Satisfactory Standard or Above All Grades for 2013–2016 for Asian Students
| Test | Large Schools | Small Schools | z | p < | ||
|---|---|---|---|---|---|---|
| % | N | % | N | |||
| Read 5 | 91.2 | 283 | ||||
| Math 5 | 97.0 | 269 | ||||
| Read 8 | 98.0 | 283 | ||||
| Math 8 | 94.5 | 269 | ||||
| English I | 96.0 | 294 | 100.0 | 34 | −1.2 | NS |
| English II | 94.8 | 294 | ||||
| Algebra I | 92.6 | 294 | ||||
Comparison of Large Versus Small School STAAR Percentage at Phase-in Satisfactory Standard or Above All Grades for 2013–2016 Multiracial Students
| Test | Large Schools | Small Schools | z | p < | ||
|---|---|---|---|---|---|---|
| % | N | % | N | |||
| Read 5 | 81.4 | 365 | ||||
| Math 5 | 61.7 | 366 | ||||
| Read 8 | 88.7 | 365 | ||||
| Math 8 | 78.5 | 353 | 86.0 | 29 | −1.0 | NS |
| English I | 78.0 | 420 | 100.0 | 29 | −2.8 | 0.01 |
| English II | 77.4 | 420 | 100.0 | 29 | −2.9 | 0.01 |
| Algebra I | 72.4 | 420 | ||||
Findings
In general, the students in the smaller schools performed significantly better across the 3 school years (p < .001). There were a few exceptions. Tables 9, 12, and 13 reflect the fact that even after combining the two smaller schools, sufficient data were sometimes not available for comparisons between the larger and smaller schools. In addition, it is possible that the nonsignificant results shown in Tables 11, 12, and 13 are due to the small number of students representing the smaller virtual schools.
Research Question
What is the relationship between virtual school size and students’ academic achievement in STAAR English Language Arts/Reading in Grades 5 and 8, Math in Grades 5 and 8, English I, English II, and Algebra I testing scores relating to race? In all testing categories, students performed better in small virtual schools compared to large virtual schools.
RQ 1a. What is the relationship between virtual school size and students’ academic success in STAAR English Language Arts/Reading in Grades 5 and 8, Math in Grades 5 and 8, English I, English II, and Algebra I when race is concerned? In all testing categories, students performed better in small virtual schools compared to large virtual schools in all racial categories.
RQ 1b. What is the relationship between virtual school size and students’ academic success in STAAR English Language Arts/Reading in Grades 5 and 8, Math in Grades 5 and 8, English I, English II, and Algebra I when gender is concerned? Conducting a statistical analysis concerning student achievement and gender was not possible, as the student achievement data were only aggregated by racial categories. It was determined that there are more females than males in all schools represented.
Interpretation of Findings
It was unanticipated to find the results unilaterally revealing small virtual schools outperforming their counterpart of larger virtual schools in all categories. Notable trends were revealed in this study. First, small virtual schools outperform large virtual schools in academic achievement. Second, female students outnumber male students. Third, virtual schools are growing in demand. There was an increase in student population for all three school years and for all four virtual schools in this study.
Context of Findings
The results of this study align with prior studies that indicate small schools surpass large schools. Carbaugh (2017) states small school benefits consist of ease in developing student to student relationships, staff familiarity with each other and the students, teachers accepting more responsibility for student learning, a stronger sense of community, and encouragement of better teaching, all of which indirectly impact student achievement and affect (Leithwood & Jantzi, 2009). As mentioned in the literature review, the Matthew Project (Friedkin, & Necochea, 1988) found that school performance benefited from smaller school size in impoverished California communities. This study did not take into consideration poverty or economically disadvantaged categories.
Implications of Findings
The intent of this study was to examine the relationship between virtual school size and student achievement. Despite the limited sample size of four virtual schools, it is evident from the results that small virtual schools are outperforming large virtual schools. As noted above, virtual schools are growing in the number of students enrolled each year. Virtual education has the potential not only to help solve many of the most pressing issues in K–12 education, but to do so in a cost-effective manner (Dillon & Tucker, 2011). More than 1 million public-education students now take online courses, and as more districts and states initiate and expand online offerings, the numbers continue to grow (Dillon & Tucker, 2011). Further research and practice could verify whether or not the trends found in this study are isolated to this specific state or if they are regional or nationwide.
The strongest argument for large schools is funding; it helps districts maintain costs while educating a large number of students. Classroom quality and school characteristics predicted youth functioning regardless of school type, reshaping the research and policy debate with renewed focus on classroom quality and school size instead of grade organization (Holas & Huston, 2012). This study helps to support the notion that small schools are better than large schools. Even though districts could save money by investing in large schools, small schools could benefit concerning student achievement outcomes.
Limitations of the Study
This study was limited to virtual schools in a single southwestern state. At present, there are only six public virtual schools in the state, and only four were used to ensure the integrity of the study. Schools 5 and 6 were omitted from the study because they were evaluated using an alternative accountability rating. The data collected were specific to the state and may not be representative of other states. Other mitigating factors of socioeconomic status, English language learners status, special education rate, mobility rate, dropout rate, class size, instructional expenditure per pupil, or attendance rate exhibiting interaction effects can be used to predict student achievement (Riggen, 2013). They were not evaluated in this study. Assessment results can be most helpful if considered as one component of an evaluation system (TEA, 2017e). Data collected for this study were retrieved solely from the state education website using assessment results and other reporting criteria from archival data for the 2013–2016 school years. According to TEA (2017b), standardized assessments are a valuable tool for evaluating programs. However, any assessment can furnish only one part of the picture (TEA, 2017b). The STAAR end-of-course assessments are not able to identify, let alone measure, every factor that contributes to the success or failure of a program (TEA, 2017b).
Furthermore, all data collected were retrieved from the state’s education website. In large-scale assessments, such as statewide testing programs, there are many steps involved in the measurement and reporting of student achievement (Wu, 2010). There may be sources of inaccuracies in each of the steps (Wu, 2010). The accuracy of reporting is dependent on individual virtual schools.
Future Research Directions
The debate regarding school size will continue in the years to come, especially as virtual schools grow. There is little research or publicly available data on the outcomes from K–12 online learning (Dillon & Tucker, 2011). This researcher was unable to obtain any relevant literature based on virtual school size and its relationship to student achievement for public virtual schools in the K–12 sector. Further research regarding virtual school size and academic achievement could include not only a single state, but include regions or an in-depth study of the entire country. Also, this study only analyzed data according to student achievement results and race. Gender data were observed based on the number of each category. Additionally, studies could explore other important factors such as graduation rates, economically disadvantaged students, and student-to-teacher ratios. Future research could explore other types of research, including a comparison study reviewing the academic achievements in virtual schools to brick-and-mortar schools that could assist lawmakers and legislatures in decisions regarding funding.
Summary
The results revealed in this study indicate students in the smaller schools performed significantly better across the three school years. The study analyzed enrollment size and STAAR English Language Arts/Reading in Grades 5 and 8, Math in Grades 5 and 8, English I, English II, and Algebra I testing scores relating to race. In all categories of both test category and race, students in smaller schools performed better than students in larger virtual schools. Notable trends were revealed in this study. First, small virtual schools outperform large virtual schools in academic achievement. Second, female students outnumber male students. Third, virtual schools are growing in demand. There was an increase in student population for all three school years and for all four virtual schools in this study.
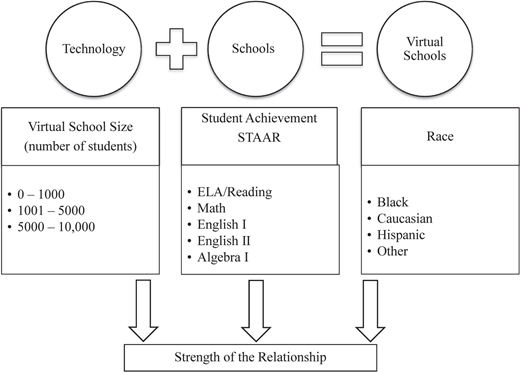
Conceptual Framework: Examining the Relationship Between Virtual School Size and Student Achievement
Conceptual Framework: Examining the Relationship Between Virtual School Size and Student Achievement
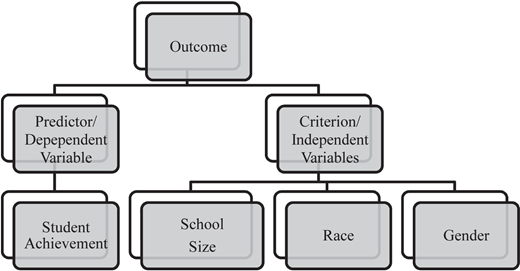
Predictor Variables and Criterion Variables Revealing Outcome
Predictor Variables and Criterion Variables Revealing Outcome

