This study aims to explore the factors responsible for influencing the service quality (SQ) of department stores in Albaha region, Saudi Arabia. This study also examines the level of influence on SQ.
Primary data was collected from 600 customers out of which 508 questionnaires were included for analysis using retail service quality scale (RSQS). Quota sampling technique was adapted for data collection from different cities of Albaha province. SPSS software was used to analyse the data using multiple linear regression analysis.
Three dimensions have a positive significant impact on SQ (physical aspect, problem-solving and reliability), whereas one dimension (personal interactions) has a negative significant influence and one dimension (policy) is found to be a highly insignificant factor.
Further investigation is required for the negative but significant behaviour of personal interaction and insignificant impact of policy as factors.
This study outlines the dimensions having positive and significant influence of SQ on the department stores.
This study suggests socially and culturally acceptable methods to improve SQ in Albaha.
The research suggests that personal interaction has a negative influence on SQ; this deviation of results from the literature may be due to the cultural variances in KSA which needs to be further investigated, as customers in Albaha are not willing to converse and interact with the seller.
Introduction
Saudi Arabia is considered to be one of the richest gulf countries with $197,342m of gross domestic product (GDP) in the second quarter of 2019. This ranks Saudi Arabia at number 17 in the ranking of GDP of the 50 countries. All this information helps to understand that Saudi Arabian consumers have high purchasing power. Consumers with high purchasing power have higher standards of expectations (Wood and Neal, 2009; Lemke et al., 2011; Teoh and Gaur, 2019). Measuring service quality (SQ) was never an easy task. But in the context of Saudi Arabia where the consumers have high spending power, this task of measuring SQ becomes more difficult. As it is difficult to measure and define the SQ, it has become the most deliberated and discussed topic for researchers in the recent past as the advent of internet enhanced the consumers’ expectations. Nowadays, consumers are more informed about SQ(Durante and Griskevicius, 2016; Hochstein et al., 2019). Most of the research studies have defined quality as when the expected services meet the delivered services, it is known as quality. In other words, when the gap in delivered services and the expected services does not exist, it is called SQ. The extent to which a service meets customers’ needs or expectations, and it involves a comparison of customer expectations with customer perceptions of actual service performance (Parasuraman et al., 1985, 1988; Lewis and Mitchell, 1990). Those customers who are satisfied are expected to continue their loyalty (Wong and Sohal, 2003). The vehicle to ensure consumer satisfaction is SQ (Sivadas and Baker-Prewitt, 2000). It also helps positioning in a competitive environment (Mehta et al., 2000) and retention and patronage (Yavas et al., 1997). With the increasing number of retail department stores, there is a need to study and explore the factors responsible for SQ. Hence, the purpose of this study is to further explore the factors and their impact on SQ in the context of Saudi Arabia.
Literature review
Firms get their competitive advantage by exploiting the technology for the aim of enhancing SQ and gathering market demand (Parasuraman et al., 1985, 1988). For a really long amount of time, varied researchers have developed a service perspective (Kaul, 2007; Nguyen Dang DuyNhat, 2007; Shucui, 2009; Zia and Azam, 2013). The construct of SQ ought to be usually approached from the purchaser’s perspective, therefore, it becomes totally different values, totally different ground of assessment and totally different circumstances (Lemke et al., 2011; Durante and Griskevicius, 2016). It was also found that SQ is an extrinsically perceived attribution supported by the purchasers concerning the service that the customer perceived through the service encounter (Parasuraman et al., 1985, 1988). SQ is not only concerned within the final product and services, however, conjointly concerned within the production and delivery method, so worker involvement in method plan and commitment is very important to provide final product or services (Sohail and Shaikh, 2008). The character of SQ needs a particular approach to identify and implement SQ (Siu, 2009; Wirtz and Lovelock, 2016).
It has been observed that SERVQUAL scale has been empirically tested by many studies including pure service (e.g. banking, long-distance telephone service, securities brokerage and credit card service) but it has not been successfully adapted and validated in a retail store environment. Further, a measure of retail SQ must capture additional dimensions (Dabholkar et al., 1996). As a result of numerous focus groups, a scale has been developed and named as retail service quality scale (RSQS) that includes five dimensions.
Retail service quality scale
It has been observed that the retail business witness a peculiar behaviour of customers and their retail quality perceptions which cannot be measured using the available measurement scales for SQ (Finn and Lamb, 1991). To contextually fit the retail industry, Dabholkar et al. (1996) developed RSQS. On the basis of SERVPERF scale, the RSQS scale consists of 28 items of which 17 items are reserved from SERVPERF and 11 items are introduced by qualitative research by Dabholkar et al. (1996). This RSQS scale consists of five dimensions, namely, physical aspects which is related to the concept of retail store appearance and its store; reliability which is about the retailers promises and about doing the right things; personal interaction which is very peculiar about the Saudi consumers is related to the employees courteousness, helpfulness is related to inspiring confidence in customer; problem-solving is another variable that talks about if the store employees are capable to handle returns and exchanges, and finally the policy aspect is related to the rules and standards associated to the quality of the merchandise, parking space availability, operation hours timings and credit cards-related issues.
Research question
The main issues addressed in this research are related to the retail SQ using RSQS in the department stores of Albaha region Saudi Arabia. The researcher has tried to measure the overall retail SQ in stores by evaluating all five dimensions from the consumer’s perspective.
Hypothesis
Null hypothesis states that there is no probability to have a linear relationship between the department store SQ (dependent) and independent factors (all five factors).
Physical aspects
Physical aspects are related to the equipment and fixtures, the physical facilities inside and outside the store, materials related to the services available inside the store and the convenience associated with it. It has been observed that the evaluation of SQ of retailers starts as consumers come in contact to the retailers (Bitner, 1990). This dimension has a broader meaning than does the SERVQUAL’s tangible dimension. In addition to the appearance of the facilities, it also takes into account the convenience offered the customer by the layout of physical facilities (Dabholkar et al., 1996). The only concept of structure and layout which is another form of physical aspect is very important for ecommerce (Santos, 2003). It has been observed that if the customers rate physical aspects on the higher scale than the overall evaluation of SQ is also rated higher. This aspect is similar to the pleasant ambience as appreciated by many researchers (Roschk and Hosseinpour, 2020). Therefore, the following hypothesis is framed to find the impact of the physical aspect on the overall retail SQ.
There is no positive impact of physical aspects on the overall evaluation of department store SQ.
Reliability
The concept of reliability in RSQS is similar to the concept of reliability in SERVQUAL (Dabholkar et al., 1996). This concept of reliability is related to the concept of keeping task-related promises, providing services at the right level of customers’ expectations, making the sales error-free and customers friendly. The higher customers appreciate reliability, the higher is the overall evaluation of retail SQ. It has been observed that there is a direct linkage between the reliability and the SQ (Ghobadian et al., 1994; Seth et al., 2005); therefore, the following hypothesis was framed.
There is no positive impact of reliability on the overall evaluation of department store SQ.
Personal interaction
The personal interaction means the interaction of the sales personal to the customers face to face to solve is queries and other related issues. This needs to have information related to the product and services and to answer their queries. This process inspires confidence in the customers. The act of prompt service and employee’s willingness to respond to customer’s requests is also a part of personal interaction. Paying attention to the individual customers, being courteous and handling customers adequately is a very effective way to improve SQ (Dabholkar et al., 1996). Personal interaction is a very powerful tool to develop SQ (Siu and Tak-Hing Cheung, 2001a; Yuen and Chan, 2010). Higher the personal interaction, higher is the overall understanding of retail SQ. To measure this aspect of SQ, hence the following hypothesis is framed to test their relationship of personal interaction and SQ.
There is no positive impact of Personal Interaction on the overall evaluation department store SQ.
Problem-solving
The concept of satisfying the customers by solving their issues is called problem-solving. It includes management of returns and exchanges, addressing the customers’ complaints, and so on (Dabholkar et al., 1996). Retailers can have an effective strategy and enhance the SQ perceptions by providing a solution to their issues and problems (McGuire, 2017; Reynaers, 2020). Higher the problem-solving capabilities of a retailer, higher is the overall evaluation of retail SQ. Therefore, the following hypothesis was frame.
There is no positive impact of problem solving on the overall evaluation of department store SQ.
Policy
This dimension captures aspects of SQ that are directly influenced by retailers’ policy (Dabholkar et al., 1996; Siu and Tak-Hing Cheung, 2001a). It includes high-quality merchandise, convenience of parking and operating hours as well as accepting major credit cards (Siu and Tak-Hing Cheung, 2001b). The consumers expect a swift and hassle-free purchase and after sales service; therefore, a well-established and clear policy in a retail format is always appreciated (Briggs et al., 2020). Therefore to measure the policy aspect retail service following hypothesis was framed.
There is no positive impact of policy on the overall evaluation of department store SQ.
Research methodology
This study was conducted to explore the factors responsible for contributing to the SQ of department stores in Albaha, KSA. Active retail shoppers are the population for this study; it includes both Saudi shoppers as well as expatriates (citizens of other countries living in Saudi Arabia). While collecting data, both Saudi shoppers and expatriates shoppers were considered. Both have been considered to form uniform SQ perceptions. A data of 600 retail shoppers were collected through a personally administered questionnaire. After the careful analysis, it was found that only 508 questionnaires are fit to be included for the study. Customers who were coming for shopping were asked to fill the questionnaire after they have finished shopping or while they were waiting for billing and standing in queues. All together ten stores were selected from the Albaha city region to collect data. From each store, 60 questionnaires were filled by the respondents. As the customers’ walk-in is high on weekends, the data was collected on the weekends of January 2019.These stores were from different locations in the city, namely, from Al-Aquiq city, Albaha city and Buljurshi city.
Primary data was collected through self-administered RSQS questionnaire. As the RSQS has been tried and confirmed through various retail formats, regions and countries and provided authenticated results, no validity test was performed. RSQS is applicable in Saudi Arabian context to study the SQ (Zia and Khan, 2018; Zia and Hashmi, 2019). Several studies have used this scale to explore the SQ across regions; therefore, this study adapts RSQS to explore the factors responsible for SQ in apparel retail stores in Saudi Arabia.
The instrument used for data collection was RSQS with 28 questions. One question for overall SQ was inserted at the end of the questionnaire. Questionnaire used a five-point Likert scale (1 – strongly agree, 5 – strongly disagree). One answer was allowed to choose from the available choices ranging from strongly agree to strongly disagree. SPSS software was used to do the factor analysis and related calculations like Cronbach’s alpha.
Analysis and results
This study checks the validity of scale using factor analysis, whereas the reliability was measured using Cronbach’s alpha. Table I shows the basic statistics associated with 28 questions. Table II shows the overall value of Cronbach’s alpha for all the five independent dimensions together followed by the individual Cronbach’s alpha value calculation for each dimensions. Tables II and III show the details of the Cronbach’s alpha value calculation.
Table II shows the overall Cronbach’s alpha value obtained is 0.917 which shows high reliability of the scale. The overall value of Cronbach’s alpha for all five dimensions is 0.917, which indicates a good reliability of the scale. After the actual data collection, the reliability estimates were computed and as shown in the table. As the value is well above 0.7, it is valid to use this scale for further analysis.
Table III shows the trustworthiness and stability of an instrument is determined by its reliability. Reliability refers to the degree of dependability and stability of a scale. The reliability of the construct is determined by computing the alpha coefficient of internal consistency (Cronbach, 1951). Cronbach’s coefficient alpha value of 0.6 is considered acceptable for the exploratory purposes, 0.7 is considered adequate and 0.8 good for confirmatory purposes. All the dimensions of the scale scored the Cronbach’s alpha value ranging from 0.658 to 0.858 that indicates good consistency among all the items of the scale.
The enter method for the multiple linear regression analysis for analysing this data was adapted. In this method of computation, the model includes all the dependent dimensions in the model. We have used this method because the dimensions of RSQS are well established and tested model in the past. This method further forces all the variables to be part of the model; therefore, none of the dimension was removed.
Table IV shows two tests that indicate the suitability of data for structure detection. The proportion of variance in the variables that might be caused by underlying factors is computed by Kaiser–Meyer–Olkin measure of sampling adequacy is a statistic test. A value of close to 1.0 is considered to be very high and it generally indicates that a factor analysis may be useful with the given data. It is also seen that as the accursed value was less than 0.50, the results of the factor analysis probably will not be very useful. In our case, the value is 0.610 which is in acceptable limits. Thereby, it can be said that there is a sample adequacy for this study. Bartlett’s test of sphericity tests the hypothesis that the correlation matrix is an identity matrix, which would indicate that the variables are unrelated and therefore unsuitable for structure detection. The value of 0.05 is considered to be very small. This level of significance indicates that a factor analysis may be useful for data adapted for the analysis. In our case, the significant value of 0.000 is high and therefore factor analysis is suitable for the present study.
The basic statically data reduction tool is factor analysis which is the methods of data reduction (Table V), it does this by seeking underlying unobservable (latent) variables that are reflected in the observed variables (manifest variables). SQ is the latent variable in this study, whereas the five dimensions are the observed variables. These five factors explain the variance in SQ up to 72.84 per cent. It can be observed from the results of factor analysis (Table V) that there are five major dimensions that have an impact on the SQ of a department store. Among all the factors, “problem-solving” has the highest capacity to explain the variance in SQ of a department store (85.8 per cent) followed by “Personal interaction” (0.832).
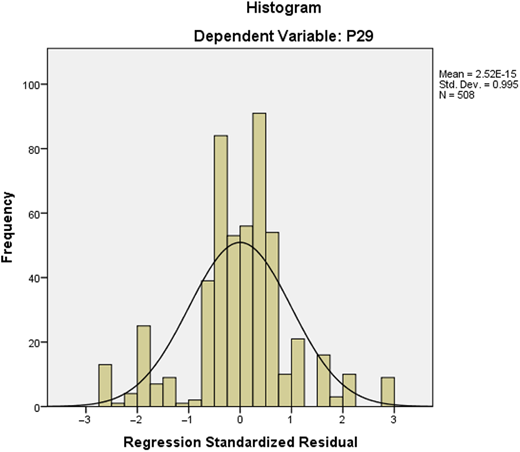
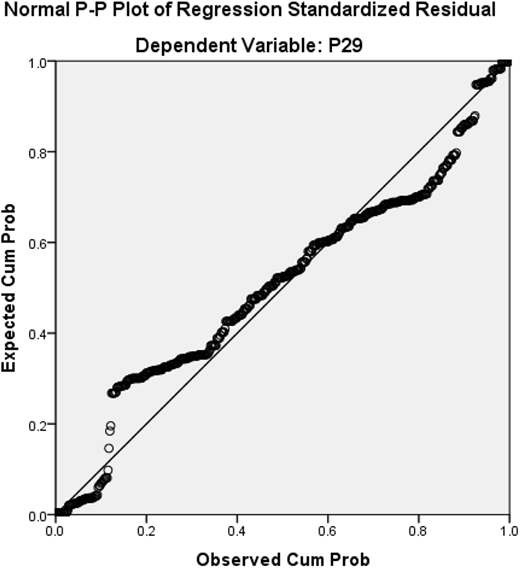
Table VI illustrates the summary results of multiple linear regression analysis and overall fit statistics. It was found that the adjusted R2 of our model is 0.414 with the R2 = 0.419. This means that the linear regression explains only 41.9 per cent of the variance in the data. Furthermore, it means that 41.9 per cent of the variance in the dependent variable (department store SQ) can be explained by the independent variables (policy, reliability, problem-solving, personnel interaction and physical aspect).The Durbin–Watson d is 2.020, which is between the two critical values of 1.5 < d < 2.5. Therefore, we can accept that there is no first-order linear auto-correlation in our multiple linear regression data.
Table VII show the result of F-test. In this model, the linear regression F-test has the null hypothesis that the model explains zero variance in the dependent variable (R2= 0). The F-test is highly significant, thus we can assume that the model explains a significant amount of the variance in department store SQ.
Table VIII shows the multiple linear regression estimates including the intercept and the significance levels. In this enter method of multiple linear regression analysis, it was found that this model has a significant intercept of (0.739) and highly significant reliability (0.216), personal interactions (−0.478),physical aspect (0.053) and problem-solving (0.995). Furthermore, it was found that policy (0.064) dimension is highly insignificant for the customers.
The first value in this model is the value of “constant” which is the predicted value of retail SQ when all other variables are 0. The coefficient for physical aspect is 0.053. So for every unit increase in physical aspect, we expect 0.053-point increase in the SQ, holding all other variables constant.
Similarly, the coefficient for reliability is 0.216. So for every unit increase in reliability, we expect 0.216-point increase in the SQ, holding all other variables constant. Furthermore, the coefficient for “Personal interaction” is −0.478. So for every unit increase in personal interaction, we expect −0.478 point decrease in the SQ, holding all other variables constant. Likewise, the coefficient for problem-solving is 0.995. So for every unit increase in problem-solving, we expect 0.995-point increase in the SQ, holding all other variables constant. Lastly, for the coefficient of “Policy” is 0.064. So for every unit increase in policy, we expect 0.064-point increase in the retail SQ, holding all other variables constant.
Therefore, it can be summarised that 1 unit change in four constructs (reliability, personal interaction, problem-solving and physical aspect) will have a positive impact in store SQ, whereas personal interaction will have a negative impact on the store SQ:
The coefficient for reliability (0.216) is highly significant because its p-value is 0.000, which is larger than 0.05.
The coefficient for personal interaction (−0.478) is highly significant because its p-value is 0.000, which is larger than 0.05.
The coefficient for problem-solving (0.995) is highly significant as its p-value is 0.000, which is smaller than 0.05.
The coefficient for physical aspect (0.053) is significant as its p-value is 0.015, which is smaller than 0.05.
The coefficient for policy (0.064) is highly insignificant as its p-value is 0.276, which is smaller than 0.05.
In this study, it was found that reliability, problem-solving, physical aspect and personal interaction has a highly significant impact on the store SQ, whereas policy has a highly insignificant impact. Moreover, it was found that the physical interaction has a negative relation with the department store SQ. Similarly, Siu and Tak-Hing Cheung (2001b) found that the physical appearance and policy have the greatest impact on the overall SQ and on the future consumption in Hong Kong.
Moreover, it was also found that unit increase in reliability, problem-solving, physical aspect and policy will have a positive impact on the SQ. On the other hand, personal interaction will have a negative impact on the SQ.
The regression equation is SQ (Y) = α+β1 × 1+ β2 × 2+ β3 × 3+ β4 × 4+ β5 × 5
SQ = Service quality, α = Intercept Value (Constant), β1, β2, β3, β4 and β5 are the β values.
SQ(Y) = Constant (α) + β1 (Reliability) + β2 (Personal interaction) + β3 (Problem-Solving) + β4 (Policy) + β5 (Physical Aspect).
SQ = 0.739 + 0.216 (Reliability) − 0.478 (Personal interaction) + 0.995 (Problem-Solving) + 0.064 (Policy) +0.053 (Physical Aspect).
The negative β values of personal interaction shows its inverse relationship with SQ which is an area of research to explore. These findings need further exploration of reasons beyond the scope of this research which can justify inverse relationship of department store SQ and personal interaction.
Table IX illustrate the correlations and covariance among the five independent variables. Personal interaction and physical aspect have highest positive correlation which means that 7.10 per cent of these two dimensions are correlated to determine the department store SQ. Personal interaction and problem-solving have the highest negative correlation (−0.827) which means that 82.7 per cent of these dimensions are correlated to determine the SQ.
Discussions
In this study, the null hypothesis states that there is no probability of linear relationship between dependent (store SQ) and predictors variables (physical aspect, reliability, personnel interaction, problem-solving and policy) was rejected and out of five variables, four variables were found to have a significant impact on a dependent variable with p-value less than 0.05 and one variable (policy) has an insignificant impact with p-value more than 0.05 (Table X).
The first objective in this study was to explore the factors responsible for department store SQ in Albaha region, Saudi Arabia. It was found that all the five dimensions (physical aspect, reliability, personnel interaction, problem-solving and policy) have an impact on the department store SQ in Albaha region. Furthermore, it was found that four dimensions (physical aspect, reliability, policy and problem-solving) have a positive impact in department store SQ, whereas the one dimension (personal interaction) has a negative impact. These findings are in conformity with the findings of Ali et al. (2017) and Suhartanto et al.(2019) where the researcher found the positive impact of seven sub dimensions which include dimensions such as appearance, convenience, promises, inspiring confidence, interaction, problem-solving and policy, however, the two dimensions are not valid, namely, doing it right and helpfulness. Similarly, Siu and Tak-Hing Cheung (2001b) found problem-solving, personal interaction and policy contribute significantly to customer loyalty which he indirectly determined by retail SQ.
This study highlights the importance of problem-solving in building SQ. Customers pay maximum prominence to problem-solving for department store SQ. So it can be said that Saudi Arabian shoppers in Albaha region consider maximum SQ in stores where they get answers to their problem. This problem solution includes returns ease, exchange assistance or even refunds. Those stores which are incapable of proving the satisfactory solutions to their problems are rated at the lowest level.
Another objective of this study was to investigate the impact of factors responsible for department store SQ in Albaha region, Saudi Arabia. It was found that “problem-solving” have the highest impact, whereas “personal interaction” has the lowest but significantly negative impact on SQ of Table X. This study revealed that retail SQ is negative but significantly influenced by personal interaction. Similar results were found by Siu and Tak-HingCheung (2001b) where he concluded that there is no significant impact of personal interaction on retail SQ.
This finding also makes a point that in department store SQ, people give due importance to problem-solving and reliability, whereas in apparel stores, SQ customers pay more importance to problem-solving followed by physical aspect (Zia and Khan, 2018; Zia, 2019; Zia and Hashmi, 2019).
Conclusions
Based on this study, it can be concluded that if the departmental stores in Albaha region want to increase the SQ, but for this purpose, they have to pay more importance to the reliability, problem-solving and physical aspect which has a significant impact on the SQ. These three dimensions are positively influencing the SQ which means that any improvement in these three aspects enhances the SQ of the departmental stores. The personal interaction dimension has a negative but significant impact on the SQ. This means that if retailers try to have more personal interactions with the customers then they might feel uncomfortable and the SQ may diminish. Saudi customers do not personally appreciate the personal interaction with the retailers. Personal interaction scored the negative value which means that shoppers in this region do not expect personal interaction with the seller. This is very well understood because of the sociocultural restrictions in Saudi Arabia.
The results indicate that the improvement of the “problem-solving” will improve SQ as this dimension has β value of 0.995 followed by other dimensions. The sequence of their importance is mentioned in Table XI in their order of importance. Furthermore, it can be said that only problem-solving dimension has β value of 0.995 which is of utmost importance. On the other hand, it has been observed that one dimension (policy) has a positive but insignificant impact on the SQ. Therefore, if retailers strive to improve the policy aspect of departmental store, then also there will not be any change in the SQ. The policy variable scored p-value of 0.276 which makes it insignificant. This variable shows that customers hardly care about the policy aspect related to the departmental stores. Furthermore, it can be understood that more or less all department stores have a similar type of policy rules, therefore, the consumers are not bothered about this aspect.
Limitations
This study was conducted in Saudi Arabia; therefore, this study observes some limitations. One of the biggest limitations of the study is the end-user and the researcher’s interactions. As the society under study is a conservative society, it was very difficult to gather their unbiased opinions. Second, the gender mixing is not permitted because of which the male and female voluntaries have to be arranged for the data collection. Furthermore, as the society is developing, the product preferences and likeness are not developed yet. This creates a problem in customers understating about the services and the level of services. Until and unless a customer is exposed to services, they are not aware of the level of quality they expect from the companies.
Future research directions
In this study, it was observed that “personal interaction” scored a negative correlation. This negative β value shows its inverse relationship with retail SQ which is an area of research to explore. These findings need a further examination of reasons beyond the scope of this research which can justify inverse relationship of SQ and “personal interaction”.