Skip to article sections
Purpose

This study aims to investigate polylactic acid (PLA)/olive wood (PLA/OW) composites for material extrusion (MEX) and frames 3D pyrography as a process-tunable surface appearance feature, linking printing conditions to surface texture and colour.

Design/methodology/approach

PLA/OW filaments (0–20 Wt.% OW) were compounded and printed while varying extrusion temperature and printing speed. FTIR, differential scanning calorimeter and thermogravimetric analysis supported thermo-chemical assessment and oscillatory rheology aided printability evaluation. Surface texture was quantified by confocal areal roughness, and colour was measured in CIELAB and expressed as ΔE00. Multifactor analysis of variance and second-order response surfaces were used to map process–appearance relationships within the tested range.

Findings

Increasing OW reduced crystallinity and thermal stability and increased melt viscoelasticity, narrowing the practical processing window. Roughness rose with OW content and was further governed by printing conditions. Temperature dominated chromatic change, promoting darkening (lower L*) and higher ΔE00, whereas higher printing speeds reduced thermal exposure and helped preserve lighter shades. The response surfaces provide consistent maps for combined texture–colour tuning.

Practical implications

The approach can support aesthetic tuning using a single biofilled filament, potentially reducing the need for multiple coloured materials, filament changeovers and purge-related waste in design-oriented MEX applications.

Originality/value

This work provides a quantitative framework that treats 3D pyrography in PLA/OW as a controllable process feature, jointly mapping colour (CIELAB/ΔE00) and surface texture as outcomes of MEX parameters, enabling reproducible tone modulation without post-processing.

Material extrusion (MEX) additive manufacturing (AM) is increasingly used beyond rapid prototyping for design-oriented production, driven by geometric flexibility, short lead times and efficient material use (Turner et al., 2014). Polylactic acid (PLA) has become the main polymer in this process due to its biobased origin and better printability compared to typical thermoplastics (Tao et al., 2017). In parallel, efforts to reduce environmental impact have encouraged the use of lignocellulosic fillers such as wood flour and agroforestry fibres, which can lower cost and embodied energy while providing a natural visual and tactile finish (Ehman et al., 2025). These fillers can be incorporated through filament compounding and MEX when particle size and moisture levels are properly controlled; however, they also introduce interfacial and rheological challenges, often causing voids, particle pull-out and higher surface roughness, reinforcing the strong coupling between processing conditions and surface quality (Le Guen et al., 2019; dos Santos et al., 2025). Among these fillers, olive wood (OW) waste is especially important in Mediterranean regions, where the olive industry produces large amounts of low-value by-products (Lo Giudice et al., 2021; Taktak et al., 2023). Valorizing OW in PLA therefore supports circular-economy strategies while enabling wood-like aesthetics that can be tuned during printing (Fico et al., 2022).

Wood-filled PLA filaments for MEX have been repeatedly demonstrated as feasible, provided particle size and moisture are carefully controlled to avoid nozzle clogging and melt-flow instabilities. Practical guidelines recommend particles smaller than the nozzle diameter and thorough drying during extrusion and printing (Khan et al., 2025). However, increasing wood content commonly promotes voids, agglomeration and particle pull-out, particularly under suboptimal deposition settings or weak interfacial bonding, leading to rougher surfaces and more pronounced raster marks (Boschetto et al., 2013; Kariz et al., 2018). Despite these constraints, applications have expanded from functional prototypes to design-driven products, including acoustic panels (Sheng et al., 2024) and heat- or mass-exchange devices (Comino et al., 2023; Martínez-Sánchez et al., 2025). Pilot-scale dual-material concepts have further shown that varying wood content within a single part can be used to tailor appearance and functionality (Jaróg et al., 2025). Overall, PLA/wood systems have become a practical design material, although printability remains strongly dependent on morphology and surface quality (Mirza et al., 2025).

The mechanical behaviour of PLA/wood composites has been extensively studied, typically showing a trade-off between stiffness and toughness, where low to moderate wood contents increase modulus but higher loadings reduce strength and ductility due to dispersion limits, porosity and particle pull-out (Bharat et al., 2025; Sultana et al., 2024; Travieso-Rodriguez et al., 2021). These trends highlight the role of microstructure and interfacial quality, which are also directly reflected in surface morphology and printing quality (Liu et al., 2019).

On the rheological side, PLA/wood systems have been less discussed in MEX literature compared to their mechanical behaviour (Lee et al., 2021). Adding wood generally increases melt elasticity and complex viscosity, which can narrow the practical processing window when particle size, dispersion and moisture are not properly controlled during filament preparation and printing (Jasiński et al., 2025). These factors directly affect nozzle stability, flow continuity and inter-bead coalescence during deposition (Sun et al., 2008). Thermo-rheological studies on cellulose-reinforced PLA reported increasing storage modulus (G′) and complex viscosity with filler content while preserving shear-thinning behaviour, indicating reduced chain mobility and a greater sensitivity to extrusion temperature for achieving adequate bonding without thermal overstressing (Awal et al., 2015).

The thermal behaviour of PLA/wood composites has been examined in several studies (Comino et al., 2025). Differential scanning calorimetry (DSC) typically shows nearly constant melting temperatures but decreasing crystallinity with increasing wood loading, indicating limited chain packing and altered solidification behaviour (Taktak et al., 2024). The glass transition temperature often shifts slightly to lower values, consistent with interfacial heterogeneity and increased free volume at polymer–filler boundaries. Thermogravimetric analysis (TGA) commonly reveals reduced onset and peak degradation temperatures compared to neat PLA, together with higher char residue due to the lignocellulosic fraction, highlighting the need for careful temperature selection during MEX processing (Petinakis et al., 2010; Taktak et al., 2024). These thermal trends support defining a material-specific processing window for PLA/OW to balance appearance tuning and defect avoidance.

In MEX-produced PLA/wood parts, layer height, bead width, extrusion temperature and printing speed govern melt flow, bead coalescence and surface quality formation. Insufficient heat input leads to limited inter-filament diffusion and raster undulations (Sun et al., 2008), whereas excessive input promotes local instabilities and defects. Both mechanisms increase surface roughness and anisotropy, making process control critical for repeatable surface texture (Yang and Yeh, 2020). In addition to texture, the optical appearance of lignocellulosic composites is also process dependent (Kariz et al., 2018). While wood content sets the baseline tone, recent demonstrations of 3D-printed pyrography using wood filaments show that printing conditions can be used to intentionally modulate colour, commonly quantified in the CIELAB space (L*, a*, b*) (ISO, 2019; Moon et al., 2024). Similar parameter-driven effects have been reported even in neat PLA, where flow rate, nozzle temperature and cooling reshape raster geometry and heat transfer, producing mainly lightness-controlled (grayscale) changes rather than hue variations (Spina, 2025). Nevertheless, material-specific frameworks that jointly map processing conditions to both surface texture and colour development remain limited.

Although prior research has demonstrated the feasibility of wood-filled PLA for MEX and documented how processing influences morphology, PLA/OW-specific frameworks that translate deposition parameters into actionable texture–colour outcomes while respecting thermal constraints remain limited. Studies on OW and similar lignocellulosic systems have reported spectral and thermal trends. However, they have rarely been integrated into design-oriented process maps that connect deposition conditions with optical response. Likewise, surface-quality studies in additive manufacturing often focus on parameter control but seldom quantify surface texture and colour simultaneously within a unified methodology. Moreover, statistically supported PLA/OW correlations linking temperature and printing speed to CIELAB coordinates and ΔE00 together with surface texture are still missing. This research addresses that gap by treating 3D pyrography in PLA/OW as a process-tunable design feature, combining

  • surface texture quantification;

  • thermo-chemical support of the processing window using FTIR, DSC and TGA; and

  • analysis of variance (ANOVA)-supported empirical response-surface mapping of extrusion temperature and printing speed against CIELAB colour coordinates.

This work aims to establish 3D pyrography as a process-tunable optical function in PLA/OW parts produced by MEX, linking composition and printing parameters to surface texture and colour within a thermally supported processing window. To achieve this:

  • PLA/OW filaments (0–20 Wt.% OW) were developed and characterized through spectroscopy, calorimetry, thermogravimetry and rheology to assess material integrity and printability;

  • microstructure and primary surface texture were quantified and DOE-based ANOVA response surfaces were used to relate extrusion temperature and printing speed to CIELAB coordinates and ΔE00 within the tested range; and

  • the results were translated into process maps identifying combined roughness and lightness trends, enabling controlled darkening and demonstrated through proof-of-concept, process-controlled tonal patterns.

A series of composite filaments was formed by adding OW particles into a PLA matrix. Five formulations were created: neat PLA, PLA/OW05 (5 Wt.% OW), PLA/OW10 (10 Wt.% OW), PLA/OW15 (15 Wt.% OW) and PLA/OW20 (20 Wt.% OW). The filler loadings were chosen to span a range of compositions while maintaining good printability in MEX without needing extra processing aids or compatibilizers.

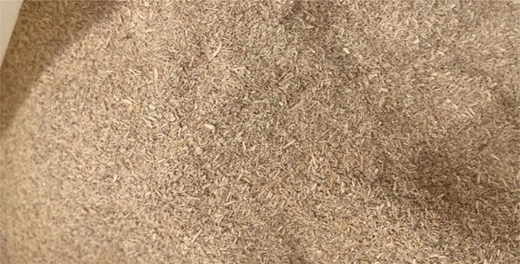
The polymer matrix used was Luminy LX175 (TotalEnergies Corbion, The Netherlands) (TotalEnergies Corbion, 2022), a commercial-grade PLA. The OW particles were produced as a by-product of pruning (Figure 1), then milled and sieved to obtain fractions with particle sizes less than 180 µm. This granulometry was chosen to ensure continuous extrusion without clogging or filament breakage.

Before compounding, PLA pellets and OW particles were dried at 60°C for 12 h to reduce moisture below 2 Wt.% and minimize hydrolytic degradation. Composite blends were prepared by gravimetric dosing and compounded in a co-rotating twin-screw extruder using a temperature profile of 170–190–200°C. The extrudate was pelletized and converted into 1.75 ± 0.03 mm filaments using a single-screw extruder under controlled temperature and draw conditions to ensure dimensional stability.

The morphological characterization of the filament surfaces was performed using a JSM6300 scanning electron microscope (SEM) (Jeol Ltd., Japan). Before observation, the samples were sputter-coated with a thin layer of gold to prevent surface charging. Micrographs were captured at an accelerating voltage of 5 kV and at various magnifications, with primary analysis conducted at 100 × using a 100 µm scale bar to assess overall morphology and defect distribution. Image analysis and quantitative defect evaluation were performed using ImageJ and the full processing workflow is reported in the Supplementary material (Section S1).

FTIR spectra were obtained using a Tensor 27 spectrometer (Bruker Optik GmbH, Germany) within the 4,000–400 cm−1 range to examine the chemical composition and possible interactions between the polymer matrix and the OW fibres. Filament segments (neat PLA and PLA/OW 5–20 Wt.%) were analysed directly without any chemical preparation. Spectra were exported as absorbance values and automatically baseline-corrected, without smoothing. For visual comparison, the spectra displayed were vector-normalized to unit intensity.

The thermal behaviour of neat PLA and PLA/OW composites was studied using a DSC with a DSC 404 F3 Pegasus, equipped with a silver furnace (Netzsch-Gerätebau GmbH, Germany). About 5 mg of each sample was weighed and hermetically sealed in standard aluminium pans.

Each test involved a heating–cooling–heating cycle to reset the material’s thermal history and obtain consistent thermal parameters. The protocol was:

  • first heating from 25°C to 200°C at 10°C/min to relieve residual stresses and clear the processing history;

  • cooling to 25°C at 10°C/min under a nitrogen atmosphere; and

  • second heating from 25°C to 200°C at 10°C/min, during which the glass transition temperature Tg, melting temperature Tm and enthalpy of fusion ΔHm were measured.

The degree of crystallinity Xc was calculated using equation (1), where ΔHm is the measured enthalpy, ΔHm0 is the melting enthalpy of 100% crystalline PLA (93 J/g) and wf is the weight fraction of olive wood particles in the composite. In this work, Xc was calculated on the basis of the composite total mass (i.e. not normalized by the PLA fraction). This approach was used to allow a direct comparison between neat PLA and the PLA/OW composites. All measurements were repeated three times and the reported values represent the average ± standard deviation:

(1)

Thermal stability was evaluated using TGA with an SDT Q600 instrument (TA Instruments, USA). Approximately 15 mg of each sample was heated from 10°C to 600°C at a heating rate of 10°C/min under a nitrogen atmosphere.

The material behaviour was assessed by measuring rheological properties with a HAAKE Mars rotational rheometer (ThermoScientific Inc., USA) to examine flow behaviour during extrusion. The storage G′ and loss G″ moduli were recorded as frequency from 1 to 100 rad/s, using 1% strain, a 0.5 mm gap and a fixed test temperature. Based on the G′ and G″ data, the complex viscosity η* was calculated using equation (2), where ω is the angular frequency (rad/s):

(2)

The surfaces of the specimens were examined using a DCM8 confocal microscope (Leica GmbH, Germany), in accordance with ISO 25178 standards. The surfaces of neat PLA and composites with varying OW content were initially analysed to assess how filler content influences surface roughness. Discs with a diameter of 20 mm were printed using an X1C MEX printer (Bambu Lab, China) under identical processing conditions and representative flat regions were scanned to measure the areal parameters. These include the arithmetic mean height Sa, the root-mean-square height Sq and the maximum height Sz, as defined in ISO 25178. The printing parameters are summarized in Table 1. In the subsequent analysis, the effect of printing parameters was examined by adjusting the extrusion temperature (180–280°C) and printing speed (20–200 mm/s), while keeping the remaining settings constant. These parameters were selected because inter-filament bonding and bead coalescence in MEX are primarily thermally driven and strongly depend on nozzle temperature and deposition rate (Sun et al., 2008). The extrusion-temperature range (180–280°C) was selected based on processing considerations for MEX rather than on service temperatures of the final parts. The lower bound (180°C) was chosen as the minimum temperature that still ensured stable melting and deposition of the PLA-based filament, whereas the upper bound (280°C) was selected to explore the onset of thermally induced colour darkening (3D pyrography) while remaining below the initial degradation range identified by TGA. Therefore, the selected interval was intended to span the practical processing window of the PLA/OW system, from stable extrusion conditions to severe, but still printable, thermal exposure conditions. PLA-based specimens printed under these conditions were characterized using the confocal method to evaluate the relationship between process parameters and surface texture.

No separate heat-treatment stage was considered in this work. Thermal exposure occurred exclusively during MEX processing and was controlled by the combined effect of nozzle temperature and deposition rate. Therefore, at a given extrusion temperature, lower printing speed results in longer effective thermal exposure, while higher printing speed shortens the exposure time.

Images of printed surfaces were captured under controlled lighting to qualitatively evaluate homogeneity, colour tone and visible defects, such as cracks or filament raster marks. These observations helped determine the initial condition of the specimens and supported the subsequent interpretation of pyrography results.

Visible absorbance spectra in the 400–700 nm range were also obtained using a NIRSystems DS2500 spectrometer (FOSS, Denmark). The same discs were used for this measurement. From the absorbance data A(λ), the spectral reflectance R(λ) was calculated using equation (3), following the standard definition of absorbance in diffuse reflectance measurements:

(3)

Colour coordinates were calculated following the recommendations of the Commission Internationale de l’Éclairage (CIE) (ISO, 2019). Reflectance spectra were combined with the spectral power distribution of illuminant A (2856 K) and the colour-matching functions of the CIE 1931 2° standard observer to obtain the tristimulus values (X, Y, Z). The corresponding CIELAB coordinates (L*, a*, b*) were then computed using the CIE non-linear transformations. The complete calculation procedure and equations are provided in the Supplementary material (Section S2).

This procedure yielded the parameters L*, a* and b*, which provided an objective quantification of the colour variation of the samples as a function of processing conditions.

A multifactorial experimental design (DOE) was also used to evaluate how extrusion temperature T and printing speed V influence the colour parameters L*, a* and b* of the composites. Centurion software (Statgraphics Technologies Inc., USA) was used for statistical analysis. The DOE included three levels of extrusion temperature (180, 240 and 280°C) and two levels of printing speed (20 and 200 mm/s), resulting in a 3×2 factorial design. For each combination of extrusion temperature and printing speed, 3 independently printed specimens were analysed and the colour coordinates used in the ANOVA corresponded to the average values obtained from these replicate measurements. The residual error term in the ANOVA was estimated from the variability among these independent replicates. This analysis focused on the PLA/OW05 formulation as a representative system to identify general trends in colour variation based on processing parameters. Similar patterns were seen with higher filler loadings, confirming that PLA/OW05 is a suitable baseline for the statistical analysis.

The experimental results were analysed using ANOVA to determine the significance of the main factors (T and V) and their interactions (T·T and T·V). In addition, polynomial regression models were developed to predict L*, a* and b* as a function of the input variables. The models followed the standard second-order polynomial form commonly used in response surface methodology, as shown in equation (4), where Yr^ was the estimated response, Xr were input variables, ci, cii and cij were the coefficients of the linear, quadratic and interaction terms, respectively, and c0 was the intercept (Montgomery, 2004):

(4)

Colour differences between samples and their reference condition (180°C, 20 mm/s for each material) were quantified using the CIEDE2000 ΔE00 formula (Sharma et al., 2005). This approach, recommended by the CIE (ISO, 2019), accounts for perceptual non-uniformities in the CIELAB space by introducing corrections for lightness, chroma and hue. The total colour difference ΔE00 was computed from the CIELAB coordinates of each sample and its reference using equation (5), where ΔL′, ΔC′ and ΔH′, were the differences in lightness, chroma and hue between the sample and the reference SL, SC and SH were weighting functions that normalized these components, RT was a rotation term accounting for the interaction between chroma and hue differences and kL = kC = kH = 1 under reference conditions:

(5)

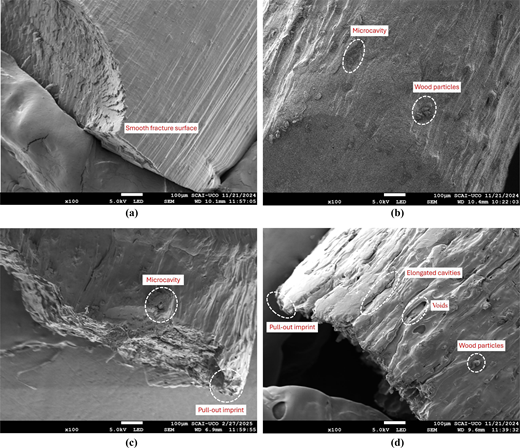
Figure 2 presents SEM micrographs of neat PLA and PLA/OW composites. To facilitate interpretation, the representative fracture-surface features identified in Figure 2 have been marked directly on the SEM micrographs, including cavities/voids, pull-out traces and heterogeneous regions associated with matrix–particle debonding. Neat PLA exhibited a relatively smooth fracture surface with no large cavities (>10 µm), indicating a uniform matrix. With increasing OW content, the fracture surfaces became progressively more heterogeneous, with a higher density of cavities and pull-out traces consistent with particle debonding and limited interfacial adhesion. Defect size and irregularity increased from microcavities typically below 20 µm at 5 Wt.% OW to elongated cavities and pull-out imprints in the 30–50 µm range at 10 Wt.% OW and to defects exceeding 50 µm at 20 Wt.% OW. Overall, OW addition promoted a gradual transition from a continuous fracture surface to a rougher morphology dominated by voids and interfacial heterogeneities, which is consistent with the observed reduction in mechanical integrity at higher filler contents.

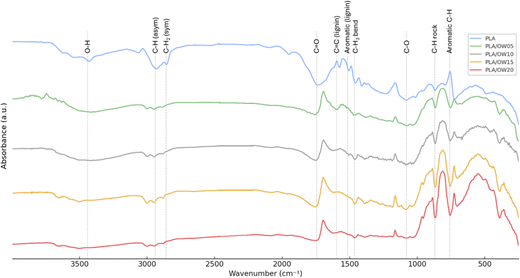
Figure 3 shows the FTIR spectra of pure PLA and PLA/OW composites, with the main absorption bands listed in Table 2. The spectrum of pure PLA exhibits characteristic bands of the polyester matrix, including the strong carbonyl stretching at 1,745 cm−1, the asymmetric and symmetric C–H stretching bands at 2,940 cm−1 and 2,860 cm−1, respectively, and the C–O–C stretching vibration at 1,080 cm−1. The band at 1,465 cm−1 corresponds to the bending of –CH3 groups, while signals at 870 cm−1 are related to crystalline domains of PLA.

In the composites, new absorption features appeared, attributed to the addition of OW particles. Notably, the broad band at 3,440 cm−1 grew stronger as the filler amount increased, indicating the O–H stretching vibrations of hydroxyl groups found in cellulose, hemicellulose and lignin. In addition, two distinct bands at 1,558 cm−1 and 1,515 cm−1 emerged, representing the aromatic skeletal vibrations of lignin, which were absent in pure PLA. The increased intensity of these lignin-related peaks with higher OW loadings confirmed the successful integration of lignocellulosic components.

The gradual increase in the intensity of the hydroxyl (O–H) and aromatic (C = C) bands with filler content clearly indicated the presence of wood particles within the PLA matrix. Conversely, the intensity of the carbonyl peak at 1,745 cm−1 slightly diminished in the composites compared to neat PLA, suggesting that the PLA ester groups were partially masked by the wood particles and their hydroxyl-rich surface.

These results aligned with previous studies on PLA/OW composites (Fico et al., 2022; Taktak et al., 2023, 2024), which also showed the preservation of PLA’s main absorptions along with intensified O–H and aromatic bands from lignocellulosic components, confirming the successful incorporation of OW particles into the polymer matrix.

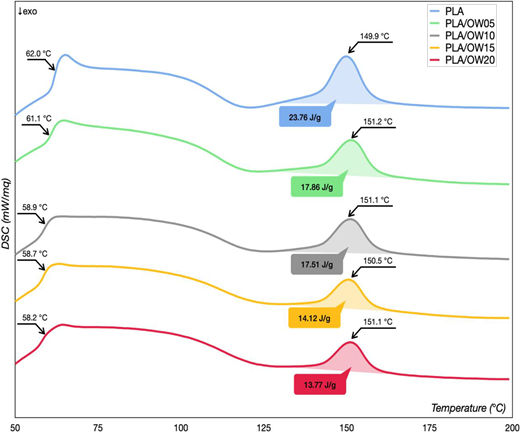
Figure 4 shows the DSC thermograms of neat PLA and PLA/OW composites. The thermal parameters, including Tg, Tm, ΔHm and Xc, are summarized in Table 3.

The glass transition temperature Tg of neat PLA was measured at 62.0°C, while the composites showed progressively lower Tg values with increasing OW content, reaching 58.2°C in PLA/OW20. These decreases indicated that adding OW particles reduced the mobility restrictions on PLA chains, possibly by creating interfacial free volume and partially disrupting chain–chain interactions. The reduction in Tg with filler addition has been reported in other PLA-based composites containing lignocellulosic fibres. It has been attributed to local heterogeneities at the interface between hydrophilic fillers and the hydrophobic PLA matrix (Kariz et al., 2018; Tao et al., 2017).

The melting temperature Tm remained nearly constant (149.9–151.2°C), indicating that OW did not markedly alter the lamellar thickness of PLA crystals. In contrast, the enthalpy of fusion decreased with OW loading and Xc dropped from 25.5% (neat PLA) to 14.8% (PLA/OW20), indicating that the presence of OW hindered crystal growth and reduced crystalline perfection. This behaviour can be attributed to the increasing interfacial heterogeneity introduced by the lignocellulosic particles, which disrupts the regular packing of PLA chains and limits their rearrangement into ordered crystalline domains during solidification. In addition, the higher melt viscoelasticity observed for the composites may further restrict the reorganization of PLA chains required for crystallization. Overall, OW addition decreased Tg and crystallinity while preserving Tm, consistent with increased interfacial heterogeneity in PLA/OW systems (Kariz et al., 2018; Tao et al., 2017).

Therefore, the DSC results confirmed that increasing OW content modified the thermal behaviour of PLA mainly by reducing Tg and crystallinity, while leaving Tm almost unchanged. These findings highlight the influence of filler–matrix interactions on the structural organization of the polymer and indicate that high OW levels hinder the development of ordered crystalline regions in the PLA matrix.

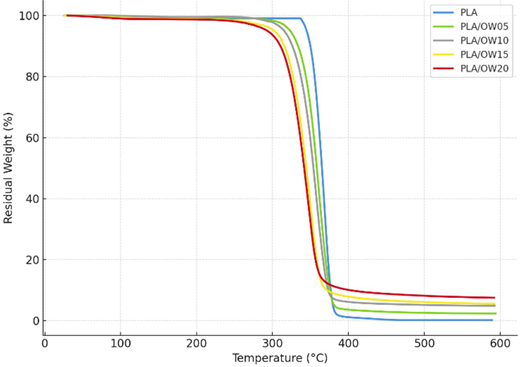
Figure 5 shows the TGA curves of neat PLA and PLA/OW composites. At the same time, Table 4 summarizes the main thermal degradation parameters, namely, the temperature at which the material has lost 5% of its mass (T5%), the maximum degradation temperature (Tmax, corresponding to the temperature at which the maximum rate of thermal degradation occurs) and the final residual weight (at 580°C).

Neat PLA showed single-step degradation with T5% = 344.9°C and Tmax = 375.9°C. Increasing OW content shifted both temperatures to lower values (T5% = 293.2°C and Tmax = 348.3°C for PLA/OW20), indicating reduced thermal stability due to the earlier decomposition of lignocellulosic components and the presence of thermally labile hydroxyl groups (Kariz et al., 2018; Tao et al., 2017). Conversely, the residue at 580°C increased from 0.2% (PLA) to 7.5% (PLA/OW20), consistent with char formation from the lignin-rich fraction (Zhou et al., 2022).

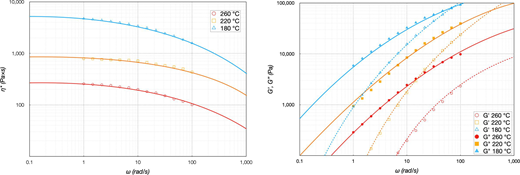
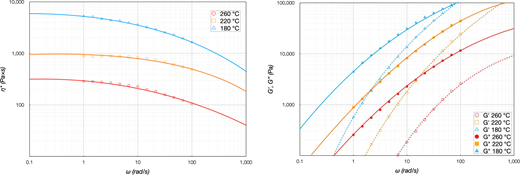
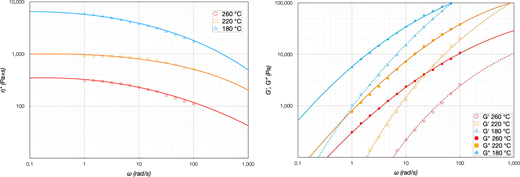
Figures 6–8 show the curves of G′, G″ and η* of the polymers with OW content ranging from 0% (neat PLA) to 10% as a function of shear rate ω. The data consisted of measured rheological data (scatters) and curves fitted using the Carreau–Yasuda model. The complex viscosity decreased with increasing shear rate for all materials, indicating typical pseudoplastic (shear-thinning) behaviour. Polymeric chains were arranged in a random or entangled configuration at low shear rates, resulting in high viscosity. Newtonian-like plateaus were observed at higher temperatures for η* across different OW contents, but they ended at lower frequencies. The subsequent decay with frequency was steeper, with a more solid-like behaviour at higher frequencies, due to less time for the polymer chain disentanglement. As the shear rate increased, the polymeric chains experienced greater deformation, leading to disentanglement and alignment in the flow direction while reducing viscosity.

As shown in Figure 68, the addition of OW increased G′, G″ and η* over the whole frequency range, with PLA/OW10 showing the highest viscoelastic response. This behaviour indicates that the lignocellulosic particles restricted the mobility and rearrangement of PLA chains in the melt, increasing flow resistance and promoting a more structured viscoelastic response. Similar trends have been reported for cellulose-reinforced PLA systems, in which filler incorporation increased storage modulus and complex viscosity while preserving shear-thinning behaviour (Awal et al., 2015). Comparable effects have also been observed in wood-filled PLA composites, where the presence of rigid lignocellulosic particles hindered melt flow and made the rheological response strongly dependent on filler–matrix interactions and dispersion quality (Yue et al., 2022).

In addition, the more pronounced low-frequency response observed with increasing OW content suggests the development of stronger filler–matrix interactions and possible transient particle networks or agglomerated structures within the melt. A similar interpretation has been proposed for PLA/cellulosic systems, where the upward deviation at low frequency has been associated with network formation and enhanced melt structuring (Cui et al., 2021). In the present case, this rheological behaviour was not detrimental to printability. On the contrary, the increase in viscoelasticity may contribute to better shape retention after deposition, although it also implies a narrower practical processing window as OW loading increases.

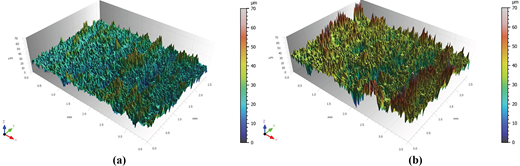
Figure 9 presents representative 3D topographies for PLA/OW05 and PLA/OW20 and Table 5 summarizes the superficial parameters Sa, Sq and Sz for all formulations. The characterization of the primary surface of the MEX specimens, evaluated according to ISO 25178, revealed a systematic increase in amplitude with increasing OW content. The visual comparison of the 3D topographies in Figure 9 corroborated this transition from a relatively homogeneous surface (PLA/OW05) towards a more irregular and heterogeneous landscape (PLA/OW20).

Neat PLA exhibited baseline values of Sa = 3.59 µm, Sq = 5.01 µm and Sz = 42.32 µm. From these values, the incorporation of OW led to a nearly monotonic increase in mean and quadratic roughness up to 15 Wt.%, with Sa = 3.76, 4.57 and 5.38 µm and Sq = 5.08, 6.05 and 7.41 µm for PLA/OW05, PLA/OW10 and PLA/OW15, respectively, corresponding to increases of 4.7–49.9% in Sa and 1.4–47.9% in Sq compared to PLA. Between 15 and 20 Wt.%, a slight plateau was observed (Sa = 5.39 µm; Sq = 7.52 µm), suggesting that, once a critical particle surface coverage was reached, further loading did not uniformly elevate the surface profile but instead resulted in localized irregularities.

Sz proved to be the most sensitive parameter to filler content, rising from 48.56 µm in PLA/OW05 to 76.40 µm in PLA/OW20, which represented an overall increase of 80.6% compared with PLA (42.32 µm). This pronounced growth in extreme peak-to-valley height indicated a higher frequency of sharp asperities and deep valleys with increasing OW content, consistent with the exposure of particles and agglomerates at the free surface, the formation of pull-out voids and the incomplete coalescence of filaments due to increased melt viscosity and reduced interdiffusion during deposition. The increase in roughness parameters with OW content was aligned with previous findings (Yang and Yeh, 2020), who reported that higher wood fibre loadings in PLA led to surfaces with more irregular features and fibre pull-outs, attributed to poor interfacial adhesion and increased viscosity during extrusion.

This evolution in surface roughness was consistent with SEM observations, in which cavities, pull-out traces and interfacial heterogeneities became more frequent at higher filler loadings. Therefore, the results confirmed that increasing OW content significantly increased the areal roughness of printed specimens.

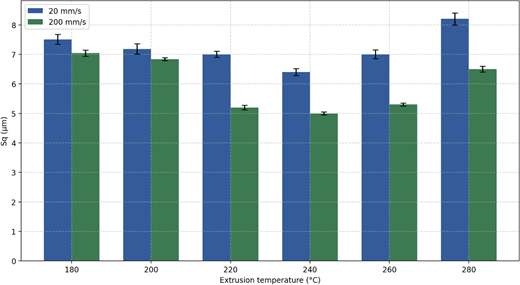
Figure 10 shows the variation of the root-mean-square height (Sq) as a function of extrusion temperature for two printing speeds (20 and 200 mm/s). At the lower speed (20 mm/s), Sq remained relatively high across the entire temperature range, ranging from 6.4 to 8.2 µm. A slight reduction was observed from 180°C (7.51 µm) to 240°C (6.40 µm), suggesting improved inter-filament diffusion and surface levelling at intermediate temperatures. However, further increasing the extrusion temperature to 280°C resulted in a pronounced rise in Sq (8.20 µm), indicating the onset of surface instability phenomena, such as polymer degradation or excessive flow irregularities, that counteracted the smoothing effect.

At the higher speed (200 mm/s), Sq values were consistently lower than at 20 mm/s, ranging from 5.0–7.02 µm. The lowest roughness was observed between 220 and 240°C (5.20 and 5.08 µm, respectively), indicating an optimal balance between melt fluidity and deposition rate that promoted bead coalescence and decreased asperity height. Beyond this optimum, Sq increased again, reaching 6.50 µm at 280°C, likely due to local instabilities at high flow rates and possible degradation of the polymer chains at elevated temperatures.

These results demonstrated that both extrusion temperature and speed exerted a coupled influence on the surface topography of MEX parts. Moderate extrusion temperatures (220–240°C) combined with high deposition speed (200 mm/s) minimized surface roughness, whereas very low or very high temperatures, particularly at low printing speeds, led to higher Sq values. This behaviour was consistent with the roles of temperature in controlling melt viscosity and chain mobility and with the role of speed in governing filament overlap and heat transfer during deposition.

The dependence of Sq on extrusion temperature and printing speed observed in this work was consistent with experimental and modelling studies on MEX. This behaviour also agrees with analytical and experimental roughness descriptions in fused deposition processes, where surface topography is governed by raster geometry and process settings (Boschetto et al., 2013). Previous works demonstrated that inadequate extrusion temperatures limited interfilament diffusion, leading to higher roughness, whereas excessively high thermal input induced surface instabilities (Jiang et al., 2022). Likewise, the trends identified in this study were consistent with another comprehensive review (Golhin et al., 2023), which emphasized that surface quality in MEX was governed by the coupled effects of extrusion temperature and speed. Too low a temperature or excessive printing speed prevented sufficient chain mobility and coalescence. In contrast, high thermal exposure at low speeds promoted sagging and degradation, thereby increasing roughness. In addition, recent studies on recycled PLA fabricated by MEX/FDM have highlighted that build-related parameters significantly affect superficial characteristics and surface-related performance (Altınsoy, 2025; Altınsoy et al., 2025).

3.6.1 Visual results

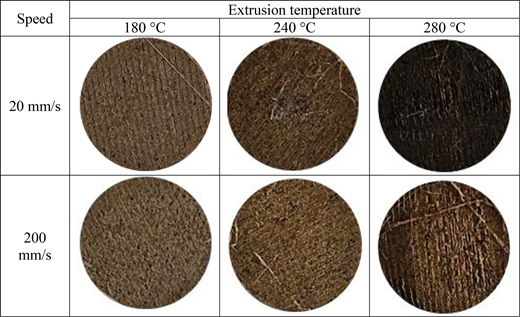
Figure 11 shows representative macrographs of the as-printed surfaces of PLA/OW20 produced at different extrusion temperatures (180–280°C) and printing speeds (20 and 200 mm/s). The complete set of surface images for all PLA/OW formulations is provided in the Supplementary material (Section S3).

At lower extrusion temperatures (180°C), the surfaces appeared lighter and the filament raster pattern was clearly visible, particularly at the higher printing speed (200 mm/s). Increasing the extrusion temperature to 240°C resulted in darker surfaces with a more visually uniform appearance, consistent with improved inter-bead coalescence and reduced visibility of deposition boundaries. However, further increasing the extrusion temperature to 280°C led to over-darkening and, in some cases, surface irregularities and cracks, indicating local thermal instability of the composite under high thermal loads. It should be noted that the extrusion temperature of 280°C is relatively close to the T5% value measured for the highest-loaded formulation, particularly PLA/OW20. Therefore, especially at low printing speed, this condition should be considered the absolute upper bound of the practical processing window for PLA/OW15 and PLA/OW20, as the longer effective thermal exposure may promote local thermal instability, surface cracking and irregularities.

Printing speed also played a key role. At 20 mm/s, surfaces were generally darker and visually more homogeneous due to the longer effective thermal exposure during deposition, whereas at 200 mm/s the reduced thermal exposure helped preserve lighter tones. These visual trends are consistent with the surface roughness results (Table 5 and Figure 10) and with the reduced thermal stability observed in TGA (Figure 5), confirming that the initial surface condition depends on both processing parameters and composite composition.

Visual inspection of the as-printed surfaces (Figure 11 and Supplementary material – Section S3) indicates that, for a given processing condition, the colour distribution on the exposed surface is generally macroscopically homogeneous, with the main tonal differences occurring between different extrusion-temperature/printing-speed combinations rather than between adjacent deposited layers. Under the most severe conditions, some local visual heterogeneity may appear, likely associated with increased thermal exposure and surface roughness.

3.6.2 Spectral analysis

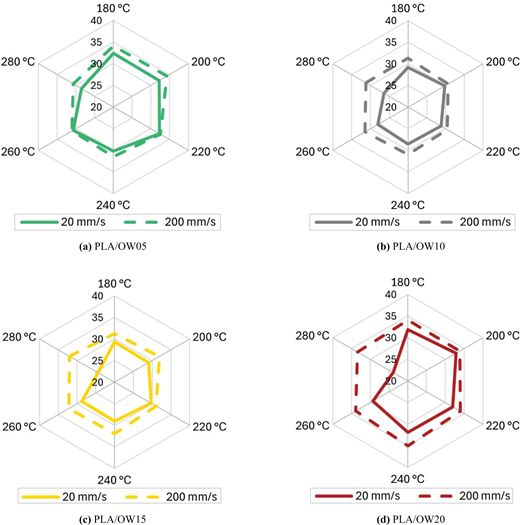
Figure 12 shows how the CIELAB lightness parameter L* changed with extrusion temperature for all PLA/OW composites at two printing speeds (20 and 200 mm/s). A clear dependence on both processing parameters and filler content was observed.

At low extrusion temperatures (180–200°C), specimens generally showed high lightness values (L* 29–34), indicating bright, uniform surfaces. Increasing the extrusion temperature to moderate levels (220–240°C) produced different trends depending on the OW loading. While PLA/OW05 and PLA/OW10 maintained moderate L* values (30–33), PLA/OW15 and PLA/OW20 exhibited an increase in lightness at 240°C, reaching values up to 35. This suggests improved surface uniformity and reduced scattering due to better filament coalescence.

However, at higher extrusion temperatures (260–280°C), a notable decrease in lightness was observed, especially for PLA/OW15 and PLA/OW20 at low speed, where L* fell to 24–25. This darkening was due to the thermal degradation of PLA and increased charring of the wood particles when exposed to high temperatures for extended periods, leading to darker surface tones.

Printing speed also had a significant impact. At high speed (200 mm/s), specimens consistently showed higher L* values compared to those printed at 20 mm/s, indicating that shorter residence time and reduced thermal input helped maintain brightness and prevent excessive darkening. Conversely, at lower speeds, the extended thermal exposure during deposition led to surface darkening, especially at the highest temperatures.

The decrease in L* observed at higher OW loadings and elevated extrusion temperatures aligned with previous research on PLA/wood composites, which indicated that increasing fibre content and extended thermal exposure darkened the printed surfaces (Taktak et al., 2024; Yang and Yeh, 2020).

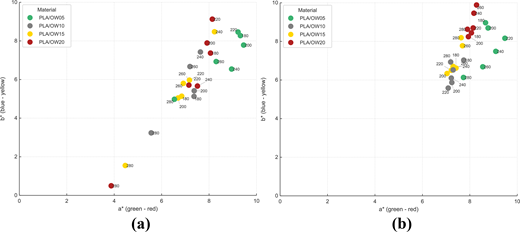
The chromatic parameters a* (green–red) and b* (blue–yellow) for the PLA/OW composites processed under different extrusion temperatures and printing speeds are shown in Figure 13. In general, a* values ranged between 6 and 9.5, indicating a shift towards reddish tones, while b* values (5–10) reflected a tendency towards yellowish hues. This behaviour was typical of lignocellulosic-based composites exposed to elevated temperatures, where partial degradation of hemicelluloses and lignin promoted the formation of chromophores.

At 280°C and low printing speed (20 mm/s), a significant dispersion of coordinates was observed, with some points showing reduced a* and b* values (down to 0.5), indicating darkening and loss of saturation due to local carbonization or advanced degradation, as noted in Figure 11. At 200 mm/s, these low-b* outliers disappeared and the a* and b* values remained within 6–10, indicating a reduction in severe thermal effects. Increasing OW content lifted b* values, confirming that the aromatic fractions of olive wood contribute to the final colour, with the highest b* (≥9) observed for PLA/OW20 at 200 mm/s and 240–260°C.

Although printing speed did not significantly change the mean chromatic coordinates, it affected their dispersion. At 200 mm/s, the data cloud was more compressed, indicating more uniform deposition and shorter thermal exposure. This finding matched the roughness data (Table 5), which showed that lower speeds increased surface irregularities, boosting localized light scattering and colour variability.

The ANOVA results for the colour parameters L*, a* and b* of PLA/OW05 composites are shown in Table 6. These results demonstrate that both extrusion temperature T and printing speed V have statistically significant impacts, with almost all p-values less than 0.001.

For the lightness L*, extrusion temperature T was the most influential factor, with a sum of squares SS of 30.43 and an F value of 17,848.5, while speed V also had a significant effect (SS = 8.90, F = 5,218). Quadratic effects of temperature T·T and the interaction term T·V were also significant, indicating non-linear trends and combined effects of processing parameters on brightness. The adjusted R2 value of 99.99% confirms that the model explains nearly all the variability in L*.

For the red–green coordinate a*, extrusion temperature T remained the primary factor (SS = 10.34, F = 1,210.5), followed by quadratic effects T·T (F = 605.9) and the interaction term T·V (F = 291.5). The influence of speed V alone was relatively minor (F = 14.4), though still statistically significant (p value = 0.003). The adjusted R2 of 99.27% indicated the model’s robustness.

For the yellow–blue coordinate b*, the extrusion temperature T had the most significant impact on variability (SS = 28.19, F = 396,942), with speed V also playing a notable role (SS = 3.73, F = 52,543). Both quadratic T·T and interactive T·V terms were significant, indicating that the evolution of b* followed a nonlinear relationship with the processing parameters. The model achieved an adjusted R2 of 99.99%, demonstrating excellent predictive accuracy.

The analysis confirms that extrusion temperature is the primary determinant of colour coordinates in PLA/OW05, followed by printing speed and their interaction. The high adjusted R2 values highlight the strong correlation between processing conditions and chromatic response, consistent with the thermal degradation and surface phenomena previously identified.

Polynomial regression models were fitted to predict the colour coordinates (L, a*, b*) as a function of extrusion parameters. Extrusion temperature (T) was the most influential predictor, followed by printing speed (V) and their interaction. The full set of estimated regression coefficients is provided in the Supplementary material (Section S4). The resulting empirical models should be interpreted within the tested processing window rather than as universally generalizable relationships.

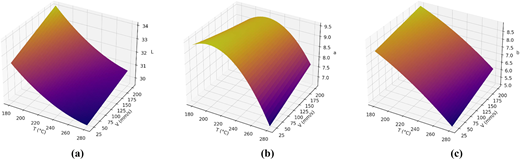
The response surface plots in Figure 14 illustrate the combined influence of extrusion temperature T and printing speed V on the CIELAB colour parameters of PLA/OW05 specimens. For L*, a monotonic decrease was observed with increasing temperature, where values dropped from above 34 at 180°C to around 30 at 280°C. This behaviour indicated darkening of the material surface due to enhanced thermal degradation and local carbonization at elevated temperatures.

For a* (green–red), the model indicated a non-linear trend, with peak values observed approximately between 220 and 240°C, subsequently declining at elevated temperatures. This finding suggests that moderate temperatures facilitate the development of reddish hues. Conversely, excessive heating causes a shift towards lower a* values, consistent with pigment decomposition and the thermal degradation of lignocellulosic components.

For b* (blue–yellow), a gradual decrease with rising temperature was observed, indicating a reduction in yellow tones. This was especially clear at higher printing speeds, where b* values dropped from about 8.5 at 180°C to below 6.0 at 280°C. These trends suggest the progressive breakdown of chromophoric structures within the OW filler, which lowers the yellowish look of the composites.

The response surface analysis confirms that extrusion temperature is the primary factor influencing colour change, while printing speed is a secondary but important variable that affects the degree of thermal degradation and colour variation.

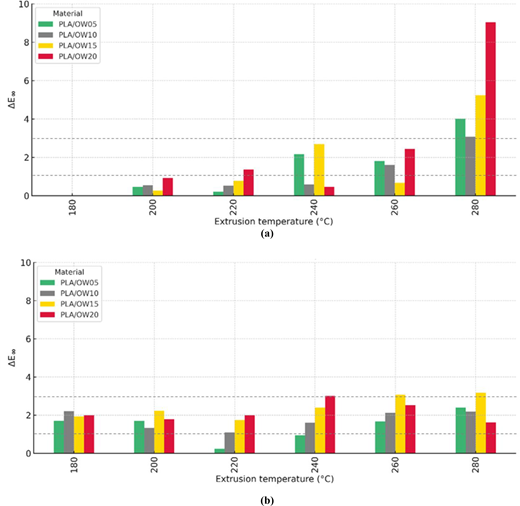
The colour difference parameter (ΔE00), calculated using the CIEDE2000 formula, is shown in Figure 15 for PLA/OW composites printed at two speeds (20 and 200 mm/s) across the extrusion temperature range of 180–280°C. The reference values were taken at 180°C and 20 mm/s.

At the lower printing speed of 20 mm/s, ΔE00 values showed a clear dependence on temperature and filler content. For all composites, colour differences stayed below 2 at 200–220°C, indicating minor perceptual variations compared to the reference condition. However, above 240°C, ΔE00 increased steadily, reaching values over 9 at 280°C for PLA/OW20. These high values reflected substantial, visually noticeable changes caused by enhanced thermal degradation of lignocellulosic components, carbonization effects and the resulting darkening of the specimens.

In contrast, at the higher printing speed (200 mm/s), ΔE00 values remained more consistent across the entire temperature range, with most results below 3. This suggested that faster deposition reduced the extent of thermally induced colour change, likely because the material was subjected to lower effective thermal exposure during processing. This behaviour was also consistent with the lower surface roughness measured at higher printing speed, which favoured a more uniform optical response. Overall, the results suggested a qualitative relationship between OW content, surface roughness and colour response. Increasing OW loading promoted a rougher and more heterogeneous surface, while also enhancing the tendency of the material to develop darker tones under elevated thermal exposure. In addition, rougher surfaces may increase local light scattering, thereby contributing to the dispersion of the colour coordinates and the perceptibility of colour differences. These results were also consistent with those obtained in Figures 1214.

3.6.3 Artifacts of 3D pyrography

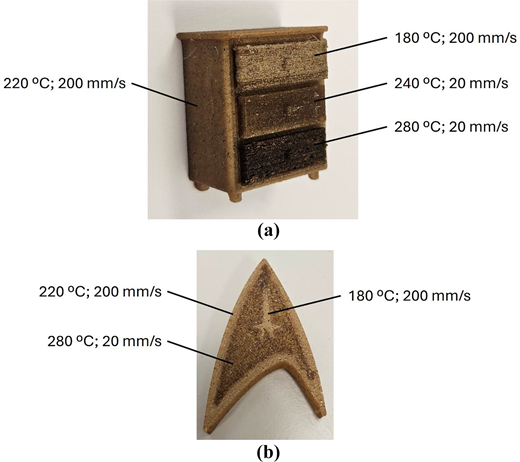
Figure 16 shows two proof-of-concept artifacts printed with PLA/OW composites to demonstrate the feasibility of process-controlled 3D pyrography. Noticeable tonal variations were achieved by adjusting extrusion temperature and printing speed, where higher temperatures and lower speeds promoted darker shades due to increased thermal exposure during deposition. Conversely, higher printing speeds helped preserve lighter tones by reducing the effective heating time. These visual outcomes are consistent with the quantified colour trends reported in CIELAB coordinates and ΔE00 (Figure 1215) and extend recent demonstrations of parameter-driven colour shading in wood filaments to PLA/olive-wood composites with controlled filler content (Moon et al., 2024). In the present case, the visual response was not only reflected in colour changes, but was also linked to surface roughness and processing conditions.

From a practical manufacturing perspective, this approach enables appearance tuning using a single biofilled filament without requiring pigment changes or multi-material switching. As a result, it can potentially reduce the need for multiple coloured filaments, filament changeovers and purge-related waste, while maintaining the intrinsic wood-like aesthetics of PLA/OW materials. This process-driven aesthetic control may be particularly attractive for design-oriented applications in which a wood-like appearance and tonal customization are desirable, such as decorative objects, interior-design elements, architectural mock-ups, customized consumer-product housings, signage and personalized small-series products. In these sectors, the possibility of generating different shades directly during printing using a single biofilled filament may reduce reliance on pigments, post-processing and multi-material switching, while preserving the natural visual character of PLA/OW materials. For practical implementation, the selection of printing conditions should remain within a stable processing window to avoid local overheating, surface cracking or material degradation, particularly at high temperatures and low speeds.

This study analyses the process–appearance relationship of 3D pyrography in PLA/olive-wood composites manufactured by MEX. PLA/OW filaments containing 0–20 Wt.% OW were produced and characterized to assess the relationship between printing conditions, surface texture and CIELAB colour response within the tested processing window.

Morphological and chemical analyses confirmed the incorporation of OW particles into the PLA matrix, together with increasing fracture-surface heterogeneity and characteristic FTIR bands associated with hydroxyl and aromatic lignin groups. Thermal analysis showed that increasing OW content slightly reduced the glass transition temperature and crystallinity of PLA, while decreasing the degradation temperatures and increasing char residue. Rheological analysis revealed higher complex viscosity and storage modulus with OW addition, indicating more restricted melt flow and a narrower practical processing window at higher filler contents.

Surface characterization showed that roughness increased with OW content and was affected by extrusion temperature and printing speed. Within the evaluated range, smoother surfaces were obtained around 220–240°C and 200 mm/s, whereas low printing speed and more severe thermal conditions led to higher Sq values. Colour analysis showed that increasing temperature caused progressive surface darkening (lower L*), while higher printing speed reduced this effect by decreasing thermal exposure during deposition. Statistical analysis confirmed strong empirical relationships between processing conditions and colour response within the tested window.

Finally, the proof-of-concept artefacts showed that tonal contrast can be generated directly during printing using a single PLA/OW filament, without post-processing. Overall, the results indicate that 3D pyrography in PLA/OW composites can be controlled through processing parameters and may be useful for applications in which wood-like appearance and surface customization are relevant, particularly in decorative, architectural and product-design contexts.

Altınsoy
,
Ş.
(
2025
), “
Effect of print orientation and recycling on the mechanical and tribological properties of 3D-printed PLA polymer materials
”,
Journal of Mechanical Science and Technology
, Vol.
39
No.
10
, pp.
5897
-
5912
, doi: .
Altınsoy
,
M.
,
Demirel
,
M.
and
Beköz Üllen
,
N.Ş.
(
2025
), “
Effect of the build orientations on mechanical, superficial and bioactivity properties of additively manufactured PLA and recycled PLA filaments
”,
Journal of Polymer Research
, Vol.
32
No.
11
, p.
597
, doi: .
Awal
,
A.
,
Rana
,
M.
and
Sain
,
M.
(
2015
), “
Thermorheological and mechanical properties of cellulose reinforced PLA bio-composites
”,
Mechanics of Materials
, Vol.
80
, pp.
87
-
95
, doi: .
Bharat
,
N.
,
Kumar
,
V.
,
Veeman
,
D.
and
Vellaisamy
,
M.
(
2025
), “
Enhancing mechanical properties of 3D-printed PLA/wood composites: a metaheuristic and statistical perspective
”,
European Journal of Wood and Wood Products
, Vol.
83
No.
3
, pp.
809
-
826
, doi: .
Boschetto
,
A.
,
Giordano
,
V.
and
Veniali
,
F.
(
2013
), “
3D roughness profile model in fused deposition modelling
”,
Rapid Prototyping Journal
, Vol.
19
No.
4
, pp.
240
-
252
, doi: .
Comino
,
F.
,
Martinez-Sánchez
,
J.A.
,
Romero
,
P.E.
,
Gurrado
,
N.
and
Spina
,
R.
(
2025
), “
thermo-mechanical properties of polylactic acid/olive wood composite for additive manufacturing
”,
Materials Research Proceedings
, Vol.
54
,
Association of American Publishers
, pp.
2344
-
2351
, .
Comino
,
F.
,
Romero
,
P.E.
,
Molero
,
E.
and
Ruiz de Adana
,
M.
(
2023
), “
Experimental evaluation of a 3D printed air dehumidification system developed with green desiccant materials
”,
Applied Thermal Engineering
, Vol.
227
, p.
120393
, doi: .
Cui
,
L.
,
Yi
,
L.
,
Wang
,
Y.
,
Zhang
,
Y.
,
Polyák
,
P.
,
Sui
,
X.
and
Pukánszky
,
B.
(
2021
), “
Rheology of PLA/regenerated cellulose nanocomposites prepared by the pickering emulsion process: network formation and modeling
”,
Materials & Design
, Vol.
206
, p.
109774
, doi: .
dos Santos
,
N.V.
,
Cavalcanti
,
D.K.K.
,
Neto
,
J.S.S.
,
de Queiroz
,
H.F.M.
,
Banea
,
M.D.
and
Cardoso
,
D.C.T.
(
2025
), “
Analysis of voids, interfacial and thermal properties of additively manufactured continuous natural fiber-reinforced biocomposites
”,
Progress in Additive Manufacturing
, Vol.
10
No.
8
, pp.
5401
-
5422
, doi: .
Ehman
,
N.
,
Ponce de León
,
A.
,
Quintero Torres
,
IN.
,
Vallejos
,
M.E.
and
Area
,
M.C.
(
2025
), “
Lignocellulosic agro-forest byproducts as feedstock for fused deposition modeling 3D printing filaments: a review
”,
Fibers
, Vol.
13
No.
9
, p.
124
, doi: .
Fico
,
D.
,
Rizzo
,
D.
,
De Carolis
,
V.
,
Montagna
,
F.
,
Palumbo
,
E.
and
Corcione
,
C.E.
(
2022
), “
Development and characterization of sustainable PLA/olive wood waste composites for rehabilitation applications using fused filament fabrication (FFF)
”,
Journal of Building Engineering
, Vol.
56
, p.
104673
, doi: .
Golhin
,
A.P.
,
Tonello
,
R.
,
Frisvad
,
J.R.
,
Grammatikos
,
S.
and
Strandlie
,
A.
(
2023
), “
Surface roughness of as-printed polymers: a comprehensive review
”,
The International Journal of Advanced Manufacturing Technology
, Vol.
127
Nos
3-4
, pp.
5511
-
5553
, doi: .
ISO
(
2019
), “ISO 11664-4:2019. Colorimetry – part 4: CIE 1976 L*a*b* colour space”,
International Organization for Standardization
,
Geneva
.
Jaróg
,
T.
,
Góra
,
M.
,
Góra
,
M.
,
Maroszek
,
M.
,
Hodor
,
K.
,
Hodor
,
K.
,
Hebda
,
M.
, et al. (
2025
), “
Biodegradable meets functional: dual-nozzle printing of eco-conscious parklets with wood-filled PLA
”,
Materials
, Vol.
18
No.
13
, p.
2951
, doi: .
Jasiński
,
W.
,
Szymanowski
,
K.
,
Nasiłowska
,
B.
,
Barlak
,
M.
,
Betlej
,
I.
,
Prokopiuk
,
A.
and
Borysiuk
,
P.
(
2025
), “
3D printing wood–PLA composites: the impact of wood particle size
”,
Polymers
, Vol.
17
No.
9
, p.
1165
, doi: .
Jiang
,
S.
,
Hu
,
K.
,
Zhan
,
Y.
,
Zhao
,
C.
and
Li
,
X.
(
2022
), “
Theoretical and experimental investigation on the 3D surface roughness of material extrusion additive manufacturing products
”,
Polymers
, Vol.
14
No.
2
, p.
293
, doi: .
Kariz
,
M.
,
Sernek
,
M.
,
Obućina
,
M.
and
Kuzman
,
M.K.
(
2018
), “
Effect of wood content in FDM filament on properties of 3D printed parts
”,
Materials Today Communications
, Vol.
14
, pp.
135
-
140
, doi: . Vol
Khan
,
I.
,
Amin
,
J.
,
Abas
,
M.
,
Babar
,
M.
,
Mikail Shah
,
S.
,
Ali
,
A.
,
Rasheed
,
A.
, et al. (
2025
), “
Extrusion additive manufacturing of particle-reinforced polymer composites: materials, processes, and applications
”,
Progress in Additive Manufacturing
, Vol.
10
No.
11
, pp.
6415
-
6453
, doi: .
Lee
,
C.H.
,
Padzil
,
F.N.B.M.
,
Lee
,
S.H.
,
Ainun
,
Z.M.A.
and
Abdullah
,
L.C.
(
2021
), “
Potential for natural fiber reinforcement in PLA polymer filaments for fused deposition modeling (FDM) additive manufacturing: a review
”,
Polymers
, Vol.
13
No.
9
, p.
1407
, doi: .
Le Guen
,
M.J.
,
Hill
,
S.
,
Smith
,
D.
,
Theobald
,
B.
,
Gaugler
,
E.
,
Barakat
,
A.
and
Mayer-Laigle
,
C.
(
2019
), “
Influence of rice husk and wood biomass properties on the manufacture of filaments for fused deposition modeling
”,
Frontiers in Chemistry
, Vol.
7
, p.
735
, doi: .
Liu
,
Z.
,
Lei
,
Q.
and
Xing
,
S.
(
2019
), “
Mechanical characteristics of wood, ceramic, metal and carbon fiber-based PLA composites fabricated by FDM
”,
Journal of Materials Research and Technology
, Vol.
8
No.
5
, pp.
3743
-
3753
, doi: .
Lo Giudice
,
V.
,
Faraone
,
I.
,
Bruno
,
M.R.
,
Ponticelli
,
M.
,
Labanca
,
F.
,
Bisaccia
,
D.
,
Massarelli
,
C.
, et al. (
2021
), “
Olive trees by-products as sources of bioactive and other industrially useful compounds: a systematic review
”,
Molecules
, Vol.
26
No.
16
, p.
5081
, doi: .
Martínez-Sánchez
,
J.A.
,
Comino
,
F.
,
Romero
,
P.E.
and
Ruiz de Adana
,
M.
(
2025
), “
Design, development and performance evaluation of a 3D-printed desiccant wheel using poly-lactic acid and wood filaments for sustainable HVAC systems
”,
Building and Environment
, Vol.
276
, p.
112889
, doi: .
Mirza
,
F.
,
Baloor Shenoy
,
S.
,
Nunna
,
S.
,
Ramanath Kini
,
C.
and
Creighton
,
C.
(
2025
), “
Effect of material extrusion process parameters on tensile performance of pristine and discontinuous fibre reinforced PLA composites: a review
”,
Progress in Additive Manufacturing
, Vol.
10
No.
5
, pp.
3251
-
3265
, doi: .
Montgomery
,
D.C.
(
2004
),
Design and Analysis of Experiments
, (6th Edition.) ,
Wiley
.
Moon
,
K.
,
Yi
,
J.
,
Savage
,
V.
and
Bianchi
,
A.
(
2024
), “
3D printed pyrography: using wood filament and dynamic control of nozzle temperature for embedding shades of color in objects
”,
Additive Manufacturing
, Vol.
83
, p.
104064
, doi: .
Petinakis
,
E.
,
Liu
,
X.
,
Yu
,
L.
,
Way
,
C.
,
Sangwan
,
P.
,
Dean
,
K.
,
Bateman
,
S.
, et al. (
2010
), “
Biodegradation and thermal decomposition of poly(lactic acid)-based materials reinforced by hydrophilic fillers
”,
Polymer Degradation and Stability
, Vol.
95
No.
9
, pp.
1704
-
1707
, doi: .
Sharma
,
G.
,
Wu
,
W.
and
Dalal
,
E.N.
(
2005
), “
The CIEDE2000 color-difference formula: implementation notes, supplementary test data, and mathematical observations
”,
Color Research & Application
, Vol.
30
No.
1
, pp.
21
-
30
, doi: .
Sheng
,
D.D.C.V.
,
Yahya
,
M.N.B.
,
Din
,
N.B.C.
,
Wong
,
K.Y.
,
Asyraf
,
M.R.M.
and
Sekar
,
V.
(
2024
), “
Potential of wood fiber/polylactic acid composite microperforated panel for sound absorption application in indoor environment
”,
Construction and Building Materials
, Vol.
444
, p.
137750
, doi: .
Spina
,
R.
(
2025
), “
Surface appearance of poly lactic acid due to variations in material extrusion processing parameters
”,
Scientific Reports
, Vol.
15
No.
1
, p.
22684
, doi: .
Sultana
,
J.
,
Rahman
,
M.M.
,
Wang
,
Y.
,
Ahmed
,
A.
and
Xiaohu
,
C.
(
2024
), “
Influences of 3D printing parameters on the mechanical properties of wood PLA filament: an experimental analysis by Taguchi method
”,
Progress in Additive Manufacturing
, Vol.
9
No.
4
, pp.
1151
-
1165
, doi: .
Sun
,
Q.
,
Rizvi
,
G.M.
,
Bellehumeur
,
C.T.
and
Gu
,
P.
(
2008
), “
Effect of processing conditions on the bonding quality of FDM polymer filaments
”,
Rapid Prototyping Journal
, Vol.
14
No.
2
, pp.
72
-
80
, doi: .
Taktak
,
I.
,
Mansouri
,
A.
,
Guerfali
,
M.
,
Ayadi
,
I.
,
Souissi
,
S.
,
Gargouri
,
A.
,
Etoh
,
M.A.
, et al. (
2024
), “
Active bio composites films based on PLA/olive wood flour (Olea europaea L.)/cinnamon essential oil
”,
Polymer Bulletin
, Vol.
81
No.
1
, pp.
719
-
737
, doi: .
Taktak
,
I.
,
Mansouri
,
A.
,
Souissi
,
S.
,
Etoh
,
M.A.
and
Elloumi
,
A.
(
2023
), “
Biocomposites films based on polylactic acid and olive wood-flour: investigation on physical, thermal and mechanical properties
”,
Journal of Elastomers & Plastics
, Vol.
55
No.
4
, pp.
597
-
612
, doi: .
Tao
,
Y.
,
Wang
,
H.
,
Li
,
Z.
,
Li
,
P.
and
Shi
,
S.Q.
(
2017
), “
Development and application of wood flour-filled polylactic acid composite filament for 3d printing
”,
Materials
, Vol.
10
No.
4
, p.
339
, doi: .
TotalEnergies Corbion
(
2022
), “
Luminy® LX175: technical data sheet
”,
available at:
Link to Luminy® LX175: technical data sheetLink to the pdf of the cited article., (
accessed
22 July 2022)
Travieso-Rodriguez
,
J.A.
,
Jerez-Mesa
,
R.
,
Llumà
,
J.
,
Gomez-Gras
,
G.
and
Casadesus
,
O.
(
2021
), “
Comparative study of the flexural properties of ABS, PLA and a PLA–wood composite manufactured through fused filament fabrication
”,
Rapid Prototyping Journal
, Vol.
27
No.
1
, pp.
81
-
92
, doi: .
Turner
,
B.N.
,
Strong
,
R.
and
Gold
,
S.A.
(
2014
), “
A review of melt extrusion additive manufacturing processes: I. Process design and modeling
”,
Rapid Prototyping Journal
, Vol.
20
No.
3
, pp.
192
-
204
, doi: .
Yang
,
T.C.
and
Yeh
,
C.H.
(
2020
), “
Morphology and mechanical properties of 3D printed wood fiber/polylactic acid composite parts using fused deposition modeling (FDM): the effects of printing speed
”,
Polymers
, Vol.
12
No.
6
, p.
1334
, doi: .
Yue
,
Z.
,
Wang
,
H.
,
Zhang
,
M.
and
Wang
,
M.
(
2022
), “
Mechanical, thermal and rheological properties of polylactic acid (PLA)/epichlorohydrin modified pine wood flour (EWF) composites
”,
European Journal of Wood and Wood Products
, Vol.
80
No.
5
, pp.
1111
-
1120
, doi: .
Zhou
,
J.
,
Wang
,
B.
,
Xu
,
C.
,
Xu
,
Y.Z.
,
Tan
,
H.
,
Zhang
,
X.
and
Zhang
,
Y.
(
2022
), “
Performance of composite materials by wood fiber/polydopamine/silver modified PLA and the antibacterial property
”,
Journal of Materials Research and Technology
, Vol.
18
, pp.
428
-
438
, doi: .

The supplementary material for this article can be found online.
Published by Emerald Publishing Limited. This article is published under the Creative Commons Attribution (CC BY 4.0) licence. Anyone may reproduce, distribute, translate and create derivative works of this article (for both commercial and non-commercial purposes), subject to full attribution to the original publication and authors. The full terms of this licence maybe seen at Link to the terms of the CC BY 4.0 licenceLink to the terms of the CC BY 4.0 licence.

Supplementary data

Data & Figures

Figure 1
A two-panel comparison presents printed cabinet and angled specimens with labelled extrusion temperatures and speeds of 20 or 200 millimetres per second.The two panels present fabricated specimens with labelled extrusion conditions. Panel A contains a small cabinet-like object with 3 front sections and a side panel. The side panel is labelled 220 degrees Celsius and 200 millimetres per second. The upper front section is labelled 180 degrees Celsius and 200 millimetres per second. The middle front section is labelled 240 degrees Celsius and 20 millimetres per second. The lower front section is labelled 280 degrees Celsius and 20 millimetres per second. Panel B contains an angular specimen with a pointed upper end and an open V-shaped lower section. One upper region is labelled 220 degrees Celsius and 200 millimetres per second. The opposite upper region is labelled 180 degrees Celsius and 200 millimetres per second. The lower region is labelled 280 degrees Celsius and 20 millimetres per second.

Olive wood particles from pruning

Source: Authors’ own work

Figure 1
A two-panel comparison presents printed cabinet and angled specimens with labelled extrusion temperatures and speeds of 20 or 200 millimetres per second.The two panels present fabricated specimens with labelled extrusion conditions. Panel A contains a small cabinet-like object with 3 front sections and a side panel. The side panel is labelled 220 degrees Celsius and 200 millimetres per second. The upper front section is labelled 180 degrees Celsius and 200 millimetres per second. The middle front section is labelled 240 degrees Celsius and 20 millimetres per second. The lower front section is labelled 280 degrees Celsius and 20 millimetres per second. Panel B contains an angular specimen with a pointed upper end and an open V-shaped lower section. One upper region is labelled 220 degrees Celsius and 200 millimetres per second. The opposite upper region is labelled 180 degrees Celsius and 200 millimetres per second. The lower region is labelled 280 degrees Celsius and 20 millimetres per second.

Olive wood particles from pruning

Source: Authors’ own work

Close modal
Figure 2

SEM images of (a) neat PLA, (b) PLA/OW05, (c) PLA/OW10 and (d) PLA/OW20. The marked regions indicate representative morphological features observed in the fracture surfaces, including cavities/voids, pull-out traces and heterogeneous areas associated with increasing OW content

Source: Authors’ own work

Figure 2

SEM images of (a) neat PLA, (b) PLA/OW05, (c) PLA/OW10 and (d) PLA/OW20. The marked regions indicate representative morphological features observed in the fracture surfaces, including cavities/voids, pull-out traces and heterogeneous areas associated with increasing OW content

Source: Authors’ own work

Close modal
Figure 3
A five-spectrum comparison plots absorbance against wavenumber for P L A and P L A slash O W composites, with several labelled chemical bond regions.The plot compares 5 absorbance spectra labelled P L A, P L A slash O W 05, P L A slash O W 10, P L A slash O W 15 and P L A slash O W 20. The horizontal axis is Wavenumber in inverse centimetres, decreasing from about 4,000 to 300 inverse centimetres. The vertical axis is Absorbance in arbitrary units. Vertical reference lines identify O H near 3,400 inverse centimetres, asymmetric C H near 2,900 inverse centimetres, symmetric C H 2 near 2,800 inverse centimetres, C double bond O near 1,750 inverse centimetres, C double bond C from lignin near 1,600 inverse centimetres, aromatic lignin near 1,500 inverse centimetres, C H 2 bend near 1,450 inverse centimetres, C O near 1,100 inverse centimetres, C H rock near 850 inverse centimetres and aromatic C H near 730 inverse centimetres. The 5 spectra remain separated vertically across the range and display multiple peaks and troughs around the labelled bond regions.

FTIR spectra of PLA and PLA/OW composites

Source: Authors’ own work

Figure 3
A five-spectrum comparison plots absorbance against wavenumber for P L A and P L A slash O W composites, with several labelled chemical bond regions.The plot compares 5 absorbance spectra labelled P L A, P L A slash O W 05, P L A slash O W 10, P L A slash O W 15 and P L A slash O W 20. The horizontal axis is Wavenumber in inverse centimetres, decreasing from about 4,000 to 300 inverse centimetres. The vertical axis is Absorbance in arbitrary units. Vertical reference lines identify O H near 3,400 inverse centimetres, asymmetric C H near 2,900 inverse centimetres, symmetric C H 2 near 2,800 inverse centimetres, C double bond O near 1,750 inverse centimetres, C double bond C from lignin near 1,600 inverse centimetres, aromatic lignin near 1,500 inverse centimetres, C H 2 bend near 1,450 inverse centimetres, C O near 1,100 inverse centimetres, C H rock near 850 inverse centimetres and aromatic C H near 730 inverse centimetres. The 5 spectra remain separated vertically across the range and display multiple peaks and troughs around the labelled bond regions.

FTIR spectra of PLA and PLA/OW composites

Source: Authors’ own work

Close modal
Figure 4
A D S C comparison presents five P L A and P L A slash O W materials, with transition temperatures near 58 to 62 degrees Celsius and peaks near 150 to 151 degrees Celsius.The plot compares D S C in milliwatts per milligram against Temperature in degrees Celsius from 50 to 200 for P L A, P L A slash O W 05, P L A slash O W 10, P L A slash O W 15 and P L A slash O W 20. An exothermic direction is indicated downward. P L A has a marked transition at 62.0 degrees Celsius and a peak at 149.9 degrees Celsius, with an associated value of 23.76 joules per gram. P L A slash O W 05 has a transition at 61.1 degrees Celsius and a peak at 151.2 degrees Celsius, with 17.86 joules per gram. P L A slash O W 10 has a transition at 58.9 degrees Celsius and a peak at 151.1 degrees Celsius, with 17.51 joules per gram. P L A slash O W 15 has a transition at 58.7 degrees Celsius and a peak at 150.5 degrees Celsius, with 14.12 joules per gram. P L A slash O W 20 has a transition at 58.2 degrees Celsius and a peak at 151.1 degrees Celsius, with 13.77 joules per gram.

DSC for PLA and PLA/OW composites

Source: Authors’ own work

Figure 4
A D S C comparison presents five P L A and P L A slash O W materials, with transition temperatures near 58 to 62 degrees Celsius and peaks near 150 to 151 degrees Celsius.The plot compares D S C in milliwatts per milligram against Temperature in degrees Celsius from 50 to 200 for P L A, P L A slash O W 05, P L A slash O W 10, P L A slash O W 15 and P L A slash O W 20. An exothermic direction is indicated downward. P L A has a marked transition at 62.0 degrees Celsius and a peak at 149.9 degrees Celsius, with an associated value of 23.76 joules per gram. P L A slash O W 05 has a transition at 61.1 degrees Celsius and a peak at 151.2 degrees Celsius, with 17.86 joules per gram. P L A slash O W 10 has a transition at 58.9 degrees Celsius and a peak at 151.1 degrees Celsius, with 17.51 joules per gram. P L A slash O W 15 has a transition at 58.7 degrees Celsius and a peak at 150.5 degrees Celsius, with 14.12 joules per gram. P L A slash O W 20 has a transition at 58.2 degrees Celsius and a peak at 151.1 degrees Celsius, with 13.77 joules per gram.

DSC for PLA and PLA/OW composites

Source: Authors’ own work

Close modal
Figure 5
A thermogravimetric plot compares residual weight against temperature for P L A and 4 P L A slash O W composites, with rapid mass loss near 330 to 380 degrees Celsius.The plot presents Residual Weight in per cent against Temperature in degrees Celsius for P L A, P L A slash O W 05, P L A slash O W 10, P L A slash O W 15 and P L A slash O W 20. Temperature extends from about 0 to 600 degrees Celsius, while residual weight ranges from 0 to 100 per cent. All 5 curves remain close to 100 per cent through the lower-temperature region and begin their principal decline at approximately 300 to 340 degrees Celsius. P L A undergoes the latest sharp decrease, falling rapidly between about 340 and 385 degrees Celsius and approaching 0 per cent residual weight near 400 degrees Celsius. P L A slash O W 05 decreases slightly earlier and retains about 2 to 3 per cent residual weight near 600 degrees Celsius. P L A slash O W 10 begins its major decline earlier and retains about 5 per cent residual weight near 600 degrees Celsius. P L A slash O W 15 also decreases earlier than P L A and retains about 6 per cent residual weight near 600 degrees Celsius. P L A slash O W 20 begins the main decline earliest and retains the greatest residual weight, approximately 8 per cent, near 600 degrees Celsius.

TGA for PLA and PLA/OW composites

Source: Authors’ own work

Figure 5
A thermogravimetric plot compares residual weight against temperature for P L A and 4 P L A slash O W composites, with rapid mass loss near 330 to 380 degrees Celsius.The plot presents Residual Weight in per cent against Temperature in degrees Celsius for P L A, P L A slash O W 05, P L A slash O W 10, P L A slash O W 15 and P L A slash O W 20. Temperature extends from about 0 to 600 degrees Celsius, while residual weight ranges from 0 to 100 per cent. All 5 curves remain close to 100 per cent through the lower-temperature region and begin their principal decline at approximately 300 to 340 degrees Celsius. P L A undergoes the latest sharp decrease, falling rapidly between about 340 and 385 degrees Celsius and approaching 0 per cent residual weight near 400 degrees Celsius. P L A slash O W 05 decreases slightly earlier and retains about 2 to 3 per cent residual weight near 600 degrees Celsius. P L A slash O W 10 begins its major decline earlier and retains about 5 per cent residual weight near 600 degrees Celsius. P L A slash O W 15 also decreases earlier than P L A and retains about 6 per cent residual weight near 600 degrees Celsius. P L A slash O W 20 begins the main decline earliest and retains the greatest residual weight, approximately 8 per cent, near 600 degrees Celsius.

TGA for PLA and PLA/OW composites

Source: Authors’ own work

Close modal
Figure 6
A two-panel rheology comparison presents complex viscosity and storage and loss moduli against angular frequency at 180, 220 and 260 degrees Celsius.The two panels use angular frequency, omega, in radians per second on logarithmic horizontal axes. The left panel plots complex viscosity, eta star, in pascal seconds from about 10 to 10,000. Curves are provided for 180, 220 and 260 degrees Celsius. Complex viscosity decreases as angular frequency increases at all 3 temperatures. The 180 degrees Celsius curve remains highest, the 220 degrees Celsius curve is intermediate, and the 260 degrees Celsius curve remains lowest. Around 1 radian per second, complex viscosity is approximately 4,500 pascal seconds at 180 degrees Celsius, 800 pascal seconds at 220 degrees Celsius and 260 pascal seconds at 260 degrees Celsius. By 1,000 radians per second, the corresponding values fall to about 400, 150 and 35 pascal seconds. The right panel plots storage modulus G prime and loss modulus G double prime in pascals from about 100 to 100,000 against angular frequency from 0.1 to 1,000 radians per second. Both moduli increase with angular frequency. At each temperature, G double prime is represented by solid markers and curves, while G prime uses open markers and dashed curves. The 180 degrees Celsius data have the highest modulus values, followed by 220 degrees Celsius and 260 degrees Celsius.

PLA viscosity η*, storage G′ and loss G″ moduli

Source: Authors’ own work

Figure 6
A two-panel rheology comparison presents complex viscosity and storage and loss moduli against angular frequency at 180, 220 and 260 degrees Celsius.The two panels use angular frequency, omega, in radians per second on logarithmic horizontal axes. The left panel plots complex viscosity, eta star, in pascal seconds from about 10 to 10,000. Curves are provided for 180, 220 and 260 degrees Celsius. Complex viscosity decreases as angular frequency increases at all 3 temperatures. The 180 degrees Celsius curve remains highest, the 220 degrees Celsius curve is intermediate, and the 260 degrees Celsius curve remains lowest. Around 1 radian per second, complex viscosity is approximately 4,500 pascal seconds at 180 degrees Celsius, 800 pascal seconds at 220 degrees Celsius and 260 pascal seconds at 260 degrees Celsius. By 1,000 radians per second, the corresponding values fall to about 400, 150 and 35 pascal seconds. The right panel plots storage modulus G prime and loss modulus G double prime in pascals from about 100 to 100,000 against angular frequency from 0.1 to 1,000 radians per second. Both moduli increase with angular frequency. At each temperature, G double prime is represented by solid markers and curves, while G prime uses open markers and dashed curves. The 180 degrees Celsius data have the highest modulus values, followed by 220 degrees Celsius and 260 degrees Celsius.

PLA viscosity η*, storage G′ and loss G″ moduli

Source: Authors’ own work

Close modal
Figure 7
A rheological frequency sweep compares temperature-dependent viscosity and viscoelastic moduli at 180, 220 and 260 degrees Celsius.The two panels use angular frequency, omega, in radians per second on logarithmic horizontal axes. The left panel plots complex viscosity, eta star, in pascal seconds from about 10 to 10,000. Curves are shown for 180, 220 and 260 degrees Celsius. Complex viscosity decreases as angular frequency increases at all 3 temperatures. The 180 degrees Celsius curve remains highest, the 220 degrees Celsius curve is intermediate, and the 260 degrees Celsius curve remains lowest. Near 1 radian per second, complex viscosity is about 5,000 pascal seconds at 180 degrees Celsius, about 900 pascal seconds at 220 degrees Celsius and about 280 pascal seconds at 260 degrees Celsius. Near 1,000 radians per second, the corresponding values are about 450, 180 and 40 pascal seconds. The right panel plots storage modulus G prime and loss modulus G double prime in pascals from about 100 to 100,000 against angular frequency from 0.1 to 1,000 radians per second. Both moduli increase with angular frequency. Open markers with dashed curves represent G prime, while filled markers with solid curves represent G double prime. At each temperature, the 180 degrees Celsius data reach the highest modulus values, followed by 220 degrees Celsius and 260 degrees Celsius.

PLA/OW05 viscosity η*, storage G′ and loss G″ moduli

Source: Authors’ own work

Figure 7
A rheological frequency sweep compares temperature-dependent viscosity and viscoelastic moduli at 180, 220 and 260 degrees Celsius.The two panels use angular frequency, omega, in radians per second on logarithmic horizontal axes. The left panel plots complex viscosity, eta star, in pascal seconds from about 10 to 10,000. Curves are shown for 180, 220 and 260 degrees Celsius. Complex viscosity decreases as angular frequency increases at all 3 temperatures. The 180 degrees Celsius curve remains highest, the 220 degrees Celsius curve is intermediate, and the 260 degrees Celsius curve remains lowest. Near 1 radian per second, complex viscosity is about 5,000 pascal seconds at 180 degrees Celsius, about 900 pascal seconds at 220 degrees Celsius and about 280 pascal seconds at 260 degrees Celsius. Near 1,000 radians per second, the corresponding values are about 450, 180 and 40 pascal seconds. The right panel plots storage modulus G prime and loss modulus G double prime in pascals from about 100 to 100,000 against angular frequency from 0.1 to 1,000 radians per second. Both moduli increase with angular frequency. Open markers with dashed curves represent G prime, while filled markers with solid curves represent G double prime. At each temperature, the 180 degrees Celsius data reach the highest modulus values, followed by 220 degrees Celsius and 260 degrees Celsius.

PLA/OW05 viscosity η*, storage G′ and loss G″ moduli

Source: Authors’ own work

Close modal
Figure 8
A frequency-sweep comparison traces temperature effects on complex viscosity and viscoelastic moduli, with data presented at 180, 220 and 260 degrees Celsius.The left panel plots complex viscosity, eta star, in pascal seconds against angular frequency, omega, in radians per second on logarithmic axes. The angular frequency ranges from 0.1 to 1,000 radians per second, and complex viscosity ranges from about 10 to 10,000 pascal seconds. Curves are presented for 180, 220 and 260 degrees Celsius. At each temperature, complex viscosity declines as angular frequency increases. The 180 degrees Celsius curve remains highest across the plotted range, followed by 220 degrees Celsius and 260 degrees Celsius. Near 1 radian per second, the values are approximately 5,800 pascal seconds at 180 degrees Celsius, 900 pascal seconds at 220 degrees Celsius and 300 pascal seconds at 260 degrees Celsius. Near 1,000 radians per second, they decrease to approximately 500, 200 and 40 pascal seconds, respectively. The right panel plots storage modulus G prime and loss modulus G double prime in pascals against angular frequency from 0.1 to 1,000 radians per second. Modulus values extend to about 100,000 pascals. Open markers with dashed curves represent G prime, while filled markers with solid curves represent G double prime. Both G prime and G double prime increase with angular frequency at all 3 temperatures. The 180 degrees Celsius series occupies the highest modulus range, the 220 degrees Celsius series is intermediate, and the 260 degrees Celsius series occupies the lowest range.

PLA/OW10 viscosity η*, storage G′ and loss G″ moduli

Source: Authors’ own work

Figure 8
A frequency-sweep comparison traces temperature effects on complex viscosity and viscoelastic moduli, with data presented at 180, 220 and 260 degrees Celsius.The left panel plots complex viscosity, eta star, in pascal seconds against angular frequency, omega, in radians per second on logarithmic axes. The angular frequency ranges from 0.1 to 1,000 radians per second, and complex viscosity ranges from about 10 to 10,000 pascal seconds. Curves are presented for 180, 220 and 260 degrees Celsius. At each temperature, complex viscosity declines as angular frequency increases. The 180 degrees Celsius curve remains highest across the plotted range, followed by 220 degrees Celsius and 260 degrees Celsius. Near 1 radian per second, the values are approximately 5,800 pascal seconds at 180 degrees Celsius, 900 pascal seconds at 220 degrees Celsius and 300 pascal seconds at 260 degrees Celsius. Near 1,000 radians per second, they decrease to approximately 500, 200 and 40 pascal seconds, respectively. The right panel plots storage modulus G prime and loss modulus G double prime in pascals against angular frequency from 0.1 to 1,000 radians per second. Modulus values extend to about 100,000 pascals. Open markers with dashed curves represent G prime, while filled markers with solid curves represent G double prime. Both G prime and G double prime increase with angular frequency at all 3 temperatures. The 180 degrees Celsius series occupies the highest modulus range, the 220 degrees Celsius series is intermediate, and the 260 degrees Celsius series occupies the lowest range.

PLA/OW10 viscosity η*, storage G′ and loss G″ moduli

Source: Authors’ own work

Close modal
Figure 9
A two-panel surface-topography comparison maps height from 0 to 70 micrometres across areas of about 3.5 by 2.5 millimetres, with Panel B having taller surface peaks.The two panels present three-dimensional surface topography over horizontal dimensions measured in millimetres. Surface height is measured in micrometres and ranges from 0 to 70 micrometres in both panels. Panel A covers approximately 0 to 3.5 millimetres along one horizontal axis and 0 to 2.5 millimetres along the other. The surface contains many closely spaced peaks and depressions, with most heights concentrated in the lower to middle part of the 0 to 70 micrometre range and several isolated higher peaks. Panel B covers approximately the same horizontal dimensions. Its surface contains broader height variations and more prominent elevated regions, including several peaks approaching 70 micrometres. Both panels include X, Y and Z orientation indicators and vertical scales from 0 to 70 micrometres.

Surface topography of 3D-printed samples of (a) PLA/OW05 and (b) PLA/OW20

Source: Authors’ own work

Figure 9
A two-panel surface-topography comparison maps height from 0 to 70 micrometres across areas of about 3.5 by 2.5 millimetres, with Panel B having taller surface peaks.The two panels present three-dimensional surface topography over horizontal dimensions measured in millimetres. Surface height is measured in micrometres and ranges from 0 to 70 micrometres in both panels. Panel A covers approximately 0 to 3.5 millimetres along one horizontal axis and 0 to 2.5 millimetres along the other. The surface contains many closely spaced peaks and depressions, with most heights concentrated in the lower to middle part of the 0 to 70 micrometre range and several isolated higher peaks. Panel B covers approximately the same horizontal dimensions. Its surface contains broader height variations and more prominent elevated regions, including several peaks approaching 70 micrometres. Both panels include X, Y and Z orientation indicators and vertical scales from 0 to 70 micrometres.

Surface topography of 3D-printed samples of (a) PLA/OW05 and (b) PLA/OW20

Source: Authors’ own work

Close modal
Figure 10
A grouped bar chart compares S q surface roughness at 20 and 200 millimetres per second across extrusion temperatures from 180 to 280 degrees Celsius.The chart plots S q in micrometres against extrusion temperature in degrees Celsius for speeds of 20 and 200 millimetres per second. Temperatures are 180, 200, 220, 240, 260 and 280 degrees Celsius. At 20 millimetres per second, S q is approximately 7.5, 7.2, 7.0, 6.4, 7.0 and 8.2 micrometres, respectively. At 200 millimetres per second, S q is approximately 7.0, 6.8, 5.2, 5.0, 5.3 and 6.5 micrometres. At every temperature, the 20 millimetres per second value is higher than the 200 millimetres per second value. Both series decline towards 240 degrees Celsius and then increase. Error bars are present for all measurements.

Sq of the printed surfaces of PLA/OW05 as a function of extrusion temperature (180–280°C) at two printing speeds (20 and 200 mm/s)

Source: Authors’ own work

Figure 10
A grouped bar chart compares S q surface roughness at 20 and 200 millimetres per second across extrusion temperatures from 180 to 280 degrees Celsius.The chart plots S q in micrometres against extrusion temperature in degrees Celsius for speeds of 20 and 200 millimetres per second. Temperatures are 180, 200, 220, 240, 260 and 280 degrees Celsius. At 20 millimetres per second, S q is approximately 7.5, 7.2, 7.0, 6.4, 7.0 and 8.2 micrometres, respectively. At 200 millimetres per second, S q is approximately 7.0, 6.8, 5.2, 5.0, 5.3 and 6.5 micrometres. At every temperature, the 20 millimetres per second value is higher than the 200 millimetres per second value. Both series decline towards 240 degrees Celsius and then increase. Error bars are present for all measurements.

Sq of the printed surfaces of PLA/OW05 as a function of extrusion temperature (180–280°C) at two printing speeds (20 and 200 mm/s)

Source: Authors’ own work

Close modal
Figure 11
A six-sample surface comparison presents textures at 20 and 200 millimetres per second for extrusion temperatures of 180, 240 and 280 degrees Celsius.The comparison is arranged by speed and extrusion temperature. The columns are 180, 240 and 280 degrees Celsius. The rows are 20 and 200 millimetres per second. At 20 millimetres per second and 180 degrees Celsius, the circular surface has a fine, closely packed texture with a few long linear marks. At 240 degrees Celsius, the surface appears coarser with more visible irregular fibrous features. At 280 degrees Celsius, the surface has pronounced elongated parallel features across much of the specimen. At 200 millimetres per second and 180 degrees Celsius, the surface has a fine granular texture. At 240 degrees Celsius, it remains densely textured with several longer linear marks. At 280 degrees Celsius, the surface contains strongly defined elongated parallel grooves and several crossing linear marks.

As-printed surface appearance of PLA/OW20 under different extrusion temperatures (180–280°C) and printing speeds (20 and 200 mm/s)

Source: Authors’ own work

Figure 11
A six-sample surface comparison presents textures at 20 and 200 millimetres per second for extrusion temperatures of 180, 240 and 280 degrees Celsius.The comparison is arranged by speed and extrusion temperature. The columns are 180, 240 and 280 degrees Celsius. The rows are 20 and 200 millimetres per second. At 20 millimetres per second and 180 degrees Celsius, the circular surface has a fine, closely packed texture with a few long linear marks. At 240 degrees Celsius, the surface appears coarser with more visible irregular fibrous features. At 280 degrees Celsius, the surface has pronounced elongated parallel features across much of the specimen. At 200 millimetres per second and 180 degrees Celsius, the surface has a fine granular texture. At 240 degrees Celsius, it remains densely textured with several longer linear marks. At 280 degrees Celsius, the surface contains strongly defined elongated parallel grooves and several crossing linear marks.

As-printed surface appearance of PLA/OW20 under different extrusion temperatures (180–280°C) and printing speeds (20 and 200 mm/s)

Source: Authors’ own work

Close modal
Figure 12
A four-panel radar comparison presents P L A slash O W 05, 10, 15 and 20 values at 20 and 200 millimetres per second across 6 extrusion temperatures.The four radar plots compare values from 20 to 40 across extrusion temperatures of 180, 200, 220, 240, 260 and 280 degrees Celsius. Each panel compares 20 and 200 millimetres per second. Panel A is P L A slash O W 05. The 2 speed profiles remain similar, with values generally between about 25 and 34. Higher values occur near 180 and 200 degrees Celsius, while lower values occur near 240 and 260 degrees Celsius. Panel B is P L A slash O W 10. The 200 millimetres per second profile remains above the 20 millimetres per second profile at all temperatures. Values range from about 23 to 32, with higher values near 180 and 280 degrees Celsius and lower values near 240 degrees Celsius. Panel C is P L A slash O W 15. The 200 millimetres per second profile is higher than the 20 millimetres per second profile throughout. Values range from about 20 to 32. The 20 millimetres per second profile reaches its lowest value near 280 degrees Celsius, while the 200 millimetres per second profile reaches its highest value near 280 degrees Celsius. Panel D is P L A slash O W 20. The 200 millimetres per second profile remains above the 20 millimetres per second profile across the temperature range. Values are highest near 180 to 200 degrees Celsius for both speeds. The 20 millimetres per second profile decreases markedly near 280 degrees Celsius, while the 200 millimetres per second profile remains near 33.

Variation of L* of PLA/OW composites as a function of T and V

Source: Authors’ own work

Figure 12
A four-panel radar comparison presents P L A slash O W 05, 10, 15 and 20 values at 20 and 200 millimetres per second across 6 extrusion temperatures.The four radar plots compare values from 20 to 40 across extrusion temperatures of 180, 200, 220, 240, 260 and 280 degrees Celsius. Each panel compares 20 and 200 millimetres per second. Panel A is P L A slash O W 05. The 2 speed profiles remain similar, with values generally between about 25 and 34. Higher values occur near 180 and 200 degrees Celsius, while lower values occur near 240 and 260 degrees Celsius. Panel B is P L A slash O W 10. The 200 millimetres per second profile remains above the 20 millimetres per second profile at all temperatures. Values range from about 23 to 32, with higher values near 180 and 280 degrees Celsius and lower values near 240 degrees Celsius. Panel C is P L A slash O W 15. The 200 millimetres per second profile is higher than the 20 millimetres per second profile throughout. Values range from about 20 to 32. The 20 millimetres per second profile reaches its lowest value near 280 degrees Celsius, while the 200 millimetres per second profile reaches its highest value near 280 degrees Celsius. Panel D is P L A slash O W 20. The 200 millimetres per second profile remains above the 20 millimetres per second profile across the temperature range. Values are highest near 180 to 200 degrees Celsius for both speeds. The 20 millimetres per second profile decreases markedly near 280 degrees Celsius, while the 200 millimetres per second profile remains near 33.

Variation of L* of PLA/OW composites as a function of T and V

Source: Authors’ own work

Close modal
Figure 13
A two-panel scatter comparison plots a star against b star for P L A slash O W 05, 10, 15 and 20, with points labelled from 180 to 280.The two panels plot a star on the horizontal axis and b star on the vertical axis for P L A slash O W 05, P L A slash O W 10, P L A slash O W 15 and P L A slash O W 20. Each material contains points labelled 180, 200, 220, 240, 260 or 280. Panel A has a star values from 0 to 10 and b star values from 0 to 10. Most points cluster between a star values of about 6.5 and 9.5 and b star values of about 5.0 and 9.1. P L A slash O W 05 occupies approximately a star 6.6 to 9.4 and b star 5.0 to 8.5. P L A slash O W 10 extends from approximately a star 5.6 to 7.6 and b star 3.2 to 7.4. P L A slash O W 15 includes points from approximately a star 4.5 to 8.3 and b star 1.5 to 8.5. P L A slash O W 20 extends from approximately a star 3.9 to 8.2 and b star 0.5 to 9.1. Panel B also uses a star and b star scales from 0 to 10. The points are concentrated between a star values of about 7.0 and 9.5 and b star values of about 5.5 and 9.9. P L A slash O W 05 extends from approximately a star 7.7 to 9.5 and b star 6.1 to 9.0. P L A slash O W 10 clusters near a star 7.0 to 7.8 and b star 5.6 to 7.0. P L A slash O W 15 clusters near a star 7.0 to 7.7 and b star 6.3 to 8.2. P L A slash O W 20 occupies approximately a star 7.9 to 8.3 and b star 8.2 to 9.9.

CIELAB colour coordinates (a*, b*) of PLA/OW composites printed at different extrusion temperatures and two printing speeds: (a) 20 mm/s and (b) 200 mm/s

Source: Authors’ own work

Figure 13
A two-panel scatter comparison plots a star against b star for P L A slash O W 05, 10, 15 and 20, with points labelled from 180 to 280.The two panels plot a star on the horizontal axis and b star on the vertical axis for P L A slash O W 05, P L A slash O W 10, P L A slash O W 15 and P L A slash O W 20. Each material contains points labelled 180, 200, 220, 240, 260 or 280. Panel A has a star values from 0 to 10 and b star values from 0 to 10. Most points cluster between a star values of about 6.5 and 9.5 and b star values of about 5.0 and 9.1. P L A slash O W 05 occupies approximately a star 6.6 to 9.4 and b star 5.0 to 8.5. P L A slash O W 10 extends from approximately a star 5.6 to 7.6 and b star 3.2 to 7.4. P L A slash O W 15 includes points from approximately a star 4.5 to 8.3 and b star 1.5 to 8.5. P L A slash O W 20 extends from approximately a star 3.9 to 8.2 and b star 0.5 to 9.1. Panel B also uses a star and b star scales from 0 to 10. The points are concentrated between a star values of about 7.0 and 9.5 and b star values of about 5.5 and 9.9. P L A slash O W 05 extends from approximately a star 7.7 to 9.5 and b star 6.1 to 9.0. P L A slash O W 10 clusters near a star 7.0 to 7.8 and b star 5.6 to 7.0. P L A slash O W 15 clusters near a star 7.0 to 7.7 and b star 6.3 to 8.2. P L A slash O W 20 occupies approximately a star 7.9 to 8.3 and b star 8.2 to 9.9.

CIELAB colour coordinates (a*, b*) of PLA/OW composites printed at different extrusion temperatures and two printing speeds: (a) 20 mm/s and (b) 200 mm/s

Source: Authors’ own work

Close modal
Figure 14
A three-panel surface comparison plots L star, a star and b star responses against temperature and speed, revealing distinct curved trends across the ranges.The three panels present three-dimensional response surfaces against temperature, T, in degrees Celsius and speed, V, in millimetres per second. Temperature ranges from about 180 to 280 degrees Celsius, while speed ranges from about 25 to 200 millimetres per second. Panel A presents L star, with values of approximately 30 to 34. L star generally decreases as temperature increases and rises as speed increases. Panel B presents a star, with values of approximately 5.0 to 8.8. The surface generally decreases with increasing temperature and increases with speed. Panel C presents b star, with values of approximately 6.7 to 9.5. The surface rises to a broad maximum at intermediate temperatures before decreasing towards 280 degrees Celsius. Its values also vary across the speed range.

Response surface plots of T and V effects on the colour parameters: (a) L*, (b) a* and (c) b* of PLA/OW05

Source: Authors’ own work

Figure 14
A three-panel surface comparison plots L star, a star and b star responses against temperature and speed, revealing distinct curved trends across the ranges.The three panels present three-dimensional response surfaces against temperature, T, in degrees Celsius and speed, V, in millimetres per second. Temperature ranges from about 180 to 280 degrees Celsius, while speed ranges from about 25 to 200 millimetres per second. Panel A presents L star, with values of approximately 30 to 34. L star generally decreases as temperature increases and rises as speed increases. Panel B presents a star, with values of approximately 5.0 to 8.8. The surface generally decreases with increasing temperature and increases with speed. Panel C presents b star, with values of approximately 6.7 to 9.5. The surface rises to a broad maximum at intermediate temperatures before decreasing towards 280 degrees Celsius. Its values also vary across the speed range.

Response surface plots of T and V effects on the colour parameters: (a) L*, (b) a* and (c) b* of PLA/OW05

Source: Authors’ own work

Close modal
Figure 15
A two-panel bar chart compares delta E infinity for 4 P L A slash O W materials across extrusion temperatures from 180 to 280 degrees Celsius.The two panels plot delta E infinity from 0 to 10 against extrusion temperature from 180 to 280 degrees Celsius. The materials are P L A slash O W 05, P L A slash O W 10, P L A slash O W 15 and P L A slash O W 20. Dashed horizontal reference lines mark delta E infinity values of approximately 1 and 3. In Panel A, values are near 0 at 180 degrees Celsius. At 200 degrees Celsius, the 4 materials are approximately 0.4, 0.5, 0.3 and 0.9. At 220 degrees Celsius, they are approximately 0.2, 0.5, 0.8 and 1.4. At 240 degrees Celsius, they are approximately 2.2, 0.6, 2.7 and 0.4. At 260 degrees Celsius, they are approximately 1.8, 1.6, 0.7 and 2.5. At 280 degrees Celsius, they increase to approximately 4.0, 3.1, 5.2 and 9.0. In Panel B, values at 180 degrees Celsius are approximately 1.7, 2.2, 2.0 and 2.0. At 200 degrees Celsius, they are approximately 1.7, 1.3, 2.2 and 1.8. At 220 degrees Celsius, they are approximately 0.3, 1.1, 1.8 and 2.0. At 240 degrees Celsius, they are approximately 0.9, 1.6, 2.4 and 3.0. At 260 degrees Celsius, they are approximately 1.7, 2.1, 3.1 and 2.5. At 280 degrees Celsius, they are approximately 2.4, 2.2, 3.2 and 1.6.

Colour difference ΔE00 of PLA/OW composites as a function of extrusion temperature for (a) 20 mm/s and (b) 200 mm/s

Source: Authors’ own work

Figure 15
A two-panel bar chart compares delta E infinity for 4 P L A slash O W materials across extrusion temperatures from 180 to 280 degrees Celsius.The two panels plot delta E infinity from 0 to 10 against extrusion temperature from 180 to 280 degrees Celsius. The materials are P L A slash O W 05, P L A slash O W 10, P L A slash O W 15 and P L A slash O W 20. Dashed horizontal reference lines mark delta E infinity values of approximately 1 and 3. In Panel A, values are near 0 at 180 degrees Celsius. At 200 degrees Celsius, the 4 materials are approximately 0.4, 0.5, 0.3 and 0.9. At 220 degrees Celsius, they are approximately 0.2, 0.5, 0.8 and 1.4. At 240 degrees Celsius, they are approximately 2.2, 0.6, 2.7 and 0.4. At 260 degrees Celsius, they are approximately 1.8, 1.6, 0.7 and 2.5. At 280 degrees Celsius, they increase to approximately 4.0, 3.1, 5.2 and 9.0. In Panel B, values at 180 degrees Celsius are approximately 1.7, 2.2, 2.0 and 2.0. At 200 degrees Celsius, they are approximately 1.7, 1.3, 2.2 and 1.8. At 220 degrees Celsius, they are approximately 0.3, 1.1, 1.8 and 2.0. At 240 degrees Celsius, they are approximately 0.9, 1.6, 2.4 and 3.0. At 260 degrees Celsius, they are approximately 1.7, 2.1, 3.1 and 2.5. At 280 degrees Celsius, they are approximately 2.4, 2.2, 3.2 and 1.6.

Colour difference ΔE00 of PLA/OW composites as a function of extrusion temperature for (a) 20 mm/s and (b) 200 mm/s

Source: Authors’ own work

Close modal
Figure 16
A four-panel S E M comparison presents fracture surfaces with a smooth region, microcavities, pull-out imprints, elongated cavities, voids and wood particles.The four panels present S E M fracture surfaces at 100 times magnification with a 100 micrometre scale bar. Panel A contains a broad relatively smooth fracture surface with parallel surface lines and a rougher fractured edge. Panel B contains a textured fracture surface with a labelled microcavity and a labelled wood particle. Panel C contains an irregular fractured region with a labelled microcavity and a labelled pull-out imprint near the lower edge. Panel D contains a rough layered fracture surface with labelled elongated cavities, voids, a pull-out imprint and a wood particle.

Demonstration of 3D pyrography effect using (a) PLA/OW20 and (b) PLA/OW05

Source: Authors’ own work

Figure 16
A four-panel S E M comparison presents fracture surfaces with a smooth region, microcavities, pull-out imprints, elongated cavities, voids and wood particles.The four panels present S E M fracture surfaces at 100 times magnification with a 100 micrometre scale bar. Panel A contains a broad relatively smooth fracture surface with parallel surface lines and a rougher fractured edge. Panel B contains a textured fracture surface with a labelled microcavity and a labelled wood particle. Panel C contains an irregular fractured region with a labelled microcavity and a labelled pull-out imprint near the lower edge. Panel D contains a rough layered fracture surface with labelled elongated cavities, voids, a pull-out imprint and a wood particle.

Demonstration of 3D pyrography effect using (a) PLA/OW20 and (b) PLA/OW05

Source: Authors’ own work

Close modal
Table 1

Printing parameters

ParameterValue
Layer height (mm)0.2
Layer width (mm)0.4
Raster angle (°)45
Infill density (%)100
Infill patternLine
Printing speed (mm/s)20–200
Flow (%)100
Nozzle diameter (mm)0.4
Extrusion temperature (°C)180–280
Build plate temperature (°C)65
Build orientationHorizontal (XY)
Source(s): Authors’ own work
Table 2

Main FTIR absorption bands of PLA and PLA/OW composites

Wavenumber (cm−1)AssignmentOrigin
3,440O–H stretchingHydroxyl groups (cellulose, hemicellulose, lignin)
2,940C–H asymmetric stretching (CH3/CH2)PLA backbone and wood polysaccharides
2,860C–H2 symmetric stretchingPLA and wood polysaccharides
1,745C = O stretching (ester carbonyl)PLA
1,558Aromatic C = C stretchingLignin
1,515Aromatic skeletal vibrationsLignin
1,465C–H bending (CH3 asymmetric deformation)PLA (with contributions from wood)
1,080C–O stretching (C–O–C, polysaccharides)PLA and wood (cellulose/hemicellulose)
870C–H rocking/skeletal vibrationPLA crystalline domains
760Aromatic C–H out-of-plane bendingLignin
Source(s): Authors’ own work
Table 3

DSC parameters of PLA and PLA/OW composites

MaterialTg (°C)Tm (°C)ΔHm (J/g)Xc (%)
Neat PLA62.0149.923.7625.5
PLA/OW0561.1151.217.8619.2
PLA/OW1058.9151.117.5118.8
PLA/OW1558.7150.514.1215.2
PLA/OW2058.2151.113.7714.8
Source(s): Authors’ own work
Table 4

TGA parameters of PLA and PLA/OW composites

MaterialT5% (°C)Tmax (°C)Residue at 580 °C (%)
Neat PLA344.9375.90.2
PLA/OW05323.2361.12.4
PLA/OW10315.3356.34.9
PLA/OW15302.1351.35.5
PLA/OW20293.2348.37.5
Source(s): Authors’ own work
Table 5

Surface parameters of PLA and PLA/OW composites

ParameterNeat PLAPLA/OW05PLA/OW10PLA/OW15PLA/OW20
Sa (µm)3.593.764.575.385.39
Sq (µm)5.015.086.057.417.52
Sz (µm)42.3248.5654.2365.7176.40
Source(s): Authors’ own work
Table 6

ANOVA for the colour parameters L*, a* and b* of PLA/OW05

VariableTerm.Sum of squaresMean squareF-ratiop-value
L*T30.432830.432817848.5<0.001
V8.897938.897935218.53<0.001
T·T1.077631.07763632.02<0.001
T·V0.2655980.265598155.77<0.001
R2 (adjusted) = 99.99%
a*T10.33510.3351210.46<0.001
V0.1231090.12310914.420.003
T·T5.172815.17281605.85<0.001
T·V2.489032.48903291.52<0.001
R2 (adjusted) = 99.27%
b*T28.187128.1871396,942.13<0.001
V3.731133.7311352,543.23<0.001
T·T0.2124140.2124142,991.29<0.001
T·V0.1591830.1591832,241.67<0.001
 R2 (adjusted) = 99.99%
Source(s): Authors’ own work

Supplements

Supplementary data

References

Altınsoy
,
Ş.
(
2025
), “
Effect of print orientation and recycling on the mechanical and tribological properties of 3D-printed PLA polymer materials
”,
Journal of Mechanical Science and Technology
, Vol.
39
No.
10
, pp.
5897
-
5912
, doi: .
Altınsoy
,
M.
,
Demirel
,
M.
and
Beköz Üllen
,
N.Ş.
(
2025
), “
Effect of the build orientations on mechanical, superficial and bioactivity properties of additively manufactured PLA and recycled PLA filaments
”,
Journal of Polymer Research
, Vol.
32
No.
11
, p.
597
, doi: .
Awal
,
A.
,
Rana
,
M.
and
Sain
,
M.
(
2015
), “
Thermorheological and mechanical properties of cellulose reinforced PLA bio-composites
”,
Mechanics of Materials
, Vol.
80
, pp.
87
-
95
, doi: .
Bharat
,
N.
,
Kumar
,
V.
,
Veeman
,
D.
and
Vellaisamy
,
M.
(
2025
), “
Enhancing mechanical properties of 3D-printed PLA/wood composites: a metaheuristic and statistical perspective
”,
European Journal of Wood and Wood Products
, Vol.
83
No.
3
, pp.
809
-
826
, doi: .
Boschetto
,
A.
,
Giordano
,
V.
and
Veniali
,
F.
(
2013
), “
3D roughness profile model in fused deposition modelling
”,
Rapid Prototyping Journal
, Vol.
19
No.
4
, pp.
240
-
252
, doi: .
Comino
,
F.
,
Martinez-Sánchez
,
J.A.
,
Romero
,
P.E.
,
Gurrado
,
N.
and
Spina
,
R.
(
2025
), “
thermo-mechanical properties of polylactic acid/olive wood composite for additive manufacturing
”,
Materials Research Proceedings
, Vol.
54
,
Association of American Publishers
, pp.
2344
-
2351
, .
Comino
,
F.
,
Romero
,
P.E.
,
Molero
,
E.
and
Ruiz de Adana
,
M.
(
2023
), “
Experimental evaluation of a 3D printed air dehumidification system developed with green desiccant materials
”,
Applied Thermal Engineering
, Vol.
227
, p.
120393
, doi: .
Cui
,
L.
,
Yi
,
L.
,
Wang
,
Y.
,
Zhang
,
Y.
,
Polyák
,
P.
,
Sui
,
X.
and
Pukánszky
,
B.
(
2021
), “
Rheology of PLA/regenerated cellulose nanocomposites prepared by the pickering emulsion process: network formation and modeling
”,
Materials & Design
, Vol.
206
, p.
109774
, doi: .
dos Santos
,
N.V.
,
Cavalcanti
,
D.K.K.
,
Neto
,
J.S.S.
,
de Queiroz
,
H.F.M.
,
Banea
,
M.D.
and
Cardoso
,
D.C.T.
(
2025
), “
Analysis of voids, interfacial and thermal properties of additively manufactured continuous natural fiber-reinforced biocomposites
”,
Progress in Additive Manufacturing
, Vol.
10
No.
8
, pp.
5401
-
5422
, doi: .
Ehman
,
N.
,
Ponce de León
,
A.
,
Quintero Torres
,
IN.
,
Vallejos
,
M.E.
and
Area
,
M.C.
(
2025
), “
Lignocellulosic agro-forest byproducts as feedstock for fused deposition modeling 3D printing filaments: a review
”,
Fibers
, Vol.
13
No.
9
, p.
124
, doi: .
Fico
,
D.
,
Rizzo
,
D.
,
De Carolis
,
V.
,
Montagna
,
F.
,
Palumbo
,
E.
and
Corcione
,
C.E.
(
2022
), “
Development and characterization of sustainable PLA/olive wood waste composites for rehabilitation applications using fused filament fabrication (FFF)
”,
Journal of Building Engineering
, Vol.
56
, p.
104673
, doi: .
Golhin
,
A.P.
,
Tonello
,
R.
,
Frisvad
,
J.R.
,
Grammatikos
,
S.
and
Strandlie
,
A.
(
2023
), “
Surface roughness of as-printed polymers: a comprehensive review
”,
The International Journal of Advanced Manufacturing Technology
, Vol.
127
Nos
3-4
, pp.
5511
-
5553
, doi: .
ISO
(
2019
), “ISO 11664-4:2019. Colorimetry – part 4: CIE 1976 L*a*b* colour space”,
International Organization for Standardization
,
Geneva
.
Jaróg
,
T.
,
Góra
,
M.
,
Góra
,
M.
,
Maroszek
,
M.
,
Hodor
,
K.
,
Hodor
,
K.
,
Hebda
,
M.
, et al. (
2025
), “
Biodegradable meets functional: dual-nozzle printing of eco-conscious parklets with wood-filled PLA
”,
Materials
, Vol.
18
No.
13
, p.
2951
, doi: .
Jasiński
,
W.
,
Szymanowski
,
K.
,
Nasiłowska
,
B.
,
Barlak
,
M.
,
Betlej
,
I.
,
Prokopiuk
,
A.
and
Borysiuk
,
P.
(
2025
), “
3D printing wood–PLA composites: the impact of wood particle size
”,
Polymers
, Vol.
17
No.
9
, p.
1165
, doi: .
Jiang
,
S.
,
Hu
,
K.
,
Zhan
,
Y.
,
Zhao
,
C.
and
Li
,
X.
(
2022
), “
Theoretical and experimental investigation on the 3D surface roughness of material extrusion additive manufacturing products
”,
Polymers
, Vol.
14
No.
2
, p.
293
, doi: .
Kariz
,
M.
,
Sernek
,
M.
,
Obućina
,
M.
and
Kuzman
,
M.K.
(
2018
), “
Effect of wood content in FDM filament on properties of 3D printed parts
”,
Materials Today Communications
, Vol.
14
, pp.
135
-
140
, doi: . Vol
Khan
,
I.
,
Amin
,
J.
,
Abas
,
M.
,
Babar
,
M.
,
Mikail Shah
,
S.
,
Ali
,
A.
,
Rasheed
,
A.
, et al. (
2025
), “
Extrusion additive manufacturing of particle-reinforced polymer composites: materials, processes, and applications
”,
Progress in Additive Manufacturing
, Vol.
10
No.
11
, pp.
6415
-
6453
, doi: .
Lee
,
C.H.
,
Padzil
,
F.N.B.M.
,
Lee
,
S.H.
,
Ainun
,
Z.M.A.
and
Abdullah
,
L.C.
(
2021
), “
Potential for natural fiber reinforcement in PLA polymer filaments for fused deposition modeling (FDM) additive manufacturing: a review
”,
Polymers
, Vol.
13
No.
9
, p.
1407
, doi: .
Le Guen
,
M.J.
,
Hill
,
S.
,
Smith
,
D.
,
Theobald
,
B.
,
Gaugler
,
E.
,
Barakat
,
A.
and
Mayer-Laigle
,
C.
(
2019
), “
Influence of rice husk and wood biomass properties on the manufacture of filaments for fused deposition modeling
”,
Frontiers in Chemistry
, Vol.
7
, p.
735
, doi: .
Liu
,
Z.
,
Lei
,
Q.
and
Xing
,
S.
(
2019
), “
Mechanical characteristics of wood, ceramic, metal and carbon fiber-based PLA composites fabricated by FDM
”,
Journal of Materials Research and Technology
, Vol.
8
No.
5
, pp.
3743
-
3753
, doi: .
Lo Giudice
,
V.
,
Faraone
,
I.
,
Bruno
,
M.R.
,
Ponticelli
,
M.
,
Labanca
,
F.
,
Bisaccia
,
D.
,
Massarelli
,
C.
, et al. (
2021
), “
Olive trees by-products as sources of bioactive and other industrially useful compounds: a systematic review
”,
Molecules
, Vol.
26
No.
16
, p.
5081
, doi: .
Martínez-Sánchez
,
J.A.
,
Comino
,
F.
,
Romero
,
P.E.
and
Ruiz de Adana
,
M.
(
2025
), “
Design, development and performance evaluation of a 3D-printed desiccant wheel using poly-lactic acid and wood filaments for sustainable HVAC systems
”,
Building and Environment
, Vol.
276
, p.
112889
, doi: .
Mirza
,
F.
,
Baloor Shenoy
,
S.
,
Nunna
,
S.
,
Ramanath Kini
,
C.
and
Creighton
,
C.
(
2025
), “
Effect of material extrusion process parameters on tensile performance of pristine and discontinuous fibre reinforced PLA composites: a review
”,
Progress in Additive Manufacturing
, Vol.
10
No.
5
, pp.
3251
-
3265
, doi: .
Montgomery
,
D.C.
(
2004
),
Design and Analysis of Experiments
, (6th Edition.) ,
Wiley
.
Moon
,
K.
,
Yi
,
J.
,
Savage
,
V.
and
Bianchi
,
A.
(
2024
), “
3D printed pyrography: using wood filament and dynamic control of nozzle temperature for embedding shades of color in objects
”,
Additive Manufacturing
, Vol.
83
, p.
104064
, doi: .
Petinakis
,
E.
,
Liu
,
X.
,
Yu
,
L.
,
Way
,
C.
,
Sangwan
,
P.
,
Dean
,
K.
,
Bateman
,
S.
, et al. (
2010
), “
Biodegradation and thermal decomposition of poly(lactic acid)-based materials reinforced by hydrophilic fillers
”,
Polymer Degradation and Stability
, Vol.
95
No.
9
, pp.
1704
-
1707
, doi: .
Sharma
,
G.
,
Wu
,
W.
and
Dalal
,
E.N.
(
2005
), “
The CIEDE2000 color-difference formula: implementation notes, supplementary test data, and mathematical observations
”,
Color Research & Application
, Vol.
30
No.
1
, pp.
21
-
30
, doi: .
Sheng
,
D.D.C.V.
,
Yahya
,
M.N.B.
,
Din
,
N.B.C.
,
Wong
,
K.Y.
,
Asyraf
,
M.R.M.
and
Sekar
,
V.
(
2024
), “
Potential of wood fiber/polylactic acid composite microperforated panel for sound absorption application in indoor environment
”,
Construction and Building Materials
, Vol.
444
, p.
137750
, doi: .
Spina
,
R.
(
2025
), “
Surface appearance of poly lactic acid due to variations in material extrusion processing parameters
”,
Scientific Reports
, Vol.
15
No.
1
, p.
22684
, doi: .
Sultana
,
J.
,
Rahman
,
M.M.
,
Wang
,
Y.
,
Ahmed
,
A.
and
Xiaohu
,
C.
(
2024
), “
Influences of 3D printing parameters on the mechanical properties of wood PLA filament: an experimental analysis by Taguchi method
”,
Progress in Additive Manufacturing
, Vol.
9
No.
4
, pp.
1151
-
1165
, doi: .
Sun
,
Q.
,
Rizvi
,
G.M.
,
Bellehumeur
,
C.T.
and
Gu
,
P.
(
2008
), “
Effect of processing conditions on the bonding quality of FDM polymer filaments
”,
Rapid Prototyping Journal
, Vol.
14
No.
2
, pp.
72
-
80
, doi: .
Taktak
,
I.
,
Mansouri
,
A.
,
Guerfali
,
M.
,
Ayadi
,
I.
,
Souissi
,
S.
,
Gargouri
,
A.
,
Etoh
,
M.A.
, et al. (
2024
), “
Active bio composites films based on PLA/olive wood flour (Olea europaea L.)/cinnamon essential oil
”,
Polymer Bulletin
, Vol.
81
No.
1
, pp.
719
-
737
, doi: .
Taktak
,
I.
,
Mansouri
,
A.
,
Souissi
,
S.
,
Etoh
,
M.A.
and
Elloumi
,
A.
(
2023
), “
Biocomposites films based on polylactic acid and olive wood-flour: investigation on physical, thermal and mechanical properties
”,
Journal of Elastomers & Plastics
, Vol.
55
No.
4
, pp.
597
-
612
, doi: .
Tao
,
Y.
,
Wang
,
H.
,
Li
,
Z.
,
Li
,
P.
and
Shi
,
S.Q.
(
2017
), “
Development and application of wood flour-filled polylactic acid composite filament for 3d printing
”,
Materials
, Vol.
10
No.
4
, p.
339
, doi: .
TotalEnergies Corbion
(
2022
), “
Luminy® LX175: technical data sheet
”,
available at:
Link to Luminy® LX175: technical data sheetLink to the pdf of the cited article., (
accessed
22 July 2022)
Travieso-Rodriguez
,
J.A.
,
Jerez-Mesa
,
R.
,
Llumà
,
J.
,
Gomez-Gras
,
G.
and
Casadesus
,
O.
(
2021
), “
Comparative study of the flexural properties of ABS, PLA and a PLA–wood composite manufactured through fused filament fabrication
”,
Rapid Prototyping Journal
, Vol.
27
No.
1
, pp.
81
-
92
, doi: .
Turner
,
B.N.
,
Strong
,
R.
and
Gold
,
S.A.
(
2014
), “
A review of melt extrusion additive manufacturing processes: I. Process design and modeling
”,
Rapid Prototyping Journal
, Vol.
20
No.
3
, pp.
192
-
204
, doi: .
Yang
,
T.C.
and
Yeh
,
C.H.
(
2020
), “
Morphology and mechanical properties of 3D printed wood fiber/polylactic acid composite parts using fused deposition modeling (FDM): the effects of printing speed
”,
Polymers
, Vol.
12
No.
6
, p.
1334
, doi: .
Yue
,
Z.
,
Wang
,
H.
,
Zhang
,
M.
and
Wang
,
M.
(
2022
), “
Mechanical, thermal and rheological properties of polylactic acid (PLA)/epichlorohydrin modified pine wood flour (EWF) composites
”,
European Journal of Wood and Wood Products
, Vol.
80
No.
5
, pp.
1111
-
1120
, doi: .
Zhou
,
J.
,
Wang
,
B.
,
Xu
,
C.
,
Xu
,
Y.Z.
,
Tan
,
H.
,
Zhang
,
X.
and
Zhang
,
Y.
(
2022
), “
Performance of composite materials by wood fiber/polydopamine/silver modified PLA and the antibacterial property
”,
Journal of Materials Research and Technology
, Vol.
18
, pp.
428
-
438
, doi: .

Languages

or Create an Account

Close Modal
Close Modal