


This study aims to introduce an algorithm that can successfully define optimum laser-based powder bed fusion (LB-PBF) processing and post-heat treatment parameters for manufacturing 316L stainless steels with limited energy usage and enhanced properties.
Taguchi’s design of the experiment (DoE) was elaborated to define the ideal LB-PBF process and heat treatment parameters. Based on the DoE and experimental results, the LB-PBF energy density between 6.7 J/mm3 and 14.7 J/mm3 produced parts with a volumetric mass density of 98.8% or higher. The authors’ proposed processing window shows 316 L manufactured products can reach the highest mechanical strength reported in literature.
The microstructure characteristics of the enhanced 316L builds showed characteristic dislocation density, grain size and texture features. The proposed heat treatments at 650, 870 and 1,150 °C results in preferential grain growth up to approximately 45 µm, reorienting the as-built grain structure from < 100> to < 101> components. This promoted mechanical twinning propensity and the dynamic Hall–Petch effect, resulting in significant improvements in the mechanical properties.
The manufactured parts in the optimised conditions achieved improvement in ultimate tensile strength (970 MPa) and elongation (32%), representing a noticeable strength–ductility combination for LB-PBF of 316L.
1. Introduction
The 316L stainless steel (316L SS) is one of the most commonly used materials in engineering applications and has been successfully produced using a variety of additive manufacturing techniques. The laser-based powder bed fusion (LB-PBF) method has become highly regarded for manufacturing 316L SS due to its ability to create a unique hierarchical microstructure. This microstructure contributes to exceptional corrosion resistance and mechanical properties in the final printed product (Gibson et al., 2021). This largely includes large columnar grains (100 s microns via epitaxial growth during solidification) and a sub-structure consisting of approximately 1 µm diameter cellular network of high dislocation densities with Mo and Cr segregation (Bajaj et al., 2020; Wang et al., 2018). The industrial breakthrough of LB-PBF parts is still limited by the challenges of producing structures with minimal defects and heterogeneous structures, achieving mechanical properties comparable to conventional processes and relying on labour-intensive post-process procedures like powder removal, heat treatment and machining (Schneck et al., 2021; SN, 2024). The key to overcoming these issues lies in selecting the best LB-PBF method and post-process settings. Hence, the complex interaction among the microstructure constituents and LB-PBF processing parameters (i.e. process-microstructure-property relationships) needs to be clearly understood to optimise the process for printing defect-free 316L products with enhanced properties (Liverani et al., 2017; Kok et al., 2018).
The ability to control the LB-PBF process parameters (laser power, hatch distance, scan speed) and scanning strategies (the path of the laser vector) at specific layers, provides control over the complex thermal history and, consequently, the microstructure development. From one point, defects such as lack of fusion, keyhole and balling phenomenon may occur due to poorly chosen combination of parameters (Heeling and Wegener, 2018; Ronneberg et al., 2020; Röttger et al., 2016). The high thermal gradients produced by the localised and successive laser melting process can also generate thermal residual stresses as high as 500 MPa and lead to delamination, distortion and deterioration in the printed 316L SS product (Tapia and Elwany, 2014; DebRoy et al., 2018; Chen et al., 2018). On the other hand, the process parameters, such as laser power and scanning speed, play a crucial role in achieving and maintaining an acceptable density for the manufactured 316L SS parts. Parameters such as volumetric energy density are generally introduced to correlate processing parameters to the microstructure and properties of LB-PBF 316SS (Read et al., 2015). Earlier research has shown that maintaining the energy density within the range of 100–110 J/mm2 can result in defect-free 316L SS parts (Cherry et al., 2015; Wang et al., 2016; Sander et al., 2017); while deviating to excessively higher or lower energy densities may increase the likelihood of porosity formation (Leicht et al., 2020).
Apart from processing defects, the performance of the printed part is also influenced by its microstructural characteristics. The heat flow, competitive growth mechanisms and epitaxial grain growth result in the formation of elongated grains with a preferential crystal orientation along the building direction (Sun et al., 2018; Bahl et al., 2019). These coarse grain structures are largely aligned with a specific crystallographic orientation, which can have diverse impacts on the mechanical performance of the material. The commonly observed <100> textures in additive manufacturing (AM) of 316L SS are generally associated with lower strength and ductility (Suryawanshi et al., 2017; Niendorf et al., 2013). However, altering the processing parameters to induce the <110> components has been demonstrated to enhance the propensity for mechanical twinning, which in turn results in twinning-induced plasticity and improved mechanical properties (Marattukalam et al., 2020). Moyle et al. (2022) revealed that increasing scan speed at low laser powers (i.e.<200 W) realigns the austenitic grains of 316L SS along the <110> orientations, while at higher laser powers, grains generally lie between the <100> and <101> orientations. On the other hand, the unidirectional scanning strategy for face-centered cubic (FCC) materials (i.e. austenitic steels and model Ni alloys) has been associated with epitaxial grain growth and a strong fibre texture, while the bidirectional strategies can lead to mixed <100> and <110> textured grains (Marattukalam et al., 2020; Thijs et al., 2013; Dinda et al., 2012; Wei et al., 2015). Scanning rotation also affects the melt pool geometry and the grain growth pattern during the LB-PBF process. Previous studies have observed that single- or multiple 180° scanning rotations can result in strong <100> or <110> components (Sun et al., 2018; Leicht et al., 2020; Andreau et al., 2019). Marattukalam et al. (2020), on the other hand, showed that adding 67° rotations can effectively break up columnar grains, resulting in the creation of finer structures and improving the fibre texture in the printed 316L material. Across the whole spectrum of potential rotations and process parameters, little is known about how the interplay between the rotation angle, laser power, hatch distance and scan speed might impact the prevailing microstructure and optimise the properties of the 316L printed product.
In addition, post-process heat treatment can alleviate the defect structures, residual stresses, elemental segregation, microstructure heterogeneities and texture anisotropy (Tapia and Elwany, 2014; DebRoy et al., 2018; Chen et al., 2018). Heat treatment up to 1,400°C temperatures annihilates segregation and cellular network of the as-printed 316L SS and results in complete recrystallisation and grain growth (Lou et al., 2018; Laleh et al., 2019; Yadollahi et al., 2015; Chao et al., 2021). However, the as-printed microstructure exhibits stability when subjected to annealing at temperatures of up to 700°C (Ronneberg et al., 2020; Salman et al., 2019). These treatments enhance ductility while ensuring that strength is retained without substantial compromise. Despite these advancements, the effect of heat treatment on the highly contrasting microstructures developed via various LB-PBF processing parameters is still uncertain. This points out the requirement to assess many facets of this complex manufacturing technique and establish a coherent correlation between the process, post-process, microstructure and performance of 316L products.
Accordingly, the various aspects that affect the printing of a high-quality 316L SS product have rendered universal and optimum manufacturing conditions difficult to obtain. Previous studies have mainly focused on the effect of one or two aspects of material synthesis (i.e. process parameters, scanning strategy or post-processing) on the resultant microstructure and mechanical or corrosion properties. However, these aspects all influence microstructure and properties, with likely interrelated effects. This research is the extension of our previous study, which was focused on characterising melt pools in LB-PBF of stainless steel 316L by developing analytical models for meltpool temperatures (Khorasani et al., 2021) . In this study, we aim to investigate the optimised LB-PBF conditions of 316L SS for enhanced mechanical properties through using extensive microstructure analysis. The experimental array comprises laser power, scan speed, hatch space and laser pattern angle, along with different post-heat treatment processes to establish a processing-property relationship and an in-depth understanding of the evolution of the heat-treated microstructures (e.g. phase composition, grain morphology, grain boundary characteristics and texture analysis). The findings in the current work enable manufacturers to systematically optimise the processing parameters for the superior properties of 316L SS engineering parts.
2. Experimental setup
2.1 Powder material and LB-PBF operation
316L SS samples were printed on a Renishaw AM 400 system in an Argon atmosphere. The laser spot diameter has been set at a constant value of 100 µm for all test cases. The machine was equipped with an ytterbium solid laser that works at a 1,060 nm wavelength with a maximum power of 400 W. The printing chamber is vacuumed to 1% oxygen and then filled with argon to prevent the chemical reaction between the powder elements and the oxygen. The 316L SS powder provided by Renishaw, with an average particle size of 30 µm and the chemical composition of Table 1, was used for the LB-PBF process. The gas-atomised powder was mixed with virgin and recycled powder in a ratio of 70/30%. A 316L SS build plate was preheated to 170°C before the printing process. Preheating reduces the high cooling rate between the first layers and the build plate and decreases shrinkage forces and the chances of distortion. The printed samples’ relative density was then determined using the Archimedes method. The samples were subjected to a cleaning process and then submerged in distilled water using an electronic densimeter (Qualitest Model SD-200 L) with a precision of 0.0001 g/cm3. The measurements are calibrated based on the standard 316 L SS density in mill annealed state (8.00 g/cm3).
Composition (Wt.%) of the 316 = L SS powder
| Element | Fe | C | Cr | Ni | Mo | Mn | Si | Cu | Co |
|---|---|---|---|---|---|---|---|---|---|
| Wt.% | Bal. | 0.03 | 17.92 | 11.59 | 2.13 | 1.03 | 0.77 | 0.48 | <0.35 |
Based on the proposed DoE and American society for testing materials (ASTM) E8 standards for tensile testing, 25 flat tensile samples were printed along the Y direction (Astm, 2016). Figure 1(a) shows the printing orientation and dimension of the tensile test samples and scanning pattern. A meander laser scanning path with 67° rotation between the two subsequent layers was used to efficiently break the columnar grain formed during the LB-PBF process [Figure 1(b)] (Marattukalam et al., 2020).
 The panel a shows as built L B P B F walls on a base plate with X, Y, and Z, B D coordinate axes. A wire cut operation removes a specimen from the wall along the indicated cutting direction. Panel b shows a meander pattern with hatch paths changing direction repeatedly, and the angle theta marked beside the pattern. Panel c shows the wire cut test specimen with an overall length of 100 millimetres. The reduced gauge section measures 31 millimetres in length. The grip section measures 30 millimetres in length. The specimen thickness is 3 millimetres. The specimen width is 10 millimetres. A central feature measures 6 millimetres.
(a) The schematic illustration of as-built 316L, (b) LB-PBF Scan pattern and (c) wire-cut tensile test sample dimensions
The panel a shows as built L B P B F walls on a base plate with X, Y, and Z, B D coordinate axes. A wire cut operation removes a specimen from the wall along the indicated cutting direction. Panel b shows a meander pattern with hatch paths changing direction repeatedly, and the angle theta marked beside the pattern. Panel c shows the wire cut test specimen with an overall length of 100 millimetres. The reduced gauge section measures 31 millimetres in length. The grip section measures 30 millimetres in length. The specimen thickness is 3 millimetres. The specimen width is 10 millimetres. A central feature measures 6 millimetres.(a) The schematic illustration of as-built 316L, (b) LB-PBF Scan pattern and (c) wire-cut tensile test sample dimensions
2.2 Design of experiments
Full factorial DoE designs can provide more efficient and reliable experiments. Still, the total test number and the experimentation time increase, making the test difficult to perform. In this experiment, five parameters at five levels, including laser power, scan speed, hatch space, scanning pattern angle and heat treatment, were selected, making a total test number of 55 = 3125. Taguchi DoE can considerably reduce the experiment’s time and cost while insignificantly decreasing its accuracy. The current work selects a Taguchi L25 DoE for five inputs and a single output. It should be noted that details about the factor/level selection, L25 array construction, replication strategy and the thermophysical formulation linking process inputs to melt-pool temperature for this statistically driven Taguchi-based workflow have been previously presented in a prior publication by the authors (Khorasani et al., 2021). Here, 75 optimised printing conditions are obtained based on the DoE results (Table 2). It should be noted that two different angular parameters are being used in this study. The meander scanning strategy with a fixed 67° rotation between successive layers is applied to all printing conditions. This inter-layer rotation was not part of the design of experiments and was kept constant throughout the study to minimise texture anisotropy and disrupt continuous columnar grain growth, following previous findings (Marattukalam et al., 2020). On the other hand, the “Scanning Pattern Angle” used in DOE and listed in Table 2 refers to the in-plane orientation of the laser scan vectors within each individual layer, relative to the x–y build platform. This angle was treated as a variable in the Taguchi DOE to investigate its influence on melt pool geometry and microstructure. After each layer is completed at its specified scanning angle, the next layer is additionally rotated by 67° regardless of the in-plane angle assigned in Table 2.
The selected process and post-process parameters for Taguchi L25 DOE. (layer thickness was selected as a constant value of 40 µm for all experiments)
| Laser power (W) | Scan speed (mm/s) | Hatch spacing (µm) | Scanning pattern angle (°) | Heat treatment temperature (°C) | Average relative density (%) |
|---|---|---|---|---|---|
| 150 | 650 | 60 | 36 | 20 | 98.34 |
| 175 | 700 | 65 | 40 | 425 | 98.74 |
| 200 | 750 | 70 | 45 | 650 | 98.78 |
| 225 | 800 | 75 | 60 | 870 | 98.96 |
| 250 | 850 | 80 | 72 | 1150 | 98.99 |
2.3 Post-processing (heat treatment)
A fluidised bed furnace consisting of solid particles such as aluminium oxide and Silica was used for heat treatments. The atmosphere of the chamber was controlled by filling it with nitrogen gas. This technique leads to macroscopic separation of the particles and produces uniform treatment on the bulk of the components. The as-built parts were heated up to 425°C, 650°C, 870°C and 1,150°C for two hours, followed by air cooling to room temperature. Heating the parts to 425°C provides stress relief and is extensively used to enhance dimensional stability and reduce stress corrosion cracking in 316L SS. The heat treatments at 650°C and 870°C are associated with the minimum and maximum temperature of sensitising and 1150°C is in the range of solution treatment, which can produce a homogeneous microstructure for the as-built material (Cui et al., 2021; Ebling and Scheil, 1965). Two hours of heat treatment followed by air cooling were selected for 25 samples with three repetitions (a total of 75 samples, Table S1). The two hour dwell across the heat treatment temperatures were used to balance recovery/recrystallisation and homogenisation while avoiding over-sensitisation (Ebling and Scheil, 1965). This aligns with TTS guidance for 316 L and with common LPBF-316L practice, where approximately 2 h holds are reported to enable dislocation recovery and partial recrystallisation within 650–870°C while providing effective solutionising/homogenisation of the AM substructure at 1,150°C (Chao et al., 2021; Laleh et al., 2021).
2.4 Tensile test
To analyse the mechanical performance of the built parts, tensile tests were performed at ambient temperature using a load frame Instron 8801-100KN testing machine equipped with Bluehill software and hydraulic. The gauge length and pre-load were reset before each test to compensate for the tension on the jaws. Tensile samples had a gauge length of approximately 31 mm and the tests were executed at a strain rate of 0.03 s−1 [Figure 1(c)]. The detailed dimensions of the tensile samples are depicted in Figure 1(a). Tensile tests were conducted on three independently fabricated specimens per condition after heat treatment to ensure reproducibility and statistical robustness.
2.5 Microstructure analysis
The microstructure of the as-printed and heat-treated samples was examined on different sections of the printed product (i.e. parallel, transverse and perpendicular to the build direction). It should be noted that the observed sections were taken from the middle of the deposit. Electron microscopy (SEM), angular selective backscattered (ASB) and Electron backscattered diffraction (EBSD) were used for a detailed analysis. Each section was grounded up to 1,200 grit sandpaper and mirror polished using a 0.04-µm OPS suspension. The Supra 55VP scanning electron microscope performed SEM and ASB imaging at an accelerating voltage of 20 kV. For the EBSD measurements, a FEG Quanta 3-D FEI SEM operating at 20 kV and 8 nA was used. The data acquisition was elaborated by TexSEM Laboratories Inc., software (TSL). Multiple scans covering an area of 1,850 μm × 1,850 μm with a step size of 1.5 μm were executed for the samples of interest. The average confidence index for all measured samples was higher than 0.70. TSL orientation imaging microscopy (OIM) Analysis V6.1 software and the ATEX software were used to perform the post-processing analysis on the EBSD data (Beausir and Fundenberger, 2017). The post-processing of the obtained data was a one-step grain dilatation function with a threshold of 5°.
3. Result
3.1 Mechanical response of the printed 316L SS
A mapping of the mechanical properties with respect to the used processing parameters and the toughness, yield stress and ductility of the heat-treated components is illustrated in Figure 2. For the tensile stress-strain curves of the printed and heat-treated conditions refer the Figure S1(a)–€ and Table S1 in supplementary material and the reference (Khorasani et al., 2021). Here, the 4D colour maps enable a better overview of the impact of processing parameters on the mechanical performance of the printed parts. The variations of the mechanical properties with respect to the processing parameters in Figure 2(a) can be categorised into three characteristic regions: region (I), having the lowest toughness value at lower laser scan speeds and annealing temperatures; region (II), an increase in toughness with the decreasing scanning pattern angle (two saddle points); and region (III) highest toughness for the LB-PBF product at the fastest scan speeds and highest annealing temperatures. It should be noted that the scanning pattern angle does not remarkably influence region (I) toughness values, while its role is significant at higher annealing temperatures and faster scan speeds (region III). Similar regions can be considered in Figure 2(b), where the laser power is also considered for its role in the toughness values. The laser power can have different roles as it can both enhance and deteriorate the mechanical properties at low values [i.e. comparing regions I and III in Figure 2(b)]. This means that heat treatment temperature, scanning speed and the scanning pattern angle are crucial factors in optimising the properties of the LB-PBF product. For the sake of comparison, a summary of yield stress versus uniform elongation for various 316L SS, including current work, high-performance materials and conventionally processed materials, is provided in Figure 2(c). It can be observed that tensile strength for the LB-PBF products using the optimised condition can provide a significant improvement in strength and ductility compared with previous attempts using the LB-PBF AM technology. A similar simultaneous increase in strength and ductility has been reported through optimisation of laser power in LB-PBF process (Sun, 2019).
 The image features three distinct graphical representations. The first two are three-dimensional surface plots (a and b) that depict relationships among scanning pattern angle, scanning speed, and annealing temperature, represented by a colour gradient indicating toughness in megapascals (MPa). Each graph includes three labeled zones (I, II, III) outlined in ellipses. The colour scale on the right side indicates toughness values ranging from 215 to 343 MPa. The third graph (c) is a scatter plot showing the correlation between tensile strength (in MPa) and elongation percentage. It uses different markers to represent various materials: solid squares for LB-PBF as built, triangles for LB-PBF with heat treatment, filled circles for current work, and open circles for wrought materials. The x-axis spans from zero to one hundred percent for elongation, while the y-axis ranges from two hundred to one thousand MPa for tensile strength, displaying a mix of data points with varying clustering and distribution patterns.
The overall view of (a) the LB-PBF scanning parameters and (b) the overall toughness of the LB-PBF 316L SS and (c) the comparison of the uniform elongation and yield strength for various processed 316L SS from Liverani et al. (2017), Sun et al. (2018), Niendorf et al. (2013), Yadollahi et al. (2015), Chao et al. (2021), Zeng et al. (2021), Zhang et al. (2020), Carlton et al. (2016), Mertens et al. (2014), Agrawal et al. (2021), Hong et al. (2019) and the results obtained in the current work
The image features three distinct graphical representations. The first two are three-dimensional surface plots (a and b) that depict relationships among scanning pattern angle, scanning speed, and annealing temperature, represented by a colour gradient indicating toughness in megapascals (MPa). Each graph includes three labeled zones (I, II, III) outlined in ellipses. The colour scale on the right side indicates toughness values ranging from 215 to 343 MPa. The third graph (c) is a scatter plot showing the correlation between tensile strength (in MPa) and elongation percentage. It uses different markers to represent various materials: solid squares for LB-PBF as built, triangles for LB-PBF with heat treatment, filled circles for current work, and open circles for wrought materials. The x-axis spans from zero to one hundred percent for elongation, while the y-axis ranges from two hundred to one thousand MPa for tensile strength, displaying a mix of data points with varying clustering and distribution patterns.The overall view of (a) the LB-PBF scanning parameters and (b) the overall toughness of the LB-PBF 316L SS and (c) the comparison of the uniform elongation and yield strength for various processed 316L SS from Liverani et al. (2017), Sun et al. (2018), Niendorf et al. (2013), Yadollahi et al. (2015), Chao et al. (2021), Zeng et al. (2021), Zhang et al. (2020), Carlton et al. (2016), Mertens et al. (2014), Agrawal et al. (2021), Hong et al. (2019) and the results obtained in the current work
To analyse the experimental results based on the designed processing parameters, the energy density input was measured. The energy density input from Table S1 is estimated according to the following equation (14):
where PL is the laser power, ν is the scan speed, is absorption ratio (0.3 for stainless steel 316L) and BA is beam area. The calculated values of energy density are presented in the Table S2. It should be noted that the energy density is regarded as a rule of thumb (Prashanth et al., 2017) for evaluating the quality of the built product, namely, the density and mechanical performance. In this regard, melt pool instabilities, such as lack of fusion and void formation, can be avoided when a proper energy density input is selected for the LB-PBF process. In fact, the quality of the built product, namely, the density and mechanical properties, is strongly dependent on the remaining porosity (Gibson et al., 2021). The increase in the build rate requires the highest hatch distance and scan speeds. Therefore, LB-PBF process optimisation needs to tackle the quality of AM products besides increasing the build rate. Figure 3(a) and (b), reveals the as-print build density variations concerning the scanning speed and laser power. The average density of the printed builds is additionally plotted with respect to the energy density (J/mm3) and the corresponding tensile strength and elongation values [Figure 3(c)]. Here, the lower density for laser powers below 150 W suggests local insufficient energy transfer to the powder particles leading to the formation of porosity and voids in the samples. Such behaviour is reflected by a decrease in tensile strength and elongation values for the tested samples [Figure 3(c)]. For a better observation of the experiment intervals a whisker plot is provided in Figure S2. Therefore, a lower bound of 98.8%-part density is considered for the LB-PBF, meaning that laser powers higher than 175 W can be considered as a suitable range for LB-PBF. These process settings correspond to a volumetric energy density of 6.7–14.7 J/mm³, within which the specimens achieved the highest tensile strength and elongation. In this window, the condition printed with a 175 W laser power delivered the best combination of mechanical properties and near-full as-printed density. Accordingly, we selected the 175 W build for detailed analysis to elucidate the origin of the observed property enhancements among all examined conditions.
 The image presents three graphs labeled (a), (b), and (c). Graph (a) shows the relationship between average density, represented as a percentage, and scan speed in millimetres per second, with different symbols indicating varying hatch spacings measured in micrometres. Graph (b) depicts average density against laser power in watts, also using various symbols for hatch spacing. In graph (c), average breaking elongation percentage and average relative density percentage are plotted against energy density measured in joules per cubic millimetre. This graph includes bars for average relative density and average toughness, with distinct markers for average max stress and average breaking elongation. The axes are clearly labeled, with the ranges and increments specified.
Density variations of LB-PBF concerning (a) hatch distance and scan speed, (b) hatch distance and laser power and (c) energy density versus average relative density, breaking elongation, average max stress and average toughness
The image presents three graphs labeled (a), (b), and (c). Graph (a) shows the relationship between average density, represented as a percentage, and scan speed in millimetres per second, with different symbols indicating varying hatch spacings measured in micrometres. Graph (b) depicts average density against laser power in watts, also using various symbols for hatch spacing. In graph (c), average breaking elongation percentage and average relative density percentage are plotted against energy density measured in joules per cubic millimetre. This graph includes bars for average relative density and average toughness, with distinct markers for average max stress and average breaking elongation. The axes are clearly labeled, with the ranges and increments specified.Density variations of LB-PBF concerning (a) hatch distance and scan speed, (b) hatch distance and laser power and (c) energy density versus average relative density, breaking elongation, average max stress and average toughness
3.2 Microstructure evolution
3.2.1 The as-built state
Figure 4 shows the SEM images of the LB-PBF 316L SS specimens before the heat treatment at laser power values between 175 and 250 W. The columnar grains were present in all conditions that crossed several melt pool boundaries and can be attributed to the high thermal gradient in the z-axis (building direction). As illustrated in Figure 4(a)–(f), the size and morphology of the melt pools in the two samples drastically differed, with different laser power inputs showing smaller melt pool boundaries at higher laser powers. It should be noted that the microstructure of the as-built samples did not represent high internal stress development. This may be associated with the preheating procedure of the substrate and the thermal cycles during the LB-PBF process, resulting in an in-situ annealing of the as-printed product. The microstructure analysis of all the LB-PBF conditions indicated a significant abundance of inclusions that formed within the austenite grains. The inclusion size distribution exhibits a bimodal pattern inside the austenite grain structure, and this pattern remains relatively stable despite modifications in the process parameters. The LB-PBF 316L SS has a greater oxygen concentration compared to the wrought counterpart, mostly because of the excessive input of oxygen during powder atomisation and LB-PBF printing (Chao et al., 2017). This condition can promote the formation of very small oxide inclusions, varying in size from micron to nano, containing high levels of Si, Mn and Cr due to the quick solidification in the LB-PBF process. Formation of these inclusions were previously documented in the LB-PBF process of 316L steels and were demonstrated to be precursors of σ-phase development (Chao et al., 2021; Kurzynowski et al., 2018).
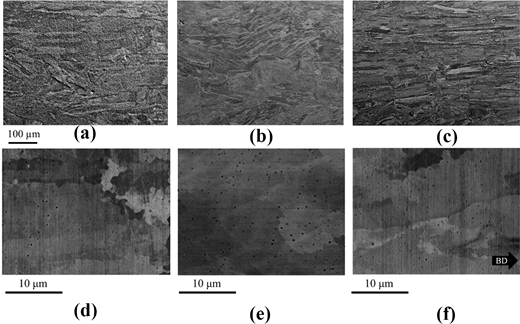
SEM images representing the melt pool boundaries for the LB-PBF samples at (a) 175, (b) 200 and (c) 250 W laser power. The corresponding angular selective backscattered (ASB) images related to samples printed at (d) 175, (e) 200 and (f) 250 W laser power
SEM images representing the melt pool boundaries for the LB-PBF samples at (a) 175, (b) 200 and (c) 250 W laser power. The corresponding angular selective backscattered (ASB) images related to samples printed at (d) 175, (e) 200 and (f) 250 W laser power
3.2.2 Heat-treated microstructures
Samples manufactured by 175 W laser power were considered for analysing the effects of heat treatment on the microstructure evolution (Figure 5). This is mainly due to the lower energy consumption, higher quality of the fused material (i.e. density and porosity values, Figure 3) and enhanced mechanical properties compared to other LB-PBF samples (Figure 2 and Table S1). The microstructure of the as-printed 316L SS did not undergo any significant changes in the inclusions’ characteristics after the stress-relieving treatment at 425°C [Figure 5(a)]. The backscattered electron images displayed these particles as a phase with a dark contrast, primarily found within the austenite grain interior boundaries. Heat treatment at higher temperatures resulted in a slow increase in the size of the inclusions [Figure 5(b)–(e)]. However, the average size is nearly 100 nm for most of the heat treatment conditions. An examination of the inclusion size distribution [Figure 5(f)] shows that the inclusion particles undergo restricted growth as the heat treatment temperatures increase, leading to a bimodal size distribution at 1,050°C [Figure 5(e)].
 The image displays a set of five microscopic images, labeled from (a) to (e), illustrating microstructures at varying heat treatment temperatures of four hundred twenty-five degrees Celsius, six hundred fifty degrees Celsius, eight hundred seventy degrees Celsius, and one thousand one hundred fifty degrees Celsius. Images (a), (b), (c), and (d) show samples with a scale bar of five micrometres, except for image (e), which has a scale bar of two micrometres and indicates a boundary defect (BD) with an arrow. In the lower right corner, a graph labeled (f) presents the distribution of inclusion sizes in micrometres, with the percentage fraction plotted on the vertical axis and the inclusion size on the horizontal axis, providing a visual comparison across different heat treatment conditions represented by distinct colors.
The angular selective backscattered (ASB) images related to samples printed at 175 W laser power and heat treated at (a) 425°C, (b) 650°C, (c) 870°C, (d)–(e) 1,050°C and (f) the inclusion size distribution under selected conditions
The image displays a set of five microscopic images, labeled from (a) to (e), illustrating microstructures at varying heat treatment temperatures of four hundred twenty-five degrees Celsius, six hundred fifty degrees Celsius, eight hundred seventy degrees Celsius, and one thousand one hundred fifty degrees Celsius. Images (a), (b), (c), and (d) show samples with a scale bar of five micrometres, except for image (e), which has a scale bar of two micrometres and indicates a boundary defect (BD) with an arrow. In the lower right corner, a graph labeled (f) presents the distribution of inclusion sizes in micrometres, with the percentage fraction plotted on the vertical axis and the inclusion size on the horizontal axis, providing a visual comparison across different heat treatment conditions represented by distinct colors.The angular selective backscattered (ASB) images related to samples printed at 175 W laser power and heat treated at (a) 425°C, (b) 650°C, (c) 870°C, (d)–(e) 1,050°C and (f) the inclusion size distribution under selected conditions
The EBSD analysis was performed on all three cross-sections (YZ, XZ and XY) of the heat-treated samples at 425°C, 650°C, 870°C and 1,150°C temperatures (Figure 6). Overall, a relatively chaotic configuration of grains consisting of different sizes and shapes is present for both the as-built and heat-treated samples (Figures 4 and 6). The XZ and YZ sections show a bimodal microstructure having columnar grains across the layers parallel to the build direction (BD) and decorated by fine grain structure along the grain boundaries. An interesting observation is the formation of rhombus-shaped grain morphology consisting of fine and large grains along the XZ section in the heat-treated sample. This can be associated with the meander scanning strategy. It is also apparent that the increase in the heat treatment temperature diminished the fine sub-grain structures (i.e. low angle boundaries) and the growth of coarser grains [compare the grain structure in Figure 6(a) with Figure 6(e)]. Heat treatment at the stress-relieving temperature (i.e. 425°C) provides no remarkable changes in the YZ cross-section compared to the as-printed microstructure, revealing a similar <101> texture along the build direction. Although a gradual shift in the grain size can be observed for the heat-treated samples at higher temperatures, the microstructure of the YZ cross-section maintains the dominant <101> texture of the as-printed sample. It should be noted that small bands of <100> oriented grains observed for the as-printed samples are still present in all the heat-treated microstructures. The formation of the <100> bands is associated with the preferential growth of the FCC structured material, making a 45° angle with the <101> planes and forming the observed cell inclination in the XY cross-sections. The cube texture in the microstructure seems to be diminished with the increase in heat treatment temperature, while the <101> along the BD is strengthened.
 The image comprises five three-dimensional cubes arranged in two rows. The top row features three cubes labelled (a), (b), and (c), each showcasing vibrant, multicoloured patterns with significant texture variations and a scale bar indicating a length of seven hundred micrometres on the left of cube (a). The bottom row includes cubes (d) and (e), also demonstrating similar colourful patterns. There is an accompanying illustration on the right side displaying a cube with outlined axes labelled X, Y, and Z, representing orientations, and adjacent to it is a colour gradient triangle with labelled orientation codes for visual reference.
Three-dimensional inverse pole figures of LB-PBFed 316L SS specimens were obtained along the BD for the laser power of 175 in (a) as-built conditions and heat treated at (b) 425°C, (c) 650°C, (d) 870° and (e) 1,150°C
The image comprises five three-dimensional cubes arranged in two rows. The top row features three cubes labelled (a), (b), and (c), each showcasing vibrant, multicoloured patterns with significant texture variations and a scale bar indicating a length of seven hundred micrometres on the left of cube (a). The bottom row includes cubes (d) and (e), also demonstrating similar colourful patterns. There is an accompanying illustration on the right side displaying a cube with outlined axes labelled X, Y, and Z, representing orientations, and adjacent to it is a colour gradient triangle with labelled orientation codes for visual reference.Three-dimensional inverse pole figures of LB-PBFed 316L SS specimens were obtained along the BD for the laser power of 175 in (a) as-built conditions and heat treated at (b) 425°C, (c) 650°C, (d) 870° and (e) 1,150°C
The variation of misorientation angle distribution and internal stress development with the heat treatment temperatures is presented in Figure 7. Upon heat treatment, the columnar austenitic grain morphology remained similar in the as-fabricated microstructure [Figure 6(a)] and heat-treated ones [Figure 6(b)–(e)], while the fraction of low angle boundaries reduced significantly with the increase in heat treatment temperature [Figure 7(a)]. The reduction in the number fraction of low-angle boundaries (i.e. 5° < θ < 15°) is followed by an increase in the high-angle boundaries at higher heat treatment temperatures. This may hint at the occurrence of grain boundary migration and recrystallisation at heat treatment temperatures higher than 425°C (i.e. 650, 870 and 1,150°C). It should be noted that the Σ3 (60°/<111>) boundary fraction is extremely limited in the as-built state while it increases and reaches its maximum at 650°C condition [Figure 7(a)]. It can be observed that the formation of Σ3 is not significantly affected by the heat treatment of the samples as the temperature increases to 1,150°C.
 The first part of the image displays a histogram graph presenting the misorientation angle on the x-axis, ranging from zero to sixty degrees, and the number fraction on the y-axis, ranging from zero to approximately zero point eight four. Six datasets, labelled HT-1150 °C, HT-870 °C, HT-650 °C, HT-425 °C, and As-built, show the distributions of misorientation angle for different heat treatments. The second part of the image contains two colour-coded microstructural images, labelled (b) and (c). Image (b) displays diverse microstructural features in a random pattern, while image (c) includes a label “BD” indicating a boundary, with both images showing colours that represent different structural regions from minimum to maximum values, as referenced in the accompanying legend. The scale bar indicates a length of seven hundred micrometres.
(a) The misorientation angle distribution for different heat treatment routines, (b) the KAM maps corresponding to the heat-treated samples at 425°C and (c) 1,150°C. Here, Kernel maps were calculated concerning all neighbours at 500 nm distance, excluding values above 5°
The first part of the image displays a histogram graph presenting the misorientation angle on the x-axis, ranging from zero to sixty degrees, and the number fraction on the y-axis, ranging from zero to approximately zero point eight four. Six datasets, labelled HT-1150 °C, HT-870 °C, HT-650 °C, HT-425 °C, and As-built, show the distributions of misorientation angle for different heat treatments. The second part of the image contains two colour-coded microstructural images, labelled (b) and (c). Image (b) displays diverse microstructural features in a random pattern, while image (c) includes a label “BD” indicating a boundary, with both images showing colours that represent different structural regions from minimum to maximum values, as referenced in the accompanying legend. The scale bar indicates a length of seven hundred micrometres.(a) The misorientation angle distribution for different heat treatment routines, (b) the KAM maps corresponding to the heat-treated samples at 425°C and (c) 1,150°C. Here, Kernel maps were calculated concerning all neighbours at 500 nm distance, excluding values above 5°
A qualitative understanding of the residual stress distribution within the microstructure can be observed in the kernel average misorientation (KAM) maps in Figure 7(b). KAM maps are generated by averaging the misorientation between a centre pixel (the kernel) and its neighbouring pixels. Then, the generated KAM map exhibits local orientation variations, which are associated with distortions within the lattice structure (i.e. as a result of dislocation accumulation or thermal stresses). The two KAM maps of samples in the heat-treated samples at 425°C and 1,150°C conditions [Figure 7(b) and (c)] reveal that the part heat-treated at 425°C has a higher residual strain compared with the sample heat-treated at 1,150°C. This reduction in local lattice distortion, inferred from KAM analysis, follows the decreasing fraction of low-angle boundaries with increasing heat-treatment temperature [Figure 7(a)]. The higher the heat treatment temperature, the higher the kinetics of grain boundary migration, which reduces the degree of dislocations and strain within the as-built material.
3.2.3 LB-PBF microstructure stability
The assessment of the microstructure and mechanical stability was conducted by considering the effect of annealing temperature on the grain size and tensile properties. The tensile strength increases with heat treatment up to 650°C and then decreases for higher temperatures. For the lower heat treatment regime (<650°C) the grain size changes around ± 5 µm of the as-built microstructure, while for higher temperatures it goes as high as +15 µm for 1,150°C. This increase in the grain size is followed by a reduction in the tensile strength to 910 and 850 MPa for the 870°C and 1,150°C heat treatment temperatures, respectively. Preferential growth of the grains was also witnessed within different sections of the heat-treated samples (Figure 8). As the heat treatment temperature increases, grains along the XZ section tend to grow slower than those along the XY or YZ area, further confirming the preferential growth along <101> occurring during the heat treatment procedure.
 The graph illustrates the tensile strength, measured in megapascals, and the grain area, measured in square micrometres, at different temperature settings: As-built, 425 degrees Celsius, 650 degrees Celsius, 870 degrees Celsius, and 1150 degrees Celsius. The y-axis on the left represents tensile strength, ranging from zero to one thousand megapascal, while the right y-axis shows grain area, ranging from fifteen to forty square micrometres. Three series are plotted: XOY, represented by green squares; YOZ, represented by red circles; and X OZ, represented by blue triangles. The graph features vertical grey bars marking each temperature category, along with error bars indicating variability in data points. The data flows horizontally across different temperature settings, illustrating how tensile strength and grain area change with temperature.
Comparison of the tensile strength and grain size of LB-PBF 316L SS samples in the as-built and heat-treated conditions
The graph illustrates the tensile strength, measured in megapascals, and the grain area, measured in square micrometres, at different temperature settings: As-built, 425 degrees Celsius, 650 degrees Celsius, 870 degrees Celsius, and 1150 degrees Celsius. The y-axis on the left represents tensile strength, ranging from zero to one thousand megapascal, while the right y-axis shows grain area, ranging from fifteen to forty square micrometres. Three series are plotted: XOY, represented by green squares; YOZ, represented by red circles; and X OZ, represented by blue triangles. The graph features vertical grey bars marking each temperature category, along with error bars indicating variability in data points. The data flows horizontally across different temperature settings, illustrating how tensile strength and grain area change with temperature.Comparison of the tensile strength and grain size of LB-PBF 316L SS samples in the as-built and heat-treated conditions
3.2.4 LB-PBF texture evolution
The crystallographic texture development in the build direction is presented in Figure 9. The sample in the as-built condition reveals a weak texture in the (110) and (100) pole figures [Figure 9(a)]. This can be associated with the variation of the scan direction, which influences the heat flow, the complexity of the grain structure and therefore lower overall texture intensity. Previous studies on various scan rotations during LB-PBF also showed a significantly lower overall intensity than the sample produced without scan rotation (Wei et al., 2015; Leicht et al., 2020). The employment of heat treatment at 425°C showed minimal influence on the overall texture intensity [Figure 9(a) and (b)]. As the heat treatment temperature increases to 875°C and 1,150°C, the overall texture shows a preference within the (110) poles [Figures 9(c) and (d)]. It seems that the weak as-printed texture becomes dominant with the increase in the heat treatment temperatures. The heat treatment at 1,150°C had the highest intensity, with an intensity of 9.6 and 5.61 times random for (100) and (110) poles [Figure 9(d)]. Observing the EBSD maps and the pole figures, it is apparent that the random orientation (observed in the colour maps of the as-built microstructures, Figure 9(a) are promoting the weak texture intensity for the as-built, while the preferential grain growth along the < 101> direction results in an increased intensity for the heat-treated samples at 875°C and 1,150°C. The preferential grain growth during the heat treatment has been previously reported in the literature (Salman et al., 2019; La Fé-Perdomo et al., 2023).
 The image features four polar contour plots arranged in two rows and two columns. Each plot is labeled with its respective axes denoting (100) or (110) at the top. The plots illustrate intensity distributions with varying contour lines, indicating different values across the surface. To the right of each plot, a colour scale represents the range of values from minimum to maximum, with the highest and lowest values specified for each plot. The data visualisation is consistent across all plots, providing a clear representation of the spatial dynamics for the specified orientations.
Texture development in the x-transverse direction (TD) and y-build direction plane is represented using (100) and (110) pole figures for the laser power of 175 W and different heat treatment conditions: (a) as-built, (b) 425°C, (c) 870°C and (d) 1,150°C
The image features four polar contour plots arranged in two rows and two columns. Each plot is labeled with its respective axes denoting (100) or (110) at the top. The plots illustrate intensity distributions with varying contour lines, indicating different values across the surface. To the right of each plot, a colour scale represents the range of values from minimum to maximum, with the highest and lowest values specified for each plot. The data visualisation is consistent across all plots, providing a clear representation of the spatial dynamics for the specified orientations.Texture development in the x-transverse direction (TD) and y-build direction plane is represented using (100) and (110) pole figures for the laser power of 175 W and different heat treatment conditions: (a) as-built, (b) 425°C, (c) 870°C and (d) 1,150°C
4. Discussion
It was observed that the employment of different LB-PBF parameters along with scanning strategy and different heat treatment procedures resulted in a significant difference in the grain size and morphology. In parallel, the texture has been strongly influenced by the substructure developed during the heat treatment procedure, resulting in a strong cubic texture for high-temperature treatments while showing random properties in the as-built condition. Such characteristic microstructures significantly improved the mechanical properties related to the grain size effect and dominant deformation mechanism associated with each developed microstructure. These will be discussed in the following.
4.1 The role of grain structure on the mechanical properties
The mechanical property window presented in Figure S1 showed that the material could have ultimate tensile strength (UTS) values as high as 950 MPa for the laser power of 175 W being heat treated at 425–870°C. Compared with the as-built condition, the mechanical properties after the heat treatment show a significant increase which can be attributed to activation of different strengthening mechanisms naming the grain size strengthening (σGB), solid solution strengthening (σSS) and dislocation strengthening (σDis). To define the role of each, the rule of the mixture can be elaborated for each condition:
where is the constant value, which is considered to be approximately 15 MPa as indicated by Nabarro for the austenitic iron (Nabarro, 1997). The grain size values for the material after the heat treatment procedure are relatively higher when compared with the as-built condition (Dwivedi et al., 2024). However, the change in the grain size is not accompanied by the improved mechanical properties of the as-built material. The lower mechanical properties can be influenced by the lack of fusion defects in the as-built material, which are reduced through heat treatment (Malik et al., 2024). However, a deeper understanding of each strengthening factor’s role is required. For different heat treatment regimens, the change in the grain size shows a meaningful trend with the strength of the material; therefore, the grain boundary strengthening (σGB) can be measured using the modified Hall-Petch relation for the materials having bimodal microstructures (i.e. different grain sizes):
where is the strengthening coefficient taken as 452 MPa/μm−1 / 2 (Huang et al., 2011), moreover, , and , in equation (3) are the area fractions and average grain sizes of the small and large grains, respectively; and values of them have been provided in Table 3. In this regard, the yield strength variations associated with the grain-size refinement are measured and presented in Table 3.
The strengthening components of the LB-PBF 316L and the estimated yield strength (yest) compared to the experimental yield strength
| Condition/Temperature | (MPa) | (MPa) | (MPa) | (MPa) | (MPa) | (MPa) | ||||
|---|---|---|---|---|---|---|---|---|---|---|
| As-built | 0.1 | 0.9 | 4.6 | 38 | 15 | 96.6 | 87.06628 | 366.7 | 565.4 | 627 |
| 425 °C | 0.13 | 0.87 | 5 | 45 | 15 | 96.6 | 84.89903 | 333.49 | 530.0 | 772 |
| 650 °C | 0.22 | 0.78 | 7 | 39 | 15 | 96.6 | 94.03957 | 301.14 | 506.8 | 816 |
| 870 °C | 0.22 | 0.78 | 8.4 | 68 | 15 | 96.6 | 77.06424 | 271.12 | 459.8 | 684 |
| 1,150 °C | 0.28 | 0.72 | 9.2 | 73 | 15 | 96.6 | 79.81547 | 264.86 | 456.3 | 649 |
The contribution of solid solution strengthening to the yield strength of steels has been previously studied by the Van-Bohemen expression and was calculated as 96.6 MPa for the 316 L austenitic steel (Van Bohemen, 2018). The Si-rich nanoparticles has been also observed in previous research studies showing a significant contribution to the yield strength of different grades of steels (Cui et al., 2021; Eres-Castellanos et al., 2020; Kusakin et al., 2017). It should be noted that while we do not quantify these nano-inclusions at TEM scale here, similar Si/Mn/Cr-rich oxides and their qualitative effects have been observed and discussed in prior LPBF-316L studies and showed that their contribution is limited to 10–15 MPa in 316L stainless steels (Van Bohemen, 2018; Behjat et al., 2024). Therefore, this has not been considered significant in this study.
The formation of geometrically necessary and statistically stored dislocations can also contribute to the overall strength of the printed alloy. Therefore, the term of the can be attributed to the strengthening effect obtained from dislocation cell structures within the printed material. This term can be easily obtained by calculating the dislocation density from the geometrically necessary dislocation (GND) maps of the EBSD measurements. The calculated dislocation densities for the as-built and heat-treated samples for 475°C, 650°C, 870°C and 1,150°C are 7.8 × 10¹⁴, 6.5 × 10¹⁴, 5.3 × 10¹⁴, 4.3 × 10¹⁴ and 4.1 × 10¹⁴, respectively. The GND maps of the LB-PBF samples are provided in Figure 10(a)–(d). The GND density was calculated using the ATEX software function developed by Agrawal et al. (2021). The portion of the dislocation strengthening can be calculated based on the following equation:
 The image consists of four panels labeled (a), (b), (c), and (d), each displaying similar data patterns against a predominantly blue background. Each panel features a cluster of points or streaks with varying densities and orientations. Panel (d) includes a colour scale bar at the bottom right, indicating numerical values ranging from three times ten to the power of fourteen to nine times ten to the power of fourteen. The scale provides a gradient from light blue to red, with a grey section in between, underscoring a spectrum of data intensity or measurement values corresponding to the visual patterns observed in the panels. Each panel is uniform in size and format, maintaining a consistent layout for comparative analysis.
GND maps corresponding to the IPF maps provided in Figure 7 for (a) as-built and heat-treated samples at (b) 425°C, (c) 870°C and (d) 1,150°C
The image consists of four panels labeled (a), (b), (c), and (d), each displaying similar data patterns against a predominantly blue background. Each panel features a cluster of points or streaks with varying densities and orientations. Panel (d) includes a colour scale bar at the bottom right, indicating numerical values ranging from three times ten to the power of fourteen to nine times ten to the power of fourteen. The scale provides a gradient from light blue to red, with a grey section in between, underscoring a spectrum of data intensity or measurement values corresponding to the visual patterns observed in the panels. Each panel is uniform in size and format, maintaining a consistent layout for comparative analysis.GND maps corresponding to the IPF maps provided in Figure 7 for (a) as-built and heat-treated samples at (b) 425°C, (c) 870°C and (d) 1,150°C
where the M, α, G and b are Taylor factors (i.e. 2.98–3.08 according to the EBSD maps), the magnitude of Burgers vector (b = 0.2546 nm in austenitic steels) and shear modulus (i.e. 73 GPa), respectively (Yin et al., 2019). As shown in Table 3, the obtained from the dislocation strengthening used in the as-built condition is 366.7 MPa and decreases from 264.86 MPa with increasing annealing temperature. As observed, the measured yield strength deviates from the experimental results, which can be attributed to dynamic factors such as the formed precipitates and texture during straining. In this regard, the each will be evaluated for further analysis.
4.2 The role of texture on the mechanical properties
Along with the strengthening achieved through the Hall–Petch grain boundary, the twin boundary formation during the straining, mainly considered as the 60°/<111> misorientation, can significantly affect the strengthening of the FCC structured alloys. This can be associated with the unique characteristics of the LB-PBF material resulting in numerous low and high-angle grain boundaries, which contribute to enhanced ductility and strength (Salman et al., 2019; Leff, 2013; Jørgensen et al., 2017; Chinh et al., 2006; Fri et al., 2023). To investigate the observed discrepancies between the heat treatment procedure and the printed material’s yield strength, the microstructure developed within the materials after the tensile tests were analysed and depicted in Figure 11(a) and (b). Overall, the high strain hardening rate observed in the printed samples is primarily associated with the occurrence of twinning in the FCC material. The difference in the propensity of twinning in the annealed samples can be related to the texture promoting the <112> twinning samples (Kamath et al., 2014; Yan et al., 2014). Considering the Taylor factor maps mentioned for the slip and twinning happening during uniaxial straining, the <111> and <110> orientations are more favourable for twinning rather than the <100> orientations (Hosford, 1993; Farabi et al., 2019).
 The image features two microscopic images arranged side by side. The left image displays a vibrant cross-section with various colorful mineral textures, accompanied by a scale bar indicating a size of forty-five micrometres. Below the left image, there is a small triangular orientation diagram indicating crystal directions, labelled with the terms “001,” “111,” and “101.” The right image displays a similar colorful texture, with a scale bar signifying thirty-five micrometres. This image also contains angular markings suggesting a sixty-degree orientation related to the <111> axis, potentially indicating crystal structure orientations within the viewed samples. Both images showcase intricate details akin to geological or material surface studies.
The relative distribution of deformation twin boundaries in various oriented austenite variants in (a) as built and (b) heat treated at 650°C samples
The image features two microscopic images arranged side by side. The left image displays a vibrant cross-section with various colorful mineral textures, accompanied by a scale bar indicating a size of forty-five micrometres. Below the left image, there is a small triangular orientation diagram indicating crystal directions, labelled with the terms “001,” “111,” and “101.” The right image displays a similar colorful texture, with a scale bar signifying thirty-five micrometres. This image also contains angular markings suggesting a sixty-degree orientation related to the <111> axis, potentially indicating crystal structure orientations within the viewed samples. Both images showcase intricate details akin to geological or material surface studies.The relative distribution of deformation twin boundaries in various oriented austenite variants in (a) as built and (b) heat treated at 650°C samples
The twinning propensity can be observed in Figure 11, where the microstructure of the printed samples was heat-treated to 650°C. Here, the formation of the twins is more prominent along the <111> orientated grains than the <100> grain, which had almost zero twins formed. Besides, the critical nucleation of twins follows the Hall–Petch relationship as the higher yield stress results in higher critical stress for twinning (Meyers and Chawla, 2008). The presence of the cellular structure, which imposes a high density of dislocations, is crucial in suppressing the mechanical twinning initiation. Therefore, for the as-built sample, the higher fraction of low-angle boundaries may resemble a higher resistance for twinning, restricting the nucleation and growth of the deformation twins. As the annealing removes the dislocation density in the sample, a higher propensity for twinning during the straining is expected (Hong et al., 2019). On the other hand, the {111} <110> dislocation slip also occurs for the low stacking fault energy metals at low deformation levels. It is well known that the occurrence of slip can actively reorient the unstable orientations towards the <111> and <100> orientations (Hirsch and Lucke, 1988). This results in a continuous rotation of grains in the low-texture grains towards the easy-to-twin orientations for the annealed samples at lower than 870°C. A continuous region of twin boundaries will tend to form along the dislocation paths with the increased strain levels leading to a dynamic Hall–Petch effect (Grässel et al., 2000).
As observed in Figure 12(a) and (b) the formation of deformation twins can divide the microstructure into <5µm regions which can actively inhibit movement of dislocations and or micro cracks within the printed sample. This ultimately means that heat-treated samples with <101> texture provide a higher potential for achieving a higher strength and fracture strain combination. However, it should be noted that the analysis of tensile fracture surfaces showed the existence of small-sized particles near the small dimples at the fracture surface of as-built 316L SS [Figure 12(c) and (e)]. In contrast, micron-size particles were observed in the material heat treated at 650°C [Figure 12(d) and (f)]. When subjected to tensile deformation, the observed inclusions can lead to local stress concentration and act a suitable region for the formation of voids at austenite grain boundaries which can result in the reduced ductility observed in the 316L SS samples.
 Six scanning electron microscope images arranged in two rows. The first image (a) features deformation twins with a scale bar of 20 micrometres. The second image (b) displays surface details without specific annotations, and each has a scale bar of 5 micrometres. The third (c) and fourth (d) images show complex, textured surfaces with a focus on voids, with the fourth image indicating inclusions. Images (e) and (f) continue this theme, revealing intricate surface structures at 5 micrometres each. The overall composition highlights various microscopic features, visually identified through their arrangement and annotations.
(a) and (b) back-scattered electron images of heat treated at 650°C samples. Fractography of the 316L SS in (c) and (e) as-printed and (d) and (f) after heat treatment at 650°C
Six scanning electron microscope images arranged in two rows. The first image (a) features deformation twins with a scale bar of 20 micrometres. The second image (b) displays surface details without specific annotations, and each has a scale bar of 5 micrometres. The third (c) and fourth (d) images show complex, textured surfaces with a focus on voids, with the fourth image indicating inclusions. Images (e) and (f) continue this theme, revealing intricate surface structures at 5 micrometres each. The overall composition highlights various microscopic features, visually identified through their arrangement and annotations.(a) and (b) back-scattered electron images of heat treated at 650°C samples. Fractography of the 316L SS in (c) and (e) as-printed and (d) and (f) after heat treatment at 650°C
4.3 A brief overview on LB-PBF optimisation advantages of 316L SS
The material properties of additively manufactured components are significantly affected by grain size, texture and the size, distribution and volume fraction of porosity (Ronneberg et al., 2020; Röttger et al., 2016; Carlton et al., 2016; Kazemipour et al., 2019) . The observed fraction is relatively low in the current LB-PBF 316L manufactured parts (i.e. less than 1% for the optimum conditions) and was unaltered by the applied heat treatments (Figure 3) (Tascioglu et al., 2020). Thus, the ductility and strength achieved in the current work can be mainly related to other factors, including coarsening of austenite grains and inclusions or the formation of secondary phases or precipitates and the extent of dislocation density within the built samples. In this study, the optimised condition (175 W) generated a refined austenitic grain, limited porosity and a strong {101} <111> texture aligned along the build direction. Such texture evolution results from directional solidification under steep thermal gradients and cyclic reheating, which stabilises columnar grains and restricts the formation of σ phase. The resultant structure provides improved tensile strength and uniform elongation due to the combined effects of grain refinement, reduced defect density and homogenised elemental distribution (Hsieh and Wu, 2012). Such microstructure characteristics in this study show superior mechanical strength when compared to previous reports on additive manufacturing of 316L stainless steels [i.e. refer to Figure 2(c)] and even duplex stainless steels (Chao et al., 2021; Tasan et al., 2015). However, this combination not only forms a foundation for mechanical performance but also enables improved corrosion performance, since both parameters are strongly governed by grain boundary characteristics and inclusion characteristics.
To achieve optimal mechanical performance from the printed 316L SS in its operational state, it is crucial to select appropriate process parameters and heat treatment procedures (such as stress-relieving or solution treatment) based on the desired yield strength, ultimate tensile strength, ductility and work hardening capability (Greco et al., 2024). Optimising the LB-PBF process parameters revealed that using the meander pattern strategy with a laser power of 175 W and a range of pattern angles, hatch spacing and scanning speeds yields the best microstructures for post-heat treatment routines. The stress-relieving treatment at a temperature of 400°C mostly impacts the yielding strength, whereas the UTS and ductility are minimally affected. At a temperature of 650°C, there is a higher degree of stress relief, as well as an associated increase in elongation, yield strength (YS) and UTS values. This phenomenon has been attributed to the existence of inclusions, as seen in Figures 4 and 5. By increasing the heat treatment temperature to 875°C and 1,150°C, the UTS values gradually decrease, indicating the importance of the coarsening of inclusions. However, achieving a fully stress-relieved state leads to an improvement in the elongation values. It is important to mention that subjecting a material to long-term stress relief and solution treatment at temperatures ranging from 650 to 1,100°C and higher can lead to a decrease in yield strength, tensile elongation and corrosion resistance (Zhou et al., 2020; Kong et al., 2018). This is mostly caused by recrystallisation, grain growth and the enlargement of inclusions.
Besides the mechanical performance, the corrosion resistance of LB-PBF 316L stainless steel is intrinsically governed by its unique non-equilibrium microstructure, which has significantly different characteristics from its wrought counterpart (Haghdadi et al., 2021). In this study the as-built microstructure, characterised by a cellular sub-grain structure bounded by a network of low angle grain boundary (LAGBs) with a limited fraction of Σ3 annealing twins, can be inherently resistant to intergranular corrosion. This is not just a correlation, as it is a direct consequence of the limited diffusion pathways along these low-energy interfaces. It should be noted that the beneficial effect of low-angle boundaries in the as-built state is twofold. They are associated with lower stored strain energy compared to random high-angle boundaries and the cellular boundaries themselves are often enriched with Mo and Cr oxides, enhancing passivation (Laleh et al., 2021; Kong et al., 2024). The effect of heat treatment is complex and depends on the temperature regime. The observed decrease in low-angle boundary density during annealing in the 650–870°C range is a signature of recovery and recrystallisation. While this can diminish the dislocation-driven micro-galvanic heterogeneities, it also breaks down the cellular structure and eliminates the beneficial Mo/Cr-enriched sub-grain boundaries (Laleh et al., 2021). Furthermore, exposure in this intermediate temperature range is where the risk of detrimental phase precipitation (e.g. M23C6 carbides, σ phase) is highest (Laleh et al., 2021; Ni et al., 2018). Therefore, its advantages are dependent on the heat treatment successfully relieving residual stress without stimulating the precipitation at random high-angle boundaries.
The crystallographic texture also plays a decisive role in pitting resistance. The dissolution kinetics of austenitic stainless steels are highly orientation dependent. Close-packed {111} planes, with their higher atomic coordination and density, promote the formation of a more stable and protective passive film, leading to slower dissolution rates (Wei et al., 2022; Ma et al., 2025). In contrast, the more open {100} planes are inherently less stable and more prone to film breakdown. The <110> and <101> texture components typically developed in optimised LPBF 316L, often associated with the melt pool geometry and competitive grain growth, effectively increase the probability of {111}-oriented grains intersecting the exposed surface. This texture strengthening, by favouring the exposure of corrosion-resistant crystallographic planes, directly contributes to a higher pitting potential compared to a strongly <100>-fibered texture common in some other processing routes. Together, these characteristics promote a microstructure that can potentially enhance both mechanical and corrosion resistance for AM 316L alloys.
5. Conclusion
This study presents an algorithm that effectively determines the best LB-PBF processing and post-heat treatment parameters for producing 316L stainless steels with reduced energy consumption and improved characteristics. The Taguchi design of the experiment was elaborated to reduce the time and cost of the experiments for identifying a wide range of LB-PBF process parameters. The LB-PBF was conducted in a range of 150–250 W laser power with changing scanning speeds and angles. Then, using various microstructure characterisation techniques, the role of heat treatment on the mechanical at the temperature range of 425–1,150°C was investigated. The main finding of the current study can be summarised as follows:
The multi-objective optimisation of the suitable LB-PBF revealed the 175 W as the optimised region with the highest mechanical properties. The obtained experimental results displayed low energy densities of 6.7 J/m3 to 14.7 J/m3 within the laser power range and were capable of producing parts with a relative mass density of 98.8% or higher.
Heat treatment was shown to have the most decisive influence on the mechanical properties compared to the process parameters. The maximum tensile properties were achieved for laser powers of 175 and heat treatment at 870°C with tensile strength up to 970 MPa and elongations of approximately 32%, while these values were between 700 and 900 MPa and 20%–30% for the as-printed parts, respectively.
The microstructure of heat-treated samples had a complex grain configuration with different sizes and shapes. The heat treatment resulted in grain growth from approximately 20 μm up to approximately 45 μm for temperatures of 425°C and 1,150°C, respectively. However, the grains tend to grow at various rates at higher heat treatment temperatures (i.e. > 650°C) leading to anisotropic microstructures on different sections of the printed material.
The increase in the heat treatment temperature resulted in the preferential growth of <110> grains and the disappearance of <100> grains in the as-built condition. This led to the dominance of <110> orientations at higher heat treatment temperatures and subsequent preference for mechanical twinning during tensile straining.
The analysis of microstructure using the Hall-Petch relationship shows that dislocation strengthening and grain boundary strengthening had a major role in the mechanical properties of the as-built material. However, heat treatment at temperatures higher than 650°C and grain reorientation to <110> components promoted mechanical twinning and dynamic Hall–Petch effect, increasing printed material’s strength and ductility.
References
Supplementary material
The supplementary material for this article can be found online.

