


This novel study quantifies and correlates the mechanical properties of 17-4PH and H-13 parts produced by bound metal deposition (BMD) with their corresponding composition, internal microstructure and metallurgical features. The purpose of this study is to establish a predictive understanding of how BMD process parameters influence the final properties of these critical tooling materials.
Specimens of 17-4PH (AISI 630) and H-13 (AISI H13) steels were fabricated using a BMD printer and sintered according to the equipment manufacturer’s standard process parameters. The resulting parts were then subjected to comprehensive characterisation, including optical and scanning electron microscopy, energy-dispersive X-ray spectroscopy, tensile and hardness testing, and quantitative metallography, to evaluate their mechanical properties and microstructural features.
17-4PH and H-13 specimens exhibited significantly different yield, tensile and hardness values. Microstructural analysis revealed substantial differences in internal structure. As-sintered 17-4PH parts showed a large internal hollow space, indicating incomplete densification. H-13 parts displayed a homogenous microstructure with an insignificant inner cavity. Metallurgical details and hardness variations are reported.
These findings enable AM manufacturers to strategically select 17-4PH or H-13 for tooling, spares and prototype applications, facilitating the production of components with tailored mechanical performance through optimised BMD processing.
This work provides AM manufacturers with novel knowledge to best select 17-4PH or H-13 manufactured by AM for tooling applications, mainly for the automotive industry, facilitating the production of components with tailored mechanical performance through optimised BMD processing.
Introduction
Additive manufacturing (AM), commonly known as 3D printing (ISO/ASTM International, 2015), has become a prominent manufacturing process. Unlike traditional subtractive processes, AM adds layers of fluid or powder material on top of each other to create the final product (Diegel et al., 2019). Significant benefits of manufacturing parts with AM in the industrial sector include lower costs, faster implementation and more efficient resource utilisation.
Initially, AM research and development focused on sectors such as aerospace, medicine, transportation, energy and consumer products. More recently, AM has gained a significant role in the automotive industry, integrating these processes into daily operations (Yi et al., 2019). While various polymer AM technologies exist, with multijet fusion (MJF) systems specifically documented for integration into automotive production lines (Atzeni et al., 2024), plastics remain prevalent. However, metal and ceramic materials are now essential to the AM portfolio, supported by a range of main metal AM technologies. Comprehensive overviews of metal AM techniques and emerging research are available (Armstrong et al., 2022). These studies highlight that technology selection for manufacturing facilities is critical to meet performance, cost and timing needs (Patil et al., 2023).
AM technologies offer substantial potential within the automotive industry, with numerous applications and benefits (Vasco, 2021). Specific metal AM application materials and processes for manufacturing tooling have been summarised (Asnafi, 2021). Based on growing knowledge in the field, a recently increasing bibliography exists on the advantages and drawbacks of different metal AM technologies in the automotive sector (Leal et al., 2017; Sarzyński et al., 2024). This gap persists even with ongoing research projects involving academic and industrial partners from the German commercial vehicle industry (Yi et al., 2019).
The best-suited applications for AM in the automotive manufacturing industry are machine spares, equipment tooling, new product prototypes, and, in some cases, serial manufacturing parts (Ngo et al., 2018). There are numerous successful examples in these areas, often utilising filament deposition modelling (FDM), stereolithography, continuous filament fabrication, and MJF equipment. These applications have demonstrated average savings of 75%, lead times under 24 h and weight reductions up to 95%, with a significant impact on environmental sustainability (Ahn, 2016). However, when metal AM comes into play, there are big questions on the best technology to use from properties, return on investment and lead time points of view (Pérez-Ruiz et al., 2021). Previous studies on AM applications in the automotive industry have shown potential in stamping and casting tooling (Asnafi, 2021; Leal et al., 2017). In addition, recent software development has brought numerous applications to market, making 3D model design easier and quicker, thereby speeding up the launch of new products. Further technologies, such as direct energy deposition (DED) (Ahn, 2016; Dávila et al., 2020) and MBJ (Masood and Song, 2004; Zhao et al., 2023) have been recently finding their space.
The metallic materials used in the manufacturing industry vary widely across facilities, with 17-4PH and H-13 being mostly used for tooling, spares, and high-resistance applications. Most metal AM manufacturers use these two materials, and they play a very important role in the automotive industry. Bound metal deposition (BMD), for example, includes them as common materials in its portfolio. 17-4PH is a hard tool corrosion-resistant steel commonly known as AISI 630, and H-13, also known as AISI H13, is a hot work steel with high hardening capabilities. Experimental studies were conducted using selective laser melting technology on 17-4PH stainless steel (Andreacola et al., 2023) and on H-13 for injection moulding tools (Mazur et al., 2016).
In this study, sample parts made using the BMD process with these two materials underwent microscopy, spectroscopy, stress, hardness and metallographic analysis to assess their mechanical properties and identify any significant differences. The findings in this paper provide additional knowledge of the mechanical properties of AM-produced 17-4PH and H-13 parts. This research supports industrial manufacturers’ decisions on which two materials to use, when, and which sintering oven controls to use, ensuring the right outcome for the application. Further research is being conducted to gain a deeper understanding of the influence of sintering oven controls on mechanical properties.
Table 1 presents the main metal AM technologies, highlighting their advantages and disadvantages. This summary is based on years of experience in experimental and practical work at an automotive manufacturing plant and from authors in the field who have published key research on each technology. In a comprehensive textbook, Gibson provided detailed information on the main metal AM technologies with applications in the automotive industry (Gibson et al., 2021). For example, on PBF, some authors have explored computational methods and the potential of AM to create alloys with unique microstructures and high performance (King et al., 2015; Wang et al., 2018). There is an extensive bibliography on DED, including significant applications, such as part repairs and subtractive manufacturing (Ahn, 2016; Dávila et al., 2020; Pattanayak et al., 2024; Prakash and Kore, 2024). Metal FDM (MFDM) authors have highlighted automotive applications and filament optimisation studies (Liu et al., 2020; Rodríguez-Alvarez et al., 2024). There is very little research on BMD on specific material applications (Luchinsky et al., 2022). Finally, MBJ research underscores the significant emerging potential of this technology for automotive applications (Li et al., 2020; Masood and Song, 2004; Zhao et al., 2023). All these technologies compete in the market, each with its own reach, advantages and disadvantages (Table 1).
Leading metal AM technologies with applications in the automotive industry and summary of each technology’s main characteristics, advantages and disadvantages based on experimental and practical work within an automotive manufacturing plant
| Entry order | Technology | Advantages | Disadvantages |
|---|---|---|---|
| 1 | Powder bed fusion (PBF) | High accuracy, complex parts | High costs, safety considerations |
| 2 | Direct energy deposition (DED) | Large size, high printing speed | Low printing accuracy |
| 3 | Metal filament deposition modelling (MFDM) | Simple process, low costs | Long lead times, delicate handling |
| 4 | Bound metal deposition (BMD) | No supports needed, safe handling, competitive costs | Small parts, slow and medium accuracy |
| 5 | Metal binder jetting (MBJ) | High accuracy and productivity | High investment and labour costs |
BMD is a suitable entry-level option for automotive manufacturing facilities in metal AM (Ortiz-Cañavate et al., 2024), enabling the production of parts with competitive quality and shorter production lead times. It is a solution based on MFDM (Basak et al., 2023), where instead of a filament, raw materials are rod bars that are melted to produce a variable-diameter source of material, creating the green part by adding layers of material (Luchinsky et al., 2022). An AM green part is a mechanically fragile component formed by the layer-wise deposition of a mixture of metal powder and binder material into the desired shape, prior to sintering. The two options for polymer removal are heating in the oven before the sintering cycle or in a separate acid container. The final dimensions of the parts achieve a ±0.5 mm accuracy, and the quality is comparable to that of parts produced by traditional casting and subtractive processes. In this paper, BMD technology was selected to study the as-sintered properties of parts manufactured with 17-4PH and H-13 materials. As-sintered parts are components that have undergone sintering, transforming from their green state into dense metallic structures with developed mechanical and physical properties.
Material, equipment and methods
The metal AM equipment used for this research was a Desktop Metal Studio 2 BMD AM System consisting of two printers and one furnace, manufactured in 2020.
Several key software solutions utilised for this work were included in this research. Autodesk Inventor (Autodesk, Inc.) and SolidWorks (Dassault Systèmes SolidWorks Corp) were used for 3D model creation and optimisation. Magics (Materialise NV) software prepared the printing model. Printer jobs management and part volume calculations were performed with 3YourMind (3YOURMIND GmbH) software. Cost data were collected using a locally developed software application based on the digital tools mentioned above. This whole array of Information Systems software packages was fundamental to achieving the results of this work.
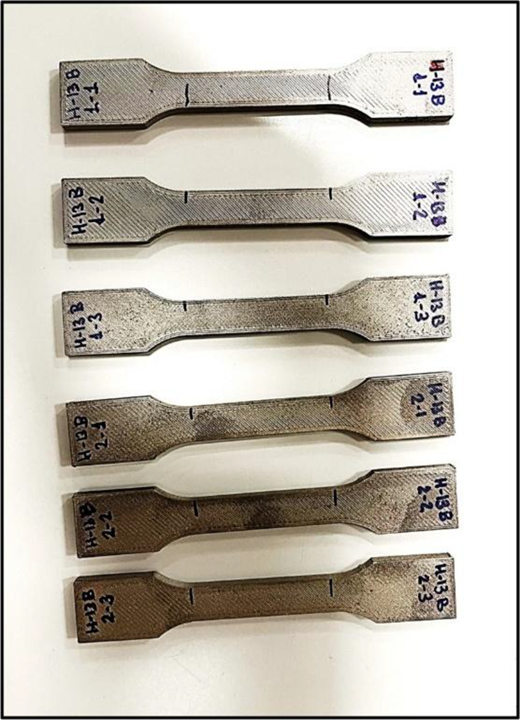
For this study, two batches of six specimens for each of the two materials were produced according to the process parameters defined by the equipment supplier (Table 2). Sample dimensions were Lt = 95 mm, L0 = 35 mm, b0 = 8 mm and a0 = 3 mm, according to the International Organisation for Standardisation (ISO, 2019) (Figure 1). Of these 24 parts, one part from the first batch and two from the second batch of each material were selected to conduct mechanical and visual tests. The small sample size was a practical constraint due to the capacity limitations of producing and measuring large batches of identical specimens. Numerous measures were taken to compensate for the small sample, including controlling process parameters, ensuring high measurement reliability with recently calibrated equipment, and utilising sophisticated statistical techniques. Green parts, also known as as-printed parts, were manufactured with the exact same dimensions, including an internal lattice, according to the equipment manufacturer’s software. This inner filament structure was required to allow better binder removal. Consequently, three specimens were tested for tensile properties to determine yield and tensile strengths. These data were acquired using Universal measurements electromechanical equipment ELIB 30 Ibertest (S.A.E. Ibertest, Madrid, Spain), with a 50 kN force cell (Figure 2)
Equipment, software and sintering parameters used to manufacture samples using the BDM process
| Parameter | Value | |
|---|---|---|
| Equipment | DM Studio 2 | |
| Material | 17-4PH | H-13 |
| Software | Live SuiteTM | |
| Layer thickness (mm) | 0.2 | |
| Layer thickness of the first layer (mm) | 0.2 | |
| Outer/inner printing speed (mm/s) | 15 | |
| Green part mass (g) | 53 | |
| Finished part mass (g) | 24 | |
| Sintering ramp one | 1100°C for 1 h | |
| Sintering ramp two | 1300°C for 2 h | 1325°C for 2 h |
| Sintering pressure set point | Best vacuum | |
| Sintering atmosphere | Ar with 3% H | Ar 100% |
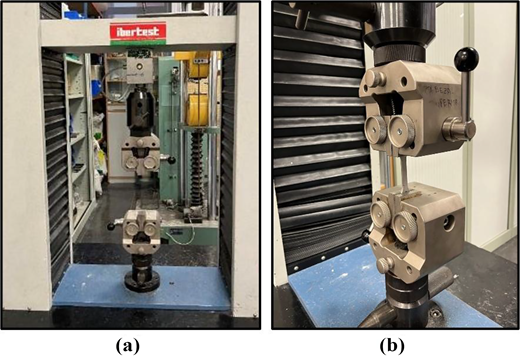
(a, b) Universal measurements electromechanical equipment used for yield and tensile strength measurement
Source: Author’s own work
(a, b) Universal measurements electromechanical equipment used for yield and tensile strength measurement
Source: Author’s own work
Following stress testing, three specimens from each of the 17-4PH and H-13 materials were marked. These marks were placed at set, evenly spaced locations on the surface to facilitate hardness measurements. Measuring points were distributed in 18 horizontal and 3 vertical positions. Thirty-four hardness measurements per part were acquired using a hardness tester model Testor from Instron Wolpert (Darmstadt, Germany). The Vickers Hardness Test (HV10), conducted according to ISO 6507 (2023), was employed. This method was chosen to align with previous studies by other authors (Zuback and DebRoy, 2018) to cover the range of materials used in this study and ensure consistent measurements, even for parts with internal cavities.
Once tensile strength and hardness tests were completed on three parts each, samples of each material were prepared from specimens for further metallographic analysis. Specimens were sectioned, mounted, ground, polished and etched in accordance with ISO/TR 20580 (2022). Specimens were produced using Struers Polifast resin, a commonly used resin in electron microscopy. Grinding was conducted in two sanding stages, first with 500-grit and then with 1000-grit sandpaper. Subsequently, polishing was performed first with a 6-micron polishing cloth and then with a 1-micron one. Test samples were viewed using a metallographic microscope Olympus BX 51M, and a Stereo Microscope Zeiss Discovery V-8 to determine the material’s metallographic characteristics.
Results
Table 3 summarises the material composition measured with scanning electron microscopy (SEM) for 17-4PH and H-13 specimens. The elements’ percent content aligns well with the ISO (2018, 2025) and the material data sheets (MDSs) provided by the material supplier (BMD Equipment Co., 2026a, 2026b). There were, however, minor deviations between the measurements and the specifications.
Material composition taken from spectrographs measured with a scanning electron microscope (SEM) from JEOL JSM-5310 with an Oxford Instruments Xplore 30 X-Ray beam and AZTEC Material Composition Analysis Software
| 17-4PH | H-13 | |||||
|---|---|---|---|---|---|---|
| Standard name | AISI 630 | AISI H13 | ||||
| Description | Hard tool stainless steel | High resistance hot work steel | ||||
| Material [% in weight] | SEM | ISO 15608:2025 | MDS | SEM | ISO 4957:2018 | MDS |
| Fe | 73.7 | balance | balance | 91.0 | balance | balance |
| Cr | 16.3 | 15.0–17.5 | 15.0–17.5 | 6.2 | 4.8–5.3 | 4.75–5.50 |
| Ni | 4.7 | 3.0–5.0 | 3.0–5.0 | 0 | 0 | 0 |
| Cu | 3.1 | 3.0–5.0 | 3.0–5.1 | 0 | 0 | 0 |
| V | 0 | 0 | 0 | 1.5 | 0.8–1.2 | 0.8–1.2 |
| Si | 1.1 | 1.0 max | 0 | 1.3 | 0.8–1.2 | 0.8–1.2 |
| Mn | 1.0 | 1.0 max | 1.0 max | 0 | 0.2–0.6 | 0.2–0.6 |
| Nb + Ta | 0 | 0.15–0.45 | 0.15–0.45 | 0 | 0 | 0 |
| Mo | 0 | 0.50 max | 0 | 0 | 1.0–1.3 | 1.10–1.75 |
| C | na(1) | 0.07 max | 0.07 max | na(1) | 0.35–0.45 | 0.32–0.45 |
| P | 0 | 0.04 max | 0 | 0 | 0 | 0.03 max |
| S | 0 | 0.03 max | 0 | 0 | 0 | 0.03 max |
na(1) refers to C content not measured in this study
For example, the silicon (Si) content was measured at 1.1% for 17-4PH (Table 3), whereas ISO (2025) and MDS indicated a maximum of 1.0% or no presence of this element. niobium (Nb) and tantalum (Ta) were specified at a minimum of 0.15%; however, these elements were not identified during the measurements. The comparison of 17-4PH measurements against the norm and MDS was well within the limits, except for Nb and Ta, where no presence was detected. The slightly higher Si content and the absence of Nb and Ta compensated for the effect of each variation, resulting in measurements within specification (Chen et al., 2024).
For H-13, the ISO (2018) and the supplier’s MDS indicated a chromium (Cr) content between 4.8% and 5.5%. However, half of the measurements exceeded this specification, yielding Cr levels of 5.6% and 6.2% Cr, respectively. In addition, H-13 specifications for vanadium (V) and Si ranged nominally from 0.8% to 1.2%. Measurements in this study, however, resulted in values between 1.3% and 1.5%. H-13 measurements exhibited the same discrepancies with the ISO (2018) norm as those with MDS, with Cr, V, Si and Mn exceeding the limits. A higher content of these elements would imply increased material hardness and strength (Gulten et al., 2025).
Several authors have conducted stress–strain tests with metal AM materials (Huang et al., 2023) and, more specifically, 17-4PH (Jones et al., 2023; Lavecchia et al., 2023). Other studies have used a mechanistic data-driven framework to predict location-dependent mechanical properties of fabricated parts (Xie et al., 2021).
As shown in Table 4 and Figure 3(a) and (b), tensile strength averaged 724.2 MPa for 17-4PH, while it was 1045.4 MPa for H-13. This meant that H-13 material had a 44% higher tensile strength than 17-4PH. Supplier MDSs for as-sintered parts stated that 17-4PH achieved a nominal tensile strength of 1065 MPa, 32% higher than the measured value, while H-13 specified 1700 MPa, 39% higher (BMD Equipment Co., 2026a, 2026b). In addition, MDSs stated that H-13 had a tensile strength 60% higher than that of 17-4PH. On the other hand, ISO (2025) specified that AISI 630 in the H1150-M condition achieved a tensile strength of 790 MPa, which was 9% higher than the measured value. Also, ISO (2018) H-13 in quenched and tempered condition stated a tensile strength of 1200 MPa, which was 15% higher than the values obtained. Furthermore, yield strength tests on 17-4PH yielded 575.4 MPa, while H-13 was 827.5 MPa. Again, and in line with tensile strength results, H-13 had 44% higher yield strength than 17-4PH. Comparing with supplier MDSs, 17-4PH should have achieved 885 MPa and H-13 1370 MPa; which meant that H-13 should have had 55% more yield strength than 17-4PH (Table 4, Figure 3). ISO (2018, 2025) specified a yield strength for 17-4PH of 515 MPa, which was 10% higher and 1000 MPa 17% for H-13. Specified values by supplier MDSs differed from the results by 30%–40%, while ISO norms varied by 10%–20%. Measured values deviated from both norms and supplier MDS, indicating that an AM condition differs from the quenched and tempered condition specified.
Mechanical test results, including tensile properties and hardness. Data averages and 95% confidence intervals for the mean (95% CI) were calculated from the total measuring points (34) of each specimen
| Material | Batch | Part | Tensile strength (MPa) | Yield strength (MPa) | Hardness (HV10) | |
|---|---|---|---|---|---|---|
| Mean | 95% CI | |||||
| 17-4PH | 1 | A | 725.3 | 545.5 | 325 | [321, 328] |
| 2 | B | 723.6 | 623.4 | 314 | [308, 321] | |
| 2 | C | 723.8 | 557.2 | 317 | [313, 321] | |
| Average (avg.) | 724.2 | 575.4 | 319 | [316, 321] | ||
| H-13 | 1 | D | 1008.0 | 689.4 | 511 | [502, 519] |
| 2 | E | 1064.8 | 891.8 | 431 | [411, 452] | |
| 2 | F | 1063.3 | 901.3 | 375 | [356, 395] | |
| Average (avg.) | 1045.4 | 827.5 | 439 | [425, 454] | ||
 The graph in panel a plots stress in megapascals against elongation in per cent for 17-4 P H samples A, B, and C. The horizontal axis ranges from 0 to 20 per cent, and the vertical axis ranges from 0 to 1200 megapascals. The three curves rise gradually before reaching a plateau near the tensile region. The average yield strength is 575.4 megapascals, and the average tensile strength is 724.2 megapascals. Sample A, sample B, and sample C follow similar trends, with sample B reaching the plateau at the lowest elongation and sample A at the highest elongation. Panel b plots stress in megapascals against elongation in per cent for H-13 samples D, E, and F. The horizontal axis ranges from 0 to 20 per cent, and the vertical axis ranges from 0 to 1200 megapascals. The three curves increase almost linearly before peaking and then dropping near the highest elongation. The average yield strength is 827.5 megapascals, and the average tensile strength is 1045.4 megapascals. Sample D, sample E, and sample F closely overlap throughout the loading stage, with peak stresses occurring at approximately 17 per cent elongation.
(a, b) 17-4PH versus H-13 stress versus elongation measurements
Source: Author’s own work
The graph in panel a plots stress in megapascals against elongation in per cent for 17-4 P H samples A, B, and C. The horizontal axis ranges from 0 to 20 per cent, and the vertical axis ranges from 0 to 1200 megapascals. The three curves rise gradually before reaching a plateau near the tensile region. The average yield strength is 575.4 megapascals, and the average tensile strength is 724.2 megapascals. Sample A, sample B, and sample C follow similar trends, with sample B reaching the plateau at the lowest elongation and sample A at the highest elongation. Panel b plots stress in megapascals against elongation in per cent for H-13 samples D, E, and F. The horizontal axis ranges from 0 to 20 per cent, and the vertical axis ranges from 0 to 1200 megapascals. The three curves increase almost linearly before peaking and then dropping near the highest elongation. The average yield strength is 827.5 megapascals, and the average tensile strength is 1045.4 megapascals. Sample D, sample E, and sample F closely overlap throughout the loading stage, with peak stresses occurring at approximately 17 per cent elongation.(a, b) 17-4PH versus H-13 stress versus elongation measurements
Source: Author’s own work
During testing, both materials fractured at similar elongation values, ranging from 15% to 18%. Specifically, 17-4PH broke at an average of 16.5%, while H-13 did so at 16.8%. Supplier MDSs stated that 17-4PH fractured at 6.2% and H-13 broke at 2.8%. According to ISO (2018, 2025) norms, the elongation at breakage was 18% for 17-4PH and 15% for H-13. The material’s elongation performance was very similar to the norm, but quite different from that of the supplier’s MDSs. Figure 3(a) and (b) shows the ductile performance of 17-4PH, while H-13 fractured in a brittle manner very close to its tensile limit.
Hardness values for 17-4PH were significantly lower than H-13 (Figure 4). Tests on 17-4PH averaged 319 HV10, while H-13 yielded 439 HV10. This meant that H-13 showed an average hardness 38% higher than 17-4PH. Supplier MDSs indicated 27 HRC for 17-4PH and 46 HRC for H-13 (BMD Equipment Co., 2026a, 2026b). The HV10 equivalence for these specifications was 262 HV10 for 17-4PH and 458 HV10 for H-13. This indicated a significantly higher hardness for H-13, specifically 75% more. ISO (2018, 2025) norms indicated 275–300 HV10 for 17-4PH and 400–600 HV10 for H-13. Again, the measured results aligned well with norms but deviated from MDSs.
 The horizontal axis compares 17-4 P H and H-13, and the vertical axis shows hardness in H V from 300 to 460. The 17-4 P H bar records a mean hardness of approximately 319 H V, with a 95 per cent confidence interval extending from approximately 316 to 322 H V. The H-13 bar records a mean hardness of approximately 440 H V, with a 95 per cent confidence interval extending from approximately 425 to 454 H V. Individual standard deviations calculate the confidence intervals.
Hardness comparison between 17-4PH and H-13
Source(s): Author’s own work
The horizontal axis compares 17-4 P H and H-13, and the vertical axis shows hardness in H V from 300 to 460. The 17-4 P H bar records a mean hardness of approximately 319 H V, with a 95 per cent confidence interval extending from approximately 316 to 322 H V. The H-13 bar records a mean hardness of approximately 440 H V, with a 95 per cent confidence interval extending from approximately 425 to 454 H V. Individual standard deviations calculate the confidence intervals.Hardness comparison between 17-4PH and H-13
Source(s): Author’s own work
Hardness measurements revealed significantly lower hardness variability for 17-4PH compared to H-13 (Figure 4). In this case, 17-4PH had a 95% CI width of 5 HV10, while H-13 was 480% higher with 29 HV10 (Table 4). In addition, statistical analysis of hardness measurements for 17-4PH indicated a significant normal distribution, whereas those for H-13 did not.
No significant hardness differences were observed for 17-4PH across the sintering furnace batch sequence. However, H-13 showed a very significant difference in hardness between the first and second batches. In this case, for H-13, the average hardness was 511 HV10 for the first batch (part D, Figure 4), while for the second batch (parts E and F), it was reduced to 403 HV10 (Table 4). This batch-related hardness issue has been observed by the AM team since 2022 in H-13 fabrications processed with the BMD process. The latest tests investigating this issue revealed that it consistently occurred when using the carbon sintering case (retort) for the first time during H-13 sintering. These hardness values above the norm appeared to be related to additional carbon transfer to the parts’ surfaces during sintering. After this first sintering batch, retorts lost the ability to produce this excessive carbon transfer to the components. Further tests are being conducted to understand and potentially control this phenomenon.
Fracture areas pictures (Figure 5(a) and (b)) and SEM specimen images (Figure 5(c) and (d)), taken with 10× magnification for complete comparison, showed very different appearances for the two materials. The 17-4PH specimen break area (Figure 5(a)) exhibited a characteristic aspect with two distinctly different surfaces. The external area, which had an approximate thickness of 2 mm, was solid and exhibited a homogeneous, matte appearance (Rafi et al., 2014). At the same time, cavities within the internal area had an appearance similar to the internal lattice structure of the green parts, with some of the original filament shapes still visible. On the other hand, fracture sections of the H-13 test parts (Figure 3(b)) exhibited an homogeneous single, shiny and rough surface with a single internal cavity. The incomplete densification observed with 17-4PH (Figure 5(a) and (c)), but not with H-13 (Figure 5(b) and (d)), remains not fully understood, despite collaboration with the equipment manufacturer. Note that the original green parts of both 17-4PH and H-13 were produced with the same size and internal lattice structure before being furnace-sintered. The internal area of 17-4PH specimens had a metallographic structure with well-formed grains of martensite within retained austenite, where the structure seemed not to be fully sintered [Figure 5(a)]. Other authors had already observed this type of structure in AISI 630 when subjected to ageing treatment at 1150°C for 4 h in samples processed via fused filament fabrication (Pellegrini et al., 2023). In H-13, a martensitic structure predominated, with precipitates within the grain due to the various alloying elements (Figure 5(b) and (d)). This structure was homogeneous across the whole section. Some authors studied the capabilities and challenges of major solid-state metal AM techniques by dividing them into two broad categories, plastic deformation-based and sinter-based, depending on the metallurgical bonding mechanisms, range of processible alloys and resulting microstructures (Tuncer and Bose, 2020).
 The panels compare 17-4 P H and H-13 specimens across successive examination stages. Panel a shows the fracture area optical view of the 17-4 P H specimen with an irregular fractured surface and two prominent cavities, and panel b shows the H-13 fracture area optical view with a rough fractured surface and a central elongated cavity. Panel c shows the prepared 17-4 P H section for microscopic and S E M analysis with increased magnification, and panel d shows the corresponding H-13 section. Panel e shows the external 17-4 P H specimen area at 50 times magnification with a cellular microstructure, and panel f shows the external H-13 specimen area at 50 times magnification with scattered pores and a linear row of rounded defects. Panel g shows the external 17-4 P H specimen area at 200 times magnification with large polygonal grains, and panel h shows the external H-13 specimen area at 200 times magnification with a fine lath like microstructure and scattered pores. Panel i shows the internal 17-4 P H specimen area at 200 times magnification with finer polygonal grains, and panel j shows the internal H-13 specimen area at 200 times magnification with a similar lath like microstructure and isolated pores. Panel k shows the external 17-4 P H specimen area at 500 times magnification with enlarged polygonal grains, and panel l shows the external H-13 specimen area at 500 times magnification with numerous rounded pores distributed throughout the matrix. Panel m shows the internal 17-4 P H specimen area at 500 times magnification with polygonal grains and small pores, and panel n shows the internal H-13 specimen area at 500 times magnification with a lath like matrix containing rounded pores and larger voids. Scale bars indicate 1 millimetre in panels a through d, 200 micrometres in panels e and f, 50 micrometres in panels g through j, and 20 micrometres in panels k through n.
(a–n) Optical, microscopic and SEM pictures of 17-4PH versus H-13 specimen sections
Source(s): Author’s own work
The panels compare 17-4 P H and H-13 specimens across successive examination stages. Panel a shows the fracture area optical view of the 17-4 P H specimen with an irregular fractured surface and two prominent cavities, and panel b shows the H-13 fracture area optical view with a rough fractured surface and a central elongated cavity. Panel c shows the prepared 17-4 P H section for microscopic and S E M analysis with increased magnification, and panel d shows the corresponding H-13 section. Panel e shows the external 17-4 P H specimen area at 50 times magnification with a cellular microstructure, and panel f shows the external H-13 specimen area at 50 times magnification with scattered pores and a linear row of rounded defects. Panel g shows the external 17-4 P H specimen area at 200 times magnification with large polygonal grains, and panel h shows the external H-13 specimen area at 200 times magnification with a fine lath like microstructure and scattered pores. Panel i shows the internal 17-4 P H specimen area at 200 times magnification with finer polygonal grains, and panel j shows the internal H-13 specimen area at 200 times magnification with a similar lath like microstructure and isolated pores. Panel k shows the external 17-4 P H specimen area at 500 times magnification with enlarged polygonal grains, and panel l shows the external H-13 specimen area at 500 times magnification with numerous rounded pores distributed throughout the matrix. Panel m shows the internal 17-4 P H specimen area at 500 times magnification with polygonal grains and small pores, and panel n shows the internal H-13 specimen area at 500 times magnification with a lath like matrix containing rounded pores and larger voids. Scale bars indicate 1 millimetre in panels a through d, 200 micrometres in panels e and f, 50 micrometres in panels g through j, and 20 micrometres in panels k through n.(a–n) Optical, microscopic and SEM pictures of 17-4PH versus H-13 specimen sections
Source(s): Author’s own work
When relating element composition to mechanical properties, the two materials differed because they were steel materials from two different families (Table 3). Firstly, 17-4PH (AISI 630) was a martensitic stainless steel with a high Cr content (16.3%) and other alloying elements including Ni, Cu, Si and Mn. These alloying elements were necessary to form precipitates within the granular structure. On the other hand, H-13 (AISI H13) was a high-temperature tool steel with a high Fe content and 6.2% Cr; other elements present included V and S. The presence of both Cr and V was crucial for carbide formation.
At a microscopic level (Figure 5(e)–(n)), the cross-sectional study of the samples revealed more internal imperfections in H-13. These imperfections, caused by the manufacturing process, appeared mainly on the periphery of the sample and were parallel to the external surface. This type of process-related defect has already been observed by other authors (Suwanpreecha et al., 2021).
Next, test specimens underwent detailed SEM testing to understand the material structure of each specimen and relate it later to the measured mechanical properties (Figure 5(g)–(n)). In addition, metallographic studies were conducted to better understand the mechanical properties of the two metals examined in this study. Related to this, some authors have reviewed various metal AM processes in fabricating metal and alloy parts (Basak and Das, 2016).
Several phenomena could be observed when comparing samples of the two materials. First, there were differences in the outer layer and the sample filling. For 17-4PH, the difference between the outer and inner layers was clearly visible (Figure 5(a) and (c)). In contrast, the outer layer of H13 samples was sufficiently thick to occupy practically the entire section of the test piece (Figure 5(b) and 5(d)). Despite these differences, in both cases the affected area was small and, consequently, the mechanical properties were not influenced significantly by this reduction. On the other hand, another difference between 17-4PH and H13 samples was the interaction between the material layers deposited during manufacturing. In the case of sample 17-4PH, there was greater interaction between the deposited layers. Consequently, the fracture process progressed consistently, with no changes at the section level. In contrast, H13 samples showed a section where the fracture had advanced filament by filament. As a result of this type of breakage, a discontinuous breakage section could be seen, with multiple changes in crack direction corresponding to the different filaments deposited. In both cases, the fracture surfaces indicated that these two materials produced brittle fracture and no plastic deformation. Only one area where small plastic deformations were found, located in the filling zone in some deposited filaments with 17-4PH (Figure 5(a)).
The surfaces prepared for microstructural observation revealed significant differences in the internal porosity of both samples, resulting from the 3D printing process used (Figure 5(e)–(n)). For 17-4PH, two types of internal porosity were observed: large pores in the inner section resulting from the incompletely sintered internal lattice (Figure 5(c)), and small pores in the outer section (Figure 5(k) and (m)), attributed to filament deposition during manufacturing. In contrast, sample H13 (Figure 5(d)) had only a couple of medium-sized cavities in the central area of the section. Some authors have studied the shrinkage and surface roughness of 17-4PH material (Jiang et al., 2025).
The presence of this type of internal defects, whether large or small, has a direct impact on the material’s mechanical properties, even in parts operating under fatigue conditions (Jones et al., 2023). The reason for this widespread loss of mechanical properties is that cavities, act as stress concentrators, promoting crack propagation and facilitating material failure.
Finally, another difference observed after reviewing both samples was the variation in grain sizes between the external and internal areas. First, 17-4PH samples exhibited notable differences in grain size and morphology depending on the section’s depth (Figure 5(g) and (i)). These samples predominantly exhibited equiaxed grains distributed across the surface, with larger grains near the surface, and elongated grains in the outer regions. In contrast, the grains near the centre were smaller, approximately half the size of those in the external zone. On the other hand, H-13 specimens did not exhibit significant differences in grain size along the sections of the parts (Figure 5(h) and (j)). In summary, the detailed microstructural analysis highlighted inherent differences in grain formation and distribution, which were key to understanding the varied mechanical responses of 17-4PH and H-13 materials processed by BMD.
Discussion
This study conducted detailed mechanical tests and metallographic analysis of as-sintered 17-4PH and H-13 steels produced by BMD AM. These analyses revealed relevant material properties critical for industrial automotive applications, including spares, tooling, and prototypes. The specific material composition, printing conditions and sintering processes directly influenced the resulting metallographic structures and mechanical performance.
As shown in Table 5, the results obtained in this work provided significant discussion points that highlighted the material characteristics and differences between 17-4PH and H-13.
Summary of the primary material characteristics identified in this study
| Material | Main characteristics |
|---|---|
| 17-4PH Hard tool steel AISI 630 |
|
| H-13 High resistance hot work steel AISI H13 |
|
17-4PH (AISI 630): Mechanical testing showed an average (avg.) tensile strength of 724.2 MPa and yield strength of 575.4 MPa (Table 4 and Figure 2(a)). Post-fracture analysis revealed a distinct internal structure: a fully densified outer shell approximately 2 mm thick surrounding an internal region where the original green part’s lattice structure persisted (Figure 5(a), (c) and (e)). While these parts achieved stress resistance values consistent with supplier MDSs, the observed internal porosity suggested potential for further mechanical enhancement through optimised sintering. However, some authors included research on the importance of external surface properties in the mechanical performance of parts (Townsend et al., 2016). The higher Cr, Cu, Ni and Mn content, along with a lower C content (Table 3), contributed to its excellent rust resistance and a surface hardness of 319 HV10 (Table 4), which is notably lower than that of H-13. Metallographically, 17-4PH exhibited a dual-phase microstructure of grains of martensite within retained austenite (Figure 5(e), (g), (i), (k) and (m)). According to the equipment manufacturer, it offered limited opportunities for post-sintering hardening (BMD Equipment Co., 2026b).
H-13 (AISI H13): In contrast, H-13 specimens demonstrated superior mechanical properties, achieving tensile strength of 1045.4 MPa and yield strength of 827.5 MPa (Table 4 and Figure 2(b)). These values represented an increase of over 39% in tensile strength and 25% in yield strength compared to 17-4PH. Sectioned H-13 parts exhibited a nearly fully dense structure with only a minimal internal cavity (estimated at less than 5%). This indicated highly effective binder removal and sintering, in contrast to 17-4PH. The higher C and V content (Table 3) directly contributed to its exceptional strength and an average surface hardness of 439.0 HV10 (Table 4). Metallographic analysis confirmed a predominant martensitic structure with fine precipitates (Figure 5(f), (h), (j), (l) and (n)). The high C content composition indicated significant potential for further hardening through heat treatment (BMD Equipment Co., 2026a). This notably high hardness, however, presented significant challenges for any required substrative postprocessing operations.
Comparative fracture behaviour: Both materials exhibited comparable elongation to fracture, ranging from approximately 15% to 18% (Figure 3). However, their fracture mechanisms differed: 17-4PH displayed noticeable plastic deformation, whereas H-13 fractured abruptly at its tensile limit, indicating a more brittle nature (Figure 3).
Hardness variability: A critical quantitative distinction was observed in hardness consistency. 17-4PH maintained remarkable uniformity with an average hardness of 319 HV10 and a narrow 95% CI of 5 HV10 across all specimens and batches (Table 4). In contrast, H-13, despite its higher average hardness of 439.0 HV10, exhibited significantly greater variability. This was characterised by a 95% CI width of 29 HV10, which is nearly six times greater than that of 17-4PH. This variability was further evidenced by significant batch-to-batch differences for H-13. The initial sintering batch, part D (Figure 2(b)]), had an average surface hardness of 511 HV10 with a 95% CI width of 17 HV10. However, subsequent batches, parts E and F (Figure 2(b)), showed a notable reduction in hardness to 403 HV10 and a substantially increased 95% CI width to 34 HV10. This indicated a critical inconsistency in H-13’s mechanical properties across production runs. While the exact root cause remained untraced, discussions with the equipment manufacturer suggested that additional carbon transfer occurs to the surface of the parts during the first sintering of the H-13 batch. Tests are being conducted to understand and potentially control this phenomenon.
Conclusions
This study provides critical insights into the selection of 17-4PH and H-13 steels for automotive AM via the BMD process. By detailing their mechanical properties and performance characteristics, this research supports informed decision-making for industrial applications, ultimately benefiting time-to-market, maintenance, inventory and supply chain efficiency. The key findings for BMD processed materials are summarised below.
17-4PH (AISI 630) offers three main strengths worth considering based on available literature and the author’s experience. Firstly, it offers high mechanical strength and excellent rust resistance. Also, this material’s microstructure with martensite grains within retained austenite, coupled with high Cr content, ensures material stability and consistent corrosion resistance. Finally, it is suitable for parts that require high-dimensional post-processing accuracy via subtractive methods. However, this study uncovers two main limitations of 17-4PH. First, the as-sintered parts may exhibit high internal porosity due to incomplete binder removal and sintering. In addition, heat treatment does not significantly enhance mechanical properties, making it unsuitable for applications requiring very high hardness. The typical automotive applications of 17-4PH are welding tooling supports and guides, precision robot grippers, gears and general mechanical supports.
H-13 (AISI H13), on the other hand, has exceptional resistance and hardness, making it ideal for high-wear applications (e.g. continuous metal-on-metal contact) as indicated by available publications and automotive manufacturing experience. In addition, the results of this research show that as-sintered parts have a nearly completely solid section with a homogeneous martensite microstructure. Therefore, H-13 results are ideal for applications prioritising high hardness and mechanical strength over significant corrosion resistance. Nevertheless, the main limitations are extremely high surface hardness, which makes post-processing via material subtractive methods challenging, and extraordinarily high surface hardness with the first batch sintering. Automation feeding grippers for bolts and nuts, and tooling with hard-touching details, are the most common applications in the automobile industry.
The overall implications of this study indicate that both 17-4PH and H-13 materials, when manufactured using BMD, demonstrate tremendous potential for industrial spares, tooling and prototype applications due to cost-effectiveness, competitive quality and reduced production lead times. Nevertheless, optimal selection is paramount, requiring careful consideration of mechanical properties to ensure a proper fit-for-function.
Future work is required for H-13 to comprehensively understand hardness variability across specimen surfaces and sintering batches. This will involve analysing test parts under several conditions with equipment experts.

