


This paper presents an integrated technical and economic assessment of hot axle box detectors (HABD) and hot wheel detectors (HWD) important components of derailment prevention strategies, whose role extends beyond auxiliary monitoring to become cornerstones of derailment prevention and operational resilience. Building upon the International Union of Railways (UIC) Network Monitor Phases 1–3, the study synthesises international benchmarking evidence, cost–benefit analysis and operational practice to provide a coherent framework for decision-making, deployment and harmonisation.
The methodology combines three layers: (1) international benchmarking of national rules, detector spacing and alarm thresholds across Europe, North America, Asia and Australia; (2) a cost–benefit model based on avoided accidents, fatalities and disruption, tested through sensitivity analyses of detector density and false-alarm rates; and (3) operational doctrines covering alarm logic, reliability, availability, maintainability and safety requirements, operations control centre integration and lifecycle maintenance. The findings are aligned with European Union Agency for Railways guidance, UIC International Railway Solution (IRS) 70729 and lessons from Demonstration of Railway Infrastructure Reliability and Sustainable Railway projects.
Findings confirm that HABD/HWD systems provide significant safety and economic value when integrated into operational rulebooks, maintenance workflows and digital platforms. Multi-sensor and AI-enabled detectors reduce false positives and enhance early detection, while international harmonisation efforts (e.g. IRS 70729 and EHMS) support cross-border interoperability. This study provides evidence-based guidance for risk-based deployment and lifecycle optimisation within modern railway safety frameworks.
This paper provides a comprehensive international synthesis that connects benchmarking, cost–benefit and operational safety frameworks into a structured doctrine for HABD/HWD deployment. It provides infrastructure managers and railway undertakings with evidence-based guidance on risk-based siting, lifecycle optimisation and international harmonisation. The work also contributes to the forthcoming UIC IRS, positioning HABD/HWD as globally relevant digital safety assets within the broader agenda of railway innovation, digitalisation and socio-economic resilience.
1. Introduction
Railway safety management has historically relied on a layered defence model combining vehicle maintenance, operational rules and infrastructure safeguards. Within this framework, trackside condition monitoring systems have become credible early-warning assets within layered defence tools, providing real-time data that enables the early detection of mechanical anomalies before they escalate into safety-critical events. Among these systems, hot axle box detectors (HABD) and hot wheel detectors (HWD) occupy a unique position. By monitoring the thermal behaviour of axle bearings and wheels, they address one of the most common precursors of derailments: overheating resulting from lubrication failure, material fatigue or unintended braking.
The relevance of HABD and HWD systems has been repeatedly demonstrated in both freight and passenger contexts. Major accidents such as the Ohio derailment in 2023 or the series of incidents in northern Italy in 2021 highlighted the catastrophic consequences of undetected bearing and wheel overheating. While regulator-issued investigations vary in scope, the underlying patterns of thermal failure are summarised in the comparative analyses presented in Phase 1 and Phase 3 of the UIC Network Monitor study (UIC, 2024; UIC, 2025b). In response, railway undertakings (RUs), infrastructure managers (IMs) and regulators have progressively reinforced the deployment of thermal detection, recognising it, not as an auxiliary monitoring function, but as a core safety mechanism. Nevertheless, significant challenges remain: alarm thresholds and response protocols vary considerably across countries, false-positive rates continue to impose operational and economic burdens and cross-border interoperability is hindered by the absence of harmonised standards (AAR, 2020; ProRail, 2020; RISSB, 2022; UIC, 2024).
In this context, the International Union of Railways (UIC) launched the Network Monitor study, structured into three phases.
Phase 1 (Benchmarking) established a comparative view of existing practices, highlighting discrepancies in detector spacing, alarm logic and national rules.
Phase 2 (cost–benefit analysis) quantified the economic case for HABD/HWD deployment, showing that these systems typically deliver positive cost–benefit ratios under realistic assumptions, particularly on freight-dominant corridors and high-density passenger lines.
Phase 3 (Operation, Maintenance and Safety) translated these findings into operational doctrines, defining rules for alarm handling, maintenance cycles and lifecycle planning to ensure detectors are treated as credible early-warning assets.
Taken together, these phases provide the most comprehensive international evidence base to date on the technical, economic and operational dimensions of HABD/HWD.
At the same time, technological advances are reshaping the capabilities of thermal detection systems. Current fourth-generation detectors, based primarily on infrared thermography with basic analytics, are progressively being replaced by fifth-generation platforms. These integrate multi-sensor fusion (infrared, acoustic, vibration), edge analytics and machine learning classifiers to reduce false positives and detect defects earlier in their evolution (Jia, Lei, Lin, Zhou, & Lu, 2016; Alvarez, Mazzino, & Percivale, 2019). Connectivity is also expanding: cloud-ready APIs and EHMS-style data exchanges now enable alarm records to be shared across borders, while integration with Computerised Maintenance Management Systems (CMMS) and Entity in Charge of Maintenance (ECM) databases allows HABD/HWD data to become drivers of predictive maintenance (UIC & DB Netz AG, 2020; Network Rail, 2021). This transformation positions HABD/HWD not only as safety instruments but also as enablers of digital railway strategies, asset management optimisation and international harmonisation (Ding, Li, & Xu, 2019; Ghofrani, Goverde, & Liu, 2018).
The purpose of this paper is to consolidate the findings of the UIC Network Monitor and translate them into an academic contribution relevant to IMs, RUs and policymakers worldwide. The analysis addresses three fundamental questions: what technologies exist and how they are currently deployed internationally; whether investment in HABD/HWD is justified from a safety and economic perspective; and how these systems can be operated and maintained in a way that consistently delivers value.
By situating HABD/HWD within the broader context of digitalisation, interoperability and socio-economic resilience, the paper seeks to inform evidence-based decisions on risk-based deployment and to contribute to the forthcoming International Railway Solution (IRS) on derailment prevention and hot bearing monitoring (European Union Agency for Railways [ERA], 2020; UIC, n.d.).
HABD/HWD are advisory tools providing early warnings that underpin derailment prevention strategies.
Nevertheless, some ambiguities and inconsistencies remain in current international practice, for example, the scope of hot wheel detection, the calibration of ambient corrections, or the rules for evidence packaging and competence portability These limitations have been noted in prior studies, and their resolution requires coordinated progress through emerging international frameworks such as UIC IRS 70729, the EHMS guidelines and cross-border interoperability initiatives (UIC, n.d.; UIC & DB Netz AG, 2020; SUSTRAIL Project, 2015).
The structure of the paper follows the logic of the UIC Network Monitor methodology, which is organised into three analytical pillars: international benchmarking (Chapters 2–3), operational and maintenance doctrine (Chapter 4) and economic assessment (Chapter 5), complemented by emerging technological trends (Chapter 6), a cross-cutting strategic discussion (Chapter 7) and final conclusions (Chapter 8). This structure is therefore necessary to address the technical, operational and economic dimensions in a coherent and rigorous manner.
2. Overview of HABD and HWD technologies
HABD and HWD are condition-monitoring systems designed to identify abnormal heating in axle bearings and wheel treads, both of which are precursors of mechanical failure and derailment (D-RAIL Project, 2014; Bracciali & Bucca, 2016). Their effectiveness depends not only on the sensing technology itself but also on the processing logic, calibration discipline and integration with wider railway operational systems (UIC, 2024; Network Rail, 2021).
This section outlines the functional principles, sensor families, detection logic, generational evolution and practical constraints of these technologies as currently deployed worldwide.
In this paper, Hot Wheel Detector is abbreviated as HWD (singular) and HWDs (plural). These abbreviations are used consistently throughout the text.
2.1 Functional principle
Abnormal heat generation in axle bearings typically arises from lubrication degradation, rolling-element fatigue or journal cracking, while wheel overheating is most often associated with dragging brakes or defective brake systems (Bracciali & Bucca, 2016; Alvarez, Mazzino, & Percivale, 2019). In both cases, progressive heating leads to loss of material integrity, which can culminate in axle seizure, wheel fracture or catastrophic derailment (D-RAIL Project, 2014).
HABD and HWD systems are placed trackside to measure thermal radiation or related indicators as trains pass at line speed. By capturing temperature values and comparing them against pre-defined thresholds or relative baselines, they provide an early-warning function, allowing operators to intervene before failures escalate (Papaelias et al., 2016).
2.2 Sensor families and detection methods
For clarity, the authors have used the following methods throughout this paper.
HABD refers exclusively to wayside systems monitoring the temperature of axle box bearings via infrared or other thermal-based sensors, aiming to prevent failures specific to bearing overheating.
HWD identifies abnormal heating in wheel treads, particularly from brake-related issues and is deployed where wheel integrity risks are critical. Internationally, the definition and deployment of HWD may vary, with adoption in North America, Europe and Asia subject to specific risk scenarios.
This distinction ensures that technology assessments and deployment strategies remain accurate according to function and geographic practice (AAR, 2020; UIC, 2024).
Several sensor families are used in HABD/HWD deployments.
Infrared thermography (IR). The most widely adopted approach, IR uses spot detectors, line scanners or multi-element arrays to measure temperatures at axle boxes or wheel treads. It is simple, mature and relatively low-cost, but can be affected by solar glare, snow, rain spray or brake heating (Alvarez et al., 2019). Spot detectors may miss localised anomalies, while line scanners and arrays provide fuller coverage and are preferred for high-speed lines. Their limitations underline the need for redundancy or fusion with other sensors in critical corridors (Papaelias et al., 2016).
Thermal imaging cameras. Recently deployed in Korea and other Asian networks, thermal imaging cameras capture complete thermal frames of bogies and wheels, enabling simultaneous monitoring of multiple components and post-event validation. They provide rich datasets for AI classifiers but require significant processing capacity and careful calibration to avoid artefacts (Jia et al., 2016). Their cost remains higher than point or line detectors, which may limit large-scale deployment in the short term.
Acoustic bearing detectors (ABD). Extensively used in North America and South Africa, these systems detect high-frequency acoustic emissions generated by internal bearing distress before heat rise occurs (Bracciali & Bucca, 2016). They extend the detection envelope and reduce dependence on temperature thresholds. However, they require low ambient noise, careful calibration and are best deployed in combination with HABD to corroborate signals (Papaelias et al., 2016).
Vibration and strain sensors. Deployed in pilots in Australia and Europe, these sensors capture axle-box dynamics or strain, offering an additional perspective on bearing health. They can identify mechanical looseness, wheel flats or structural resonance not visible in thermal data (Barke & Chiu, 2005; Jia et al., 2016). Their current limitations are susceptibility to electromagnetic interference and the need for careful sensor placement and mounting integrity.
Fibre Bragg Grating (FBG) sensors. Emerging mainly in research contexts, FBG sensors are immune to electromagnetic interference, support distributed sensing with one fibre monitoring multiple points and operate well under harsh conditions. Their drawbacks are high initial cost, complex calibration routines and specialised interrogation equipment, which currently limit mainstream adoption. Pilot deployments have focused on tunnels, bridges and heavy-haul corridors where measurement resilience is critical.
2.3 Detection logic and alarm thresholds
The diagnostic power of HABD/HWD systems depends on the logic applied to raw measurements. Three main approaches are observed.
Absolute thresholds – e.g. alarm when axle temperature exceeds 110 °C. Widely used for simplicity, but vulnerable to environmental variability (UIC, 2024).
Differential thresholds (ΔT) – compare temperatures between axles of the same bogie, opposite sides of an axle or against ambient reference; typically, ΔT ≥ 50 °C triggers alarms (UIC, 2024; ProRail, 2020).
Hybrid or “balanced” logic – combines absolute and differential thresholds, with environmental correction for ambient temperature, wind or braking conditions. This approach, adopted in Spain, Austria and Canada, provides the best compromise between sensitivity and false-positive suppression (UIC, 2024; RISSB, 2022).
Modern systems also generate multi-level alarms (warning, alert, critical), enabling proportional operational responses instead of binary stop/no-stop decisions.
2.4 Generational evolution
The technological development of HABD/HWD can be grouped into four stages.
3rd Generation – Infrared-only detectors with fixed thresholds. High nuisance rates, limited integration with operational systems (Alvarez et al., 2019).
4th Generation – IR detectors with basic analytics and multi-level alarm logic. Widely used today; reductions in nuisance alarms of 30–40% compared with legacy units (UIC, 2024; UIC, 2025b).
5th Generation (emerging) – Multi-sensor fusion (IR + acoustic + vibration), adaptive thresholds, edge analytics and machine learning (Jia et al., 2016). Field pilots in Europe, Canada and Australia show false-positive reductions of several tens of percent (UIC, 2025b).
Future trajectory – Integration into digital twins, with HABD/HWD data feeding into real-time fleet health models, predictive dashboards and cloud-ready interoperability platforms, ensuring alarms are trusted across borders (Ding et al., 2019).
2.5 Constraints and vulnerabilities
Despite their maturity, HABD/HWD systems face operational challenges.
Environmental interference – Solar glare, snow, rain spray and strong crosswinds can distort IR readings (Alvarez et al., 2019).
Occlusion and geometry – Bogie components may obstruct line-of-sight; siting on curves or braking zones increases nuisance alarms (Papaelias et al., 2016).
Calibration drift – Sensors require periodic calibration against certified thermal standards; failure to maintain accuracy undermines reliability (Network Rail, 2021).
Operational context – Disc-brake heating can trigger spurious alarms unless logic incorporates environmental and consist-specific corrections (Bracciali & Bucca, 2016).
These limitations underline the importance of sitings on tangent track with stable train speeds, periodic recalibration and, increasingly, the use of multi-sensor configurations to mitigate error sources.
Real-world case studies demonstrate the impact of fifth-generation, multi-sensor and AI-enabled systems. In Canada, integrated infrared and acoustic detection by CN/CP Rail has repeatedly flagged incipient bearing defects before the onset of surface overheating (UIC, 2024), allowing timely intervention and preventing derailments with substantial risk to operations and the environment.
In Spain, ADIF's high-speed corridor between Madrid and Barcelona recorded a 30% reduction in false alarms after deploying AI algorithms that dynamically combined thermal, vibration and environmental data – ensuring true anomalies prompted rapid action while minimising service disruption. In India, the national EHMS platform with AI classifiers enabled early flagging of subtle axle and bearing anomalies, leading to several documented interventions that averted potential derailments on one of the world's busiest railway networks. These examples substantiate the transformative value of fifth-generation approaches in modern railway safety management.
2.6 Integration with railway systems
The full value of HABD/HWD lies in their integration into the digital railway ecosystem.
Operations Control Centres (OCCs) – Alarms are presented in structured decision trees, guiding operational responses (e.g. continue under monitoring, stop at siding, emergency stop) (UIC, 2025b).
Automatic Vehicle Identification (AVI/RFID) – Enables precise attribution of alarms to wagons and axles, essential for interoperability and ECM traceability (UIC & DB Netz AG, 2020).
Computerised Maintenance Management Systems (CMMS/EAM) – HABD/HWD outputs generate automated work orders, linking safety alarms directly with rolling stock maintenance records (Network Rail, 2021).
Cross-border data exchange – EHMS and emerging cloud-ready APIs allow alarm records to be transmitted internationally, avoiding duplicated inspections and inconsistent responses (UIC & DB Netz AG, 2020).
In practical implementations, OCC integration is typically achieved through IEC 61375-based data transmission frameworks, enabling synchronised alarm delivery to control centres within 5–10 seconds of detection. AVI/RFID subsystems use UHF tags to associate alarms with specific vehicles and axles, achieving localisation accuracies on the order of ±1 m under standard operating conditions. These interfaces provide real-time traceability and allow OCC decision-support tools to correlate HABD/HWD alarms with consist data, environmental context and maintenance history.
2.7 International perspective
Technology choices are influenced by regional priorities.
North America – High reliance on acoustic + infrared fusion, with prescriptive spacing on freight corridors (AAR, 2020).
Europe – Balanced logic, co-location with WILD and ALC and integration into OCC/ECM systems (UIC, 2024).
Asia (Japan, China, India) – Early adoption of digital twin integration and large-scale national EHMS platforms (Indian Railways, 2022; CARS, 2019).
Australia & South Africa – Heavy-haul corridors driving innovation in multi-sensor, vibration and hybrid deployments (RISSB, 2022).
Latin America – Targeted use on mining and hazardous goods corridors, often with complementary mobile inspection technologies (UIC, 2024).
In sum, HABD/HWD technologies are evolving from reactive thermal sensors into intelligent, multi-sensor, digitally integrated platforms. Their continued development will determine not only their safety value but also their role as enablers of predictive maintenance, asset management optimisation and international interoperability (Ding et al., 2019).
From infrared-only sensors to fifth-generation multi-sensor and AI-enabled systems, detectors are evolving into predictive monitoring platforms.
3. Benchmarking insights
The benchmarking phase of the UIC Network Monitor study established the international landscape of HABD/HWD deployment (UIC, 2024). It revealed significant diversity in technological maturity, alarm thresholds and operational integration, reflecting the absence of a harmonised global framework. At the same time, it demonstrated converging trends towards multi-sensor platforms, digital integration and risk-based deployment strategies (ProRail, 2020; RISSB, 2022; Network Rail, 2021).
3.1 International practices and variability
IMs across Europe, North America, Asia and Australia have adopted HABD/HWD systems for several decades, yet their deployment philosophies remain heterogeneous (UIC, 2024; AAR, 2020; Indian Railways, 2022). In Europe, networks such as ADIF (Spain), SNCF Réseau (France) and RFI (Italy) apply multi-level alarm logics, often distinguishing between differential, hot and very hot thresholds (UIC, 2024; UIC, 2025b). By contrast, North American practice–shaped by the AAR and guidance from the Federal Railroad Administration–emphasises prescriptive spacing and strict intervention rules for confirmed hotbox alarms (AAR, 2020). Australia and Canada have focused on heavy-haul contexts, where axle loads above 30 tonnes increase bearing risk and justify closer spacing (RISSB, 2022). Asian networks are increasingly combining infrared detection with acoustic and vibration-based monitoring as part of broader digitalisation programmes (CARS, 2019; Papaelias et al., 2016).
Benchmarking also highlighted disparities in operational response. In some European networks, amber alarms permit continued operation under monitoring, while red alarms require immediate inspection (UIC, 2024). In North America, the prevailing practice is to stop and inspect at the next siding upon any confirmed hotbox alarm, reflecting a lower tolerance for risk but also higher operational cost (AAR, 2020). These discrepancies complicate cross-border operations, particularly on trans-European corridors where trains traverse multiple rulebooks within a single journey (UIC, 2024).
Beyond Europe, North America, Asia and Australia, other regions provide valuable insights. Indian Railways has developed one of the world's largest HABD networks, with more than 900 installations integrated into the national Electronic Hot Axle Box Detection System (EHMS; Indian Railways, 2022), not to be confused with the European Hotbox Monitoring System (UIC & DB Netz AG, 2020). In South Africa, Transnet Freight Rail deploys HABDs in combination with acoustic bearing detectors on 30-tonne heavy-haul corridors (RISSB, 2022). Latin America is also progressing: in Brazil, Vale and MRS Logística use HABDs on iron-ore corridors, often exposed to extreme heat and dust; in Mexico, Ferromex and KCSM have implemented detectors on cross-border freight routes carrying hazardous materials (UIC, 2024). These examples illustrate that deployment philosophies are not confined to advanced economies but are spreading globally, adapted to local risk profiles and traffic demands.
3.2 Thresholds and alarm logic
Alarm thresholds vary significantly for similar rolling stock types, often in the order of ±20 °C, depending on brake-system characteristics, climate and operating philosophy (UIC, 2024; ProRail, 2020). Some IMs adopt relative differential logic (ΔT ≥ 40–60°C), while others rely primarily on absolute thresholds (typically 100–120 °C). Ambient correction is inconsistently applied: whereas ADIF and DB Netz integrate environmental sensors to adjust alarm thresholds, other networks apply fixed values irrespective of conditions (UIC, 2024). The lack of standardisation limits international trust and consistency, particularly on cross-border corridors.
The benchmarking confirmed that the most reliable configurations are those combining both absolute and differential thresholds, supported by ambient corrections (UIC, 2024; RISSB, 2022). This balanced logic reduces false positives while maintaining sensitivity to critical defects. However, a harmonised international standard is still lacking, with IRS 70729 and the EHMS initiative emerging as key opportunities to address this gap (UIC, n.d.; UIC & DB Netz AG, 2020).9.
Balanced configurations combining absolute and differential thresholds, corrected for ambient conditions, are reported as most reliable (UIC, 2024; ProRail, 2020).
This approach is applied in Spain, Austria, Canada and increasingly in Asia.
These variations shown in Table 1 illustrate that harmonisation cannot be achieved by prescribing a single “correct” rulebook across regions. Local operating conditions, including climate, fleet design and operational philosophy, will always shape national practice. Any international framework should therefore be developed jointly by IMs and RUs to balance safety assurance with operational feasibility.
Variations of thresholds, spacing and alarm logic in different regions
| Region | Thresholds | Spacing | Alarm logic |
|---|---|---|---|
| Europe | ΔT 40–60°C + Absolute 100–120°C (ambient corrected) | 60–100 km (denser near tunnels, hazmat routes) | Multi-level (warning/alert/critical), OCC rulebooks |
| North America | Absolute ∼105–115°C (prescriptive FRA rules) | 40–65 km (25–40 miles) prescriptive spacing | Binary stop/inspect at next siding for hotbox |
| India | Mixed absolute/differential, integrated into EHMS | Dense corridors, centralised coverage (>900 sites) | EHMS: multi-level alarms integrated with OCC |
| China | Adaptive + AI classifiers, multi-spectral IR | Strategic siting on HSR and freight corridors | AI-enhanced, multi-sensor fusion, digital twin pilots |
| Australia | Absolute + differential, tuned for >30 t axle loads | Close spacing (30–50 km) on heavy-haul corridors | Multi-level, combined HABD + acoustic/vibration pilots |
3.3 Deployment density and siting practices
Deployment density varies considerably between regions, reflecting differences in traffic patterns, regulatory philosophies and risk tolerance. In North America (AAR, 2020), prescriptive rules typically result in one site every 40–65 km (25–40 miles), justified by high freight exposure and interchange of wagons across thousands of kilometres. In Europe, spacing is often wider, between 60–100 km, with coverage adapted to passenger and mixed-traffic contexts. Heavy-haul networks in Australia and South Africa (RISSB, 2022) adopt closer spacing to account for axle loads above 30 tonnes.
The benchmarking confirms that strategic siting is as important as spacing. Detectors provide greatest value when positioned at network entry points, before long tunnels or on major viaducts and along hazardous goods corridors (UIC, 2024; ProRail, 2020). By contrast, legacy-driven or opportunistic siting often fails to deliver redundancy before high-consequence exposures.
Many IMs increasingly favour co-location with other wayside systems such as Wheel Impact Load Detectors (WILD) and Axle Load Checkpoints (ALC). This approach reduces civil works costs and enables cross-validation of alarms, improving diagnostic confidence and operational decision-making.
Detailed criteria for redundancy and corridor-specific deployment strategies are further discussed in Section 4.5 on Strategic Deployment.
These differences in deployment density and siting practice are closely linked to the technological capabilities of each generation of detectors. The evolution from infrared-only devices to multi-sensor, AI-enabled platforms is the underlying factor driving the observed divergence in international strategies, as outlined in the following four-stage generational model.
3.4 Technological evolution
Benchmarking identified four generations of HABD/HWD technology. Early infrared-only detectors (3rd generation) offered limited functionality and high false-positive rates. The current 4th generation integrates basic analytics and multi-level alarms, reducing nuisance stops by 30–40%.
The transition towards fifth-generation HABD/HWD platforms builds upon the principles outlined in Section 2.4, where the technical architecture, multi-sensor fusion, adaptive thresholds, AI-assisted filtering and cloud-ready interfaces, is described in detail. Benchmarking confirms the operational impact of these capabilities: field pilots in Europe, North America and Australia show substantial reductions in nuisance alarms and earlier identification of progressive bearing distress, validating the performance attributes discussed previously.
Emerging practices outside Europe further illustrate the trajectory towards next-generation systems. In Canada, both CN and CP Rail complement thermal detectors with acoustic bearing monitoring, capable of identifying incipient defects before thermal rise occurs.
In the United States, commuter railroads and Amtrak are exploring how HABD alarms could be interfaced with Positive Train Control (PTC) decision support, not as vital interlocks but as advisory inputs for faster operational response. Collectively, these cases confirm that the global trend is moving towards multi-sensor, AI-enabled and digitally connected detectors, seamlessly integrated into broader safety and asset-management ecosystems.
3.5 Key benchmarking findings
The comparative analysis of international practices highlights several strategic insights.
Diversity complicates interoperability. Alarm thresholds, spacing criteria and operational protocols vary widely between networks (UIC, 2024; AAR, 2020). For example, absolute thresholds may differ by 20 °C or more for similar rolling stock types, and intervention rules range from “continue under monitoring” to “immediate stop”. While these differences are locally justified by fleet characteristics, climate or operational philosophy, they complicate cross-border interoperability and reduce efficiency on international freight and passenger corridors.
Operational integration is decisive. The technical capability of HABD/HWD is only fully realised when alarms are credibly embedded into OCC decision trees and ECM workflows (UIC, 2025b; Network Rail, 2021). Networks that apply structured alarm hierarchies (warning, alert, critical), combined with vehicle identification and digital maintenance integration, achieve higher reliability and avoid unnecessary disruption. Where alarms remain loosely connected to operational processes, both safety value and economic return are diluted.
The innovation trajectory is converging. Despite regional differences, there is a clear movement towards fifth-generation systems that combine multi-sensor fusion, AI-assisted filtering, digital twins and cloud-ready interoperability (UIC, 2025b). Field pilots in Europe, North America, Asia and Australia consistently report material reductions in nuisance alarms and earlier identification of developing faults. This suggests that innovation is not confined to a single geography but represents a global direction of travel.
Taken together, these findings explain why HABD/HWD should not be assessed purely on technical thresholds or installation density. Their effectiveness and economic case depend on the combination of harmonised frameworks where possible, local adaptation where necessary and disciplined operational embedding. These insights also provide the rationale for the operational and maintenance doctrines explored in Section 4, where the emphasis shifts from benchmarking to the practical integration of detectors into railway safety and asset-management systems.
International practices remain heterogeneous in thresholds, spacing and rules, but all regions converge towards risk-based deployment and digital integration.
These discrepancies underline that full harmonisation will require international consensus, which falls outside the scope of this paper (UIC, n.d.).
4. Operation, maintenance and safety
The effectiveness of HABD/HWD does not rely solely on their sensing capabilities, but on how they are embedded into railway operations, maintained throughout their lifecycle and governed as credible safety assets. International experience shows that without disciplined operational rules and robust maintenance regimes, the economic and safety benefits demonstrated in cost–benefit analyses risk being eroded by false alarms, poor availability or inconsistent responses (D-RAIL Project, 2014; UIC, 2025b; SUSTRAIL Project, 2015).
4.1 Operational integration
Modern HABD/HWD installations are no longer isolated devices but part of an integrated network of wayside checkpoints. Their operational value depends primarily on how alarms are received, interpreted and acted upon in the OCC and subsequently linked to maintenance and safety management processes (Network Rail, 2021; ProRail, 2020; RISSB, 2022).
Most networks now classify alarms into hierarchical levels–commonly warning, alert and critical–with each linked to predefined operational responses. Warning-level alarms generally prompt monitoring and reduced speed, alert-level alarms require inspection at the next siding or depot, while critical alarms justify immediate intervention to prevent entry into high-consequence exposures such as long tunnels or major viaducts. Embedding this logic in OCC decision trees ensures consistency across shifts and reduces reliance on individual judgement.
Integration with Automatic Vehicle Identification (AVI) and RFID systems has become standard practice, allowing alarms to be tied to specific wagons and axles. This prevents duplication between IMs and RUs, ensures the responsible Entity in Charge of Maintenance (ECM) is notified and facilitates rapid traceability across borders. When combined with Computerised Maintenance Management Systems (CMMS) or Enterprise Asset Management platforms, HABD/HWD outputs can automatically generate work orders, transforming alarms into actionable maintenance tasks. Figure 1 provides a consolidated view of how HABD/HWD alarms move through operational and maintenance systems.
 The diagram illustrates the operational workflow linking detection, operations, and maintenance for hot axle box and hot wheel monitoring. It consists of three vertical panels arranged from left to right. The left panel, titled “Detection (H A B D/H W D + A V I/R F I D)”, represents trackside detection systems. Hot Axle Box Detectors (H A B D) and Hot Wheel Detectors (H W D), supported by automatic vehicle identification (A V I) and R F I D, generate alarms classified as warning, alert, or critical. The central panel, titled “O C C (alarm classification, decision tree, operational response)”, represents the Operations Control Centre. Here, incoming alarms are assessed using predefined classification rules and decision trees to determine the appropriate operational response, including continued operation, controlled stop, or immediate intervention. The right panel, titled “Maintenance (E C M/C M M S, work orders, interventions)”, represents maintenance management systems. Validated alarms trigger work orders in the Entity in Charge of Maintenance (E C M) and Computerised Maintenance Management System (C M M S), leading to inspections and corrective interventions. Directional arrows indicate information flow: alarms pass from detection to the O C C, operational decisions are fed back when required, and confirmed alerts generate maintenance actions. The diagram highlights the closed-loop integration between detection, operational decision-making, and maintenance execution.
Operational flow of HABD/HWD alarms across detection, OCC and maintenance processes. Source: Authors’ own work, informed by operational practices from ADIF (Spain), Network Rail (UK) and Indian Railways EHMS
The diagram illustrates the operational workflow linking detection, operations, and maintenance for hot axle box and hot wheel monitoring. It consists of three vertical panels arranged from left to right. The left panel, titled “Detection (H A B D/H W D + A V I/R F I D)”, represents trackside detection systems. Hot Axle Box Detectors (H A B D) and Hot Wheel Detectors (H W D), supported by automatic vehicle identification (A V I) and R F I D, generate alarms classified as warning, alert, or critical. The central panel, titled “O C C (alarm classification, decision tree, operational response)”, represents the Operations Control Centre. Here, incoming alarms are assessed using predefined classification rules and decision trees to determine the appropriate operational response, including continued operation, controlled stop, or immediate intervention. The right panel, titled “Maintenance (E C M/C M M S, work orders, interventions)”, represents maintenance management systems. Validated alarms trigger work orders in the Entity in Charge of Maintenance (E C M) and Computerised Maintenance Management System (C M M S), leading to inspections and corrective interventions. Directional arrows indicate information flow: alarms pass from detection to the O C C, operational decisions are fed back when required, and confirmed alerts generate maintenance actions. The diagram highlights the closed-loop integration between detection, operational decision-making, and maintenance execution.Operational flow of HABD/HWD alarms across detection, OCC and maintenance processes. Source: Authors’ own work, informed by operational practices from ADIF (Spain), Network Rail (UK) and Indian Railways EHMS
International practice illustrates different integration philosophies. India's EHMS platform consolidates alarms from hundreds of HABD sites into regional and national OCCs, ensuring centralised oversight of one of the world's busiest mixed-traffic networks. In Japan, JR-East integrates detector data with Train Control and Monitoring Systems (TCMS) on Shinkansen services, creating real-time fleet health dashboards that allow maintenance teams to plan interventions proactively. In North America, FRA rulebooks mandate prescriptive operational responses: a confirmed hot bearing alarm obliges inspection at the next siding, reflecting a conservative risk appetite but at the cost of higher operational disruption (AAR, 2020).
These examples confirm that the operational integration of HABD/HWD is not simply a matter of installing sensors, but of embedding their outputs into rulebooks, OCC decision logic and maintenance platforms. Only when this chain is robust can detectors function as credible early-warning assets within a safety management system (ERA, 2020; UIC, 2025a, b).
4.2 RAMS requirements
The reliability, availability, maintainability and safety (RAMS) of HABD/HWD installations are decisive in ensuring that they function as trusted safety assets rather than occasional diagnostic tools (D-RAIL Project, 2014; RISSB, 2022; UIC, 2025a, b).
Reliability depends on robust sensors with built-in self-diagnostics, drift monitoring and automated health reporting to OCCs. Systems must be able to detect calibration drift or sensor failure promptly, so that alarms are not suppressed or, worse, erroneously reported as “clear”.
Availability targets for detectors are typically set at above 98% site uptime. This level is achieved through preventive maintenance programmes, redundant communications channels and local buffering capacity to ensure that data are not lost in case of temporary network outages. In high-density passenger or freight corridors, redundancy through dual-site coverage is increasingly required to maintain this availability in practice.
Maintainability is ensured by structured calibration and service regimes, usually annual or semi-annual, with traceability to accredited national standards. Maintenance tasks include lens cleaning, alignment, firmware updates and communication module testing. Modular designs, with hot-swappable sensor elements, are increasingly adopted to reduce downtime and improve maintainability (INNOTRACK Consortium, 2010; SUSTRAIL Project, 2015).
Safety integrity is safeguarded by fail-safe design principles. HABD/HWD operate in advisory mode, but any subsystem malfunction must trigger a technical alarm, never a false “healthy” message. Safety cases submitted to regulators increasingly require documented fail-safe logic and traceable test records.
A further dimension of RAMS is cybersecurity, as detectors evolve into digital network nodes. Leading IMs apply IEC 62443 and ISO 27001 frameworks, ensuring encrypted communications, role-based access control (RBAC), tamper-evident logging and multi-factor authentication for remote access. Alarm payloads are digitally signed at source, enabling OCC staff and ECMs to verify authenticity. Cyber audits and penetration tests are now included in RAMS evidence within Safety Management System (SMS) audits (UIC & DB Netz AG, 2020).
A further dimension of RAMS, increasingly critical as HABD/HWD evolve into digital assets, is cybersecurity. As detectors become network-connected nodes, their RAMS profile must incorporate robust digital safeguards.
As HABD/HWD become digital nodes on multiservice networks, cybersecurity has become a core RAMS concern. Alarms must be trusted not only technically but digitally. Best practice now includes.
Encryption and VPNs: ensuring data from trackside to OCC is protected against interception.
Role-based access control (RBAC) and multi-factor authentication for maintainers accessing HABD cabinets or cloud portals.
Cryptographic signatures and hashing applied at the point of capture, guaranteeing that thermal data and images cannot be altered in transit.
IEC 62443 and ISO 27001 compliance: already mandatory for some European IMs, increasingly adopted in Asia and North America.
Annual penetration testing and audit logs integrated into the Safety Management System.
These measures guarantee that HABD/HWD alarms are not only operationally credible but also legally defensible, an essential requirement as safety authorities rely on digital evidence in investigations.
The importance of cyber-secure alarm evidence is reinforced in derailment-prevention guidance (UIC, n.d.: IRS 70729).
For clarity, the KPI targets illustrated in Figure 2 above correspond to commonly adopted industry benchmarks: detection effectiveness ≥95%, nuisance alarm rate ≤5%, Mean Time To Acknowledge (MTTA) < 5 minutes, Mean Time To Repair (MTTR) < 24 hours and site availability ≥98%.
 The radar chart displays values across five system metrics arranged from the right in counterclockwise order as “Detection Effectiveness”, “Nuisance Rate”, “M T T A”, “M T T R”, and “Availability”. Each metric is represented by an axis radiating from the center, with concentric rings marking value intervals from 20 at the inner ring to 100 at the outer ring with an interval of 20. The chart includes one colored polygon that represents system performance. The blue polygon represents the measured values. The data values for each metric are as follows: Detection Effectiveness (blue): 95. Nuisance Rate (blue): 96. M T T A (blue): 50. M T T F (blue): 29. Availability (blue): 98. Note: All numerical data values are approximated.
RAMS KPI targets for HABD/HWD. Source: Authors’ own work, based on data consolidated from UIC Network Monitor Phases 1–3
The radar chart displays values across five system metrics arranged from the right in counterclockwise order as “Detection Effectiveness”, “Nuisance Rate”, “M T T A”, “M T T R”, and “Availability”. Each metric is represented by an axis radiating from the center, with concentric rings marking value intervals from 20 at the inner ring to 100 at the outer ring with an interval of 20. The chart includes one colored polygon that represents system performance. The blue polygon represents the measured values. The data values for each metric are as follows: Detection Effectiveness (blue): 95. Nuisance Rate (blue): 96. M T T A (blue): 50. M T T F (blue): 29. Availability (blue): 98. Note: All numerical data values are approximated.RAMS KPI targets for HABD/HWD. Source: Authors’ own work, based on data consolidated from UIC Network Monitor Phases 1–3
Finally, RAMS assurance is increasingly quantified through Key Performance Indicators (KPIs) embedded in service contracts. Typical targets include.
Detection effectiveness: ≥ 95% of true overheating cases identified.
Nuisance alarm rate: ≤5% of alarms.
Mean Time To Acknowledge (MTTA): <5 minutes in OCCs.
Mean Time To Repair (MTTR): <24 hours for critical failures.
These KPIs provide measurable evidence that detectors are not only installed but are functioning as dependable and auditable components of the safety monitoring assets (ERA, 2020; UIC, 2025a, b) (see Figure 2).
4.3 Alarm management
One of the most persistent challenges in HABD/HWD operation is the management of alarms, particularly the balance between false positives and false negatives. Both impose significant consequences: false positives generate unnecessary operational disruption and costs, while false negatives carry the risk of undetected defects that may lead to catastrophic derailments (D-RAIL Project, 2014; SUSTRAIL Project, 2015).
False positives. Legacy infrared-only systems typically generate one to two spurious alarms per site-year, each imposing costs in the form of unscheduled stops, delay minutes and inspection resources. Modern multi-sensor detectors with edge analytics have achieved material reductions in nuisance alarms, often on the order of tens of percent in corridor pilots. However, disciplined mitigation strategies remain necessary. These include.
Geo-specific tuning, accounting for wind corridors, gradients or solar glare.
Dual-site confirmation before ordering an operational stop on high-density lines.
Video corroboration using CCTV or thermal imagery to validate suspect readings.
Seasonal correction profiles to adjust thresholds according to ambient conditions (Network Rail, 2021; ProRail, 2020).
False negatives. Equally important is minimising cases where overheating is not detected. Investigations by FRA and NTSB in North America have shown that rare false negatives–often due to calibration drift, occluded line-of-sight or inappropriate thresholds–can have catastrophic consequences. Mitigation measures include detector redundancy on high-consequence corridors, adaptive thresholds that reflect train-specific and ambient conditions and corroboration across multiple sensor types (e.g. HABD + acoustic bearing monitoring + WILD).
To support decision-making, alarm evidence packages are increasingly standard. These typically combine thermal images, CCTV stills, AVI/RFID wagon identifiers and environmental data, allowing OCC staff to validate alarms rapidly and ECMs to close cases in their maintenance records. Best practice is to transmit such evidence alongside the alarm payload to facilitate both operational response and post-incident investigations (UIC & DB Netz AG, 2020).
These evidence packages strengthen both operational decision-making and post-incident analysis (see Figure 3). Ultimately, alarm management defines the credibility of HABD/HWD systems. Networks that embed evidence packages, apply dual-site confirmation in critical corridors and monitor nuisance/false negative rates as contractual KPIs sustain both the safety and economic case for deployment.
 The flowchart shows the operational flow of detection, alarm handling, decision-making, and maintenance processes. The flow begins from the top left, showing detection with “Detection (H A B D slash H W D sensors, A V I slash R F I D)”, shown at the top left, with sensor icons. An arrow leads to “Sending data to O C C”, shown at the top right, with screen and operator icons. From “Detection”, the process continues downward with a double-headed arrow to “Alarm sorting (warning yellow, alert orange, critical red)”, represented by a warning icon. This leads down to a “Decision tree”, displayed with colored blocks labeled “Alerting” and “Critical Red”. The decision tree leads downward to “Maintenance (C M M S slash E A M computer icon, mechanic icon)” by a computer icon on the left. From “Maintenance”, an arrow forms a feedback loop, also having a white dotted curved arrow labeled “Feedback loop for incident closure”, and another double-headed arrow is connected to “Detection”, shown on the right side with monitoring and worker icons. Then “Detection” links with “Sending data to O C C” by an upward arrow labeled “Feedback loop for incident closure”. The “Detection” again links to the “Alarm sorting”. Additional double headed arrow connects “Sending data to O C C” back to “Alarm sorting”.
HABD alarm processing workflow. Source: Authors’ own work, based on data consolidated from UIC Network Monitor Phases 1–3
The flowchart shows the operational flow of detection, alarm handling, decision-making, and maintenance processes. The flow begins from the top left, showing detection with “Detection (H A B D slash H W D sensors, A V I slash R F I D)”, shown at the top left, with sensor icons. An arrow leads to “Sending data to O C C”, shown at the top right, with screen and operator icons. From “Detection”, the process continues downward with a double-headed arrow to “Alarm sorting (warning yellow, alert orange, critical red)”, represented by a warning icon. This leads down to a “Decision tree”, displayed with colored blocks labeled “Alerting” and “Critical Red”. The decision tree leads downward to “Maintenance (C M M S slash E A M computer icon, mechanic icon)” by a computer icon on the left. From “Maintenance”, an arrow forms a feedback loop, also having a white dotted curved arrow labeled “Feedback loop for incident closure”, and another double-headed arrow is connected to “Detection”, shown on the right side with monitoring and worker icons. Then “Detection” links with “Sending data to O C C” by an upward arrow labeled “Feedback loop for incident closure”. The “Detection” again links to the “Alarm sorting”. Additional double headed arrow connects “Sending data to O C C” back to “Alarm sorting”.HABD alarm processing workflow. Source: Authors’ own work, based on data consolidated from UIC Network Monitor Phases 1–3
4.4 Competence and governance
The effectiveness of HABD/HWD operation depends not only on technology but also on clear governance structures and staff competence across the different actors involved. Responsibility is distributed: IMs oversee detector health and OCC responses; RUs ensure that train handling complies with alarm instructions; and Entities in Charge of Maintenance (ECMs) are responsible for diagnosing, recording and closing alarms through verified maintenance actions (ERA, 2020; RISSB, 2022).
Competence frameworks are essential to ensure that staff across these domains are trained and certified consistently. OCC operators must be able to interpret evidence packages, apply response rules correctly and escalate cases when thresholds are exceeded. Maintenance personnel require certification in calibration procedures, equipment testing and record-keeping, ensuring traceability and compliance with accredited standards.
A growing challenge is cross-border competence portability. On international freight and passenger corridors, trains may traverse several IMs and OCCs. If each network applies different competence standards, responses become inconsistent. Pilot initiatives such as the EHMS envisage mutual recognition of competence profiles across IMs, enabling OCC staff and ECMs to apply alarms consistently regardless of national boundary (UIC & DB Netz AG, 2020). Similar discussions are emerging in North America, where interchange agreements increasingly reference detector alarm handling (AAR, 2020).
Governance must also adapt to the introduction of artificial intelligence in fifth-generation detectors. AI classifiers trained to filter nuisance alarms or detect sub-threshold anomalies must be subject to strict version control, documented explainability and periodic re-training with validated “shop-find” data from failed bearings and wheels. Regulatory confidence depends on being able to audit not only the hardware but also the algorithms that inform alarm decisions. For this reason, IMs and regulators are beginning to require parallel rule-based outputs, so that AI recommendations can be cross-checked and, if necessary, challenged.
Finally, governance extends to data integrity and auditability. Alarm payloads and evidence packages should be stored in secure, tamper-evident repositories, with access logs forming part of the Safety Management System (SMS) audits. This ensures that alarms are not only acted upon in real time but can be reviewed for compliance, performance monitoring and post-incident investigations.
Beyond technical safeguards, data governance requires clear legal or contractual frameworks defining ownership, access rights and responsibilities for alarm and evidence data. This becomes particularly relevant in cross-border contexts, where national regulations on data sovereignty may otherwise hinder interoperability.
4.5 Strategic deployment
Operational experience confirms that HABD/HWD deployment is most effective when based on risk rather than uniform spacing. While Chapter 3 outlined the variability of detector spacing across regions, strategic deployment focuses on how IMs decide where and how detectors should be placed to maximise value and resilience.
Risk-based prioritisation. HABDs and HWDs are typically prioritised on corridors with high freight tonnage, hazardous goods traffic, long tunnels, steep gradients or complex junctions. These represent high-consequence exposures where a derailment would have disproportionate safety, economic and environmental impacts. Passenger-dense routes, particularly high-speed lines, also justify enhanced coverage due to the reputational and compensation risks of disruption.
Redundancy before critical exposures. Experience shows that at least one confirmation opportunity should be available before a train enters a long tunnel, crosses a major viaduct or passes through a dense urban node. Redundancy may be achieved through dual-site coverage or by combining thermal detectors with complementary technologies such as Wheel Impact Load Detectors (WILD) (Papaelias et al., 2016).
Co-location and multi-sensor nodes. Many IMs increasingly favour co-locating HABD/HWD with other wayside systems such as WILD and Axle Load Checkpoints (ALC). These multi-sensor “safety portals” reduce civil works costs, improve diagnostic confidence by cross-validating alarms and provide richer datasets for OCC decision-making and ECM maintenance records (Bracciali & Bucca, 2016).
Decision matrix for siting. A practical approach is to apply a risk-based matrix combining several criteria.
Traffic density (number of trains/day, freight versus passenger mix).
Axle load (with thresholds >25–30 tonnes justifying closer spacing).
Hazardous goods exposure (train-kilometres per week carrying dangerous cargo).
Geography (long tunnels, viaducts, steep gradients, flood-prone areas).
Climatic extremes (snow/ice in Nordic networks, desert heat in Australia, humidity in tropical regions).
Network redundancy (availability of diversionary routes).
Where multiple criteria converge–for example, heavy hazardous goods traffic on a steep-gradient corridor with tunnels–dense deployment with dual-site confirmation is warranted. By contrast, on rural or low-density lines with limited risk exposure, mobile HABD campaigns or periodic thermal inspections can provide an appropriate balance between safety assurance and economic efficiency.
Global practices. International benchmarking illustrates this diversity. In North America, prescriptive spacing every 40–65 km is justified by heavy freight interchange and long-haul corridors. In Europe, detectors are positioned more selectively, with reinforcement at tunnel portals and hazardous goods routes. Heavy-haul corridors in Australia and South Africa favour dense siting to mitigate high axle loads, while India deploys HABDs systematically in its national EHMS network, integrating siting logic with centralised data management.
Strategic deployment is therefore not a uniform formula but a contextual decision framework, balancing safety, cost and operational resilience. Networks that apply a structured risk matrix and embed redundancy and co-location principles achieve the highest safety return on investment.
4.6 Safety and resilience outcomes
When operated within a disciplined operational and maintenance framework, HABD/HWD systems consistently achieve their intended purpose: preventing derailments, reducing disruption and reinforcing network resilience. Their contribution is twofold: direct accident prevention and indirect benefits in punctuality, asset reliability and passenger or freight confidence.
Accident prevention. HABDs and HWDs address one of the most frequent precursors of derailment–bearing and wheel overheating. By providing early warnings, they enable interventions that prevent axle seizures, wheel fractures and subsequent derailments. Quantitative evidence reinforces this safety value: in Austria, axle-related derailments were reduced around 50% following the deployment of 48 HABD sites; in Hungary, multi-level alarm logic cut intervention delays by approximately 40% on freight corridors; and in North America, FRA investigations into several high-profile accidents have concluded that earlier or more consistent detector coverage would likely have prevented the event.
Operational resilience. On high-speed passenger corridors, the economic case often derives less from avoided derailments–rare but catastrophic–and more from avoided disruption. Spain's ADIF reported measurable improvements in punctuality KPIs after adopting adaptive thresholds corrected for ambient temperature on the Madrid-Barcelona Line. By reducing nuisance stops and secondary delays, detectors directly enhance timetable stability and passenger satisfaction. Freight operators also benefit: Canadian heavy-haul railways attribute significant reductions in in-service bearing failures and unscheduled stops to multi-sensor HABD + acoustic monitoring nodes.
Asset management and predictive maintenance. HABD/HWD outputs, when integrated with CMMS and ECM workflows, provide trend data that support condition-based maintenance. Rather than replacing bearings or wheels on fixed mileage intervals, ECMs can intervene when evidence of overheating or progressive degradation is present. North American operators report reductions of 15–20% in premature bearing replacements by linking detector alarms to shop-find outcomes, while Japanese and Chinese pilots already feed HABD data into digital twin models for predictive simulations of axle health.
Socio-economic benefits. By avoiding both derailments and large-scale disruption, detectors contribute to wider societal objectives. Preventing hazardous goods derailments reduces environmental risk, while improved punctuality strengthens public trust in passenger services (SUSTRAIL Project, 2015). Together, these outcomes support rail's competitiveness against road and its role in sustainable transport strategies.
In summary, HABD/HWD systems deliver measurable safety improvements, operational reliability gains and socio-economic resilience. Their value is maximised when alarms are embedded into OCC playbooks, ECM processes and digital asset strategies, transforming them from stand-alone devices into trusted early-warning assets within a modern safety management system.
Reliable operation, structured maintenance and sound governance turn detectors into trusted early-warning assets for safety and resilience.
5. Cost–benefit analysis of HABD/HWD systems
The international differences outlined in Section 3, covering deployment density, alarm logic and operational integration, have direct implications for the economic performance of HABD/HWD systems. To contextualise these variations, this section develops a structured cost–benefit analysis, quantifying how investment, operating context and technological maturity shape economic returns across different network scenarios.
The deployment of HABD and HWD represents a significant long-term investment. As shown in the benchmarking and operational sections, their effectiveness depends on both technical design and operational discipline. Cost–Benefit Analysis (CBA) provides the structured framework to assess whether the safety, operational and socio-economic benefits outweigh lifecycle costs. This section develops the rationale in detail, connecting accident prevention with financial value and illustrating how results vary across network types and international contexts.
The analysis adopts a 15-year appraisal horizon with a 3.5% real discount rate. A “without project” baseline is compared with scenarios including HABD/HWD deployment. Benefits include avoided derailments, reduced disruption (delay minutes) and maintenance efficiencies through condition-based interventions. Costs include CAPEX, OPEX, REPEX and false-alarm handling. Capture probability and false-positive rates are tested in sensitivity analyses (ERA, 2020).
5.1 Lifecycle cost structure
The total cost of ownership of a HABD/HWD site typically spans 3 main categories, complemented by context-specific externalities.
Capital Expenditure (CAPEX):
Procurement of infrared scanners, acoustic/vibration modules, environmental probes, AVI/RFID readers.
Civil works for installation: foundations, cabling, drainage, EMC shielding.
Integration with multi-service networks and OCC/CMMS interfaces.
Typical range: €110,000–350,000 per site, rising to €420,000 for multi-sensor portals.
Operational Expenditure (OPEX):
Annual calibration (required by IRS 70729, EN 15437–2).
Preventive maintenance: cleaning, alignment, firmware updates.
Energy: ∼€500–1,000/year, higher for remote off-grid sites.
False-positive handling: €3,000–8,000 per event, ∼1–2 per site-year in legacy IR systems.
Total annual OPEX: €8,000–25,000 per site.
Replacement Expenditure (REPEX):
Mid-life renewal of sensors, electronics and comms (7–10 years).
Estimated 20–30% of initial CAPEX.
Dismantling/recycling costs at end-of-life: €5,000–10,000 per site.
Externalities:
Training and competence certification (initial + refresher cycles).
Cybersecurity upgrades (VPN, intrusion testing, cloud licences).
Cost of integrating HABD data into ECM and regulatory reporting frameworks.
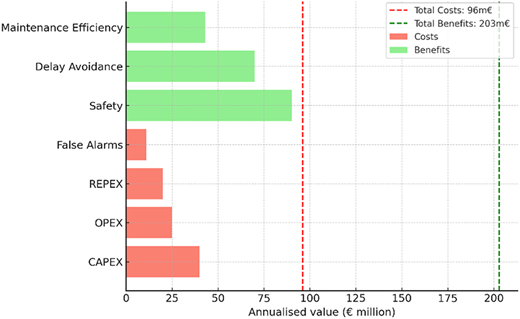
Axis units in Figure X correspond to annualised economic values expressed in million euros (€M).
These externalities complete the full lifecycle cost structure of HABD/HWD systems and frame the economic modelling presented in the following sections (see Table 2).
5.2 Benefit streams in detail
Benefits accrue in three main dimensions, all of which are quantifiable.
Safety benefits:
Prevention of derailments due to bearing/wheel overheating.
ERA accident data show ∼70 derailments/year in EU (2023), of which 10–15% relate to hot axle/wheel causes (ERA, 2020).
With 70–80% detection and prevention effectiveness, this equates to 7–8 derailments avoided annually across Europe.
Average cost of a freight derailment: €1.8-2.4M (infrastructure, rolling stock, disruption). Passenger derailments are rarer but more severe (fatalities, reputational damage).
Each avoided derailment represents not only infrastructure and rolling stock cost savings, but also avoidance of potential fatalities, environmental damage and reputational loss.
Operational benefits:
Avoidance of cascading delays. One spurious stop can generate 90–150 train-minutes of knock-on delay (Network Rail, 2021).
On high-speed passenger networks, avoided disruption costs exceed the safety benefit itself.
Example: ADIF reported improved punctuality KPIs on Madrid-Barcelona HSR after adopting ambient-corrected HABD thresholds.
Asset management benefits:
When integrated with ECM and CMMS systems, detectors support condition-based maintenance, reducing premature bearing replacements and enabling predictive interventions.
Avoidance of premature bearing scrapping (∼15–20% savings) (Cai, Zhao, & Liu, 2020; Ding et al., 2019).
Trend monitoring reduces in-service failures, increasing fleet reliability.
Example: a North American freight IM reported 18% reduction in premature bearing replacements after linking HABD alarms with ECM data.
Societal benefits:
Avoided fatalities, valued using Value of Preventing a Casualty (VPC, ∼€2.1M/fatality, EC Handbook, 2020).
Protection of hazardous goods (chemical spills, environmental impact).
Increased passenger trust and modal shift benefits.
5.3 Quantitative modelling
The UIC Network Monitor Phase 2 developed an EU-27 reference case of ∼3,000 HABD/HWD sites. Key results (15-year horizon).
Annualised cost per site: ∼€32,000.
Total annual cost (3,000 sites): ∼€96m.
Annual benefit (freight only): €163M.
Annual benefit (freight + passenger): €203M.
Net surplus: ∼€107M.
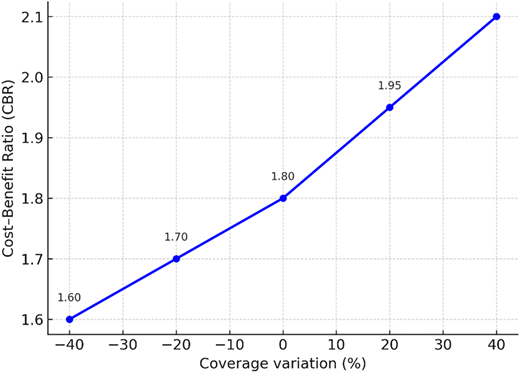
Cost–Benefit Ratio (CBR): 1.66–2.11 (sensitivity ± 20–40% deployment).
Sensitivity analyses highlight two decisive factors.
False-positive rates
Deployment density
The economic model's sensitivity to key factors such as false alarm rates, deployment density and operational effectiveness is crucial for investment decision-making in diverse railway contexts.
False Alarm Rates: Reducing false alarms, e.g. lowering from 1.5 to 0.5 per site per year, significantly increases the benefit-to-cost ratio (BCR) by approximately 0.2 to 0.3 points. High false alarm rates lead to unnecessary operational disruptions and increased maintenance costs, eroding economic returns. In this section, BCR refers to the ratio of total discounted benefits to total discounted costs over the appraisal horizon.
Deployment Density: Increasing detector density improves the probability of detecting real faults, thereby enhancing safety and economic benefits. However, higher density also raises capital (CAPEX) and operational (OPEX) expenses. The model shows that even with increased costs, appropriate density strategies maintain a positive BCR when aligned with corridor risk profiles.
Operational Effectiveness: Factors including calibration quality, response discipline and integration with maintenance systems critically influence outcome reliability. Poor operational practices can degrade model benefits by causing missed detections or excessive false positives. Conversely, disciplined operation, leveraging AI-enhanced detectors and integrated workflows, boosts effectiveness and economic returns.
In summary, the model indicates that investment risk varies with these parameters, underscoring the need for tailored deployment and operational strategies. Sensitivity analysis enables managers to balance costs, benefits and risks according to specific network characteristics and performance standards.
5.4 International case studies
Real-world deployments confirm these trends.
Austria (ÖBB): 48 HABD sites reduced axle-related derailments by > 50%, saving €12m over 5 years UIC (2024; 2025a; 2025b).
Hungary (MÁV Zrt.): 55% reduction in derailments on freight corridors after deploying multi-level alarms, ROI within five years.
Spain (ADIF): Balanced alarm logic reduced nuisance stops on HSR, improving punctuality and reducing compensation costs.
North America: FRA Safety Advisory 2023–01 (FRA Safety Advisory 2023–01 (FRA, 2023) explicitly recommended wider HABD use after the East Palestine derailment, where journal overheating was the initiating cause.
India: National EHMS integrates >900 HABD sites; centralised data reduced duplicate alarms and enabled predictive fleet interventions across a vast mixed-traffic network. Following the integration of more than 900 HABD sites into the national EHMS platform, Indian Railways reported a reduction in duplicate or repeated alarms from approximately 25% to 8%, alongside the identification of an average of 10–12 potential bearing-related failures per year that were addressed before escalating into safety-critical events. The centralised architecture also reduced response times and enabled predictive interventions across a high-volume mixed-traffic network.
South Africa: Transnet combines HABD with acoustic bearing detectors on manganese and coal corridors, avoiding catastrophic failures under 30+ tonne axle loads.
These international results are consistent with the sensitivity trends illustrated in Table 3, which shows how variations in network coverage influence the resulting cost–benefit ratio.
5.5 Linking O&M to economic outcomes
The positive CBR values are not guaranteed: they depend directly on operational discipline.
Poor calibration increases false positives → erodes economic benefit.
Inconsistent OCC responses → higher disruption cost.
Lack of CMMS/ECM integration → benefits of predictive maintenance not realised.
Conversely, multi-sensor fusion and AI filtering halve nuisance costs, improving ROI by 20–30%.
Conversely, reductions in nuisance alarms through multi-sensor fusion and AI filtering (see Section 4.3) significantly improve economic returns by lowering the cost of false interventions.
Thus, the CBA is not a static figure but a reflection of how well detectors are operated and maintained.
5.6 Strategic implications
CBA results justify risk-based deployment.
High-density freight corridors: highest benefit, especially where hazardous goods are transported.
High-speed passenger lines: benefits dominated by avoided secondary delays.
Low-density rural lines: full permanent coverage harder to justify; mobile HABD campaigns or selective siting more cost-effective.
Multi-sensor portals (HABD + WILD + ALC) show higher upfront CAPEX but superior lifecycle economics due to reduced false positives and richer diagnostic data.
The CBA confirms that HABD/HWD deployment is economically justified under risk-based criteria. High-density freight corridors, hazardous goods routes and high-speed passenger lines consistently deliver the strongest returns. While multi-sensor checkpoints involve higher CAPEX, their superior diagnostic performance improves lifecycle economics. On low-density rural lines, full permanent coverage may not be justified; here, mobile or periodic HABD campaigns can provide adequate assurance at lower cost.
5.7 Summary
In summary, HABD/HWD systems are economically viable safety investments. Across large networks, they deliver Benefit-Cost Ratios between 1.66 and 2.11, as confirmed in Phase 2 of the UIC Network Monitor study. Their sustained economic value depends on disciplined operation, effective alarm management and integration into digital maintenance platforms, ensuring that detectors function not only as safety devices but as enablers of predictive asset management and network resilience.
The overall range of Benefit–Cost Ratios reported in Phase 2 (1.66–2.11) aligns with the coverage-related sensitivity results summarised in Table 3, confirming the robustness of the model under variations in detector density.
Table 4 presents a concise overview of investment levels (CAPEX), ongoing operational costs (OPEX), expected annual economic benefits (MEUR) and corresponding cost–benefit ratios (CBR) for Hot Axle Box and Hot Wheel Detector systems across varying corridor types and technology generations. It highlights how fifth-generation solutions, featuring multi-sensor fusion and AI capabilities, although requiring higher initial and operational expenditures, tend to provide improved cost–benefit returns due to enhanced detection accuracy and reduced false alarm rates.
Cost-benefit overview for HABD/HWD across corridor types and technology generations
| Corridor type | Technology generation | CAPEX (kEUR/site) | Annual OPEX (kEUR/site) | Estimated annual benefit (MEUR) | Cost-benefit ratio (CBR) |
|---|---|---|---|---|---|
| High-density heavy freight | 4th Generation | 150 | 15 | 20 | 1.6 |
| High-density heavy freight | 5th Generation | 350 | 20 | 24 | 1.9 |
| High-speed passenger | 4th Generation | 120 | 12 | 12 | 1.7 |
| High-speed passenger | 5th Generation | 300 | 16 | 15 | 2.1 |
| Low-density rural | 4th Generation | 100 | 10 | 4 | 1.1 |
| Low-density rural | 5th Generation | 250 | 13 | 4 | 1.4 |
Moreover, the economic justification for deploying such systems is strongest along high-density freight and passenger corridors, while more selective or mobile deployments may be appropriate for low-density rural lines to maintain cost efficiency. This information aids stakeholders in benchmarking and strategic planning for railway safety investment decisions.
By reducing nuisance alarms, detecting defects earlier in their progression and integrating seamlessly with OCC and ECM digital platforms, they avoid a larger share of disruption costs and premature maintenance actions compared with fourth-generation detectors.
The benefit differential is most visible on high-density freight and high-speed passenger corridors, where false positives and secondary delays carry major economic consequences. On low-density rural lines, by contrast, the incremental benefit of fifth-generation technology is smaller, as traffic volumes and potential disruption are limited, though still positive when long-term reliability and reduced premature replacements are considered.
Economic appraisals show Benefit-Cost Ratios between 1.66 and 2.11, with strongest returns on heavy-haul freight, hazardous goods and high-speed corridors.
6. Emerging trends and innovation
The evolution of HABD/HWD has entered a new technological cycle. What were once stand-alone infrared devices issuing binary alarms are now becoming multi-sensor, intelligent and interoperable platforms, directly connected with railway digitalisation agendas worldwide. This section reviews six innovation vectors–multi-sensor fusion, artificial intelligence, digital twins, cloud interoperability, cybersecurity and international deployment–drawing on practices across Europe, North America, Asia, Africa and Latin America.
6.1 Multi-sensor fusion
The underlying technical characteristics of fifth-generation multi-sensor systems are described in Section 2.4. The present section does not repeat that architecture but focuses instead on the innovation trajectory, calibration implications and interoperability requirements associated with large-scale deployment.
Multi-sensor fusion integrates complementary sensing modalities–infrared (temperature), acoustic (early bearing distress), vibration (structural dynamics) and environmental probes–into unified detection logic. This approach reduces false positives and improves early detection by combining evidence from distinct failure modes, though it entails higher complexity, calibration demands and cost. This principle is well documented in railway condition-monitoring research (Bracciali & Bucca, 2016; Papaelias et al., 2016) and in broader structural-health monitoring literature (Barke & Chiu, 2005).
Conventional infrared-only detectors, while robust, are vulnerable to environmental interference and spurious alarms caused by disc-brake heating or reflections. Hybrid systems overcome these limitations by corroborating thermal data with acoustic or vibration signals and, increasingly, by co-locating HABD with other wayside systems such as WILD and ALC.
Current research is advancing AI-driven data fusion, scaling fibre-optic sensors and standardising interfaces to ensure interoperability across national and cross-border platforms. Pilot deployments in Europe, North America, Asia and Australia confirm that fifth-generation HABD/HWD will rely less on single-sensor thermography and more on integrated, multi-modal evidence to deliver trusted alarms in diverse operating environments.
However, without standardised interfaces and common data formats, multi-sensor systems risk becoming siloed solutions. Interoperability at the international level therefore requires not only technological advances but also governance mechanisms ensuring that output from different sensor families remains comparable and exchangeable across networks.
6.2 Artificial intelligence and edge analytics
The second innovation vector is the application of machine learning (ML) directly at the wayside cabinet. Traditional HABD logic is deterministic: an alarm is raised if absolute temperature or ΔT thresholds are exceeded. This ensures transparency but fails to capture anomalies that remain below thresholds yet deviate from normal operating patterns.
The technical basis for ML-based bearing diagnostics is solidly supported in the literature (Cai et al., 2020; Jia et al., 2016), and deep learning fusion models for bearing faults are well established.
AI models trained on historical datasets–covering thousands of train passages–can now flag these “sub-threshold anomalies” as suspicious events, prompting ECMs to investigate during scheduled maintenance.
In Europe, Network Rail has trialled edge analytics on HABD portals, reducing false positives by ∼30% compared with rule-only logic.
In North America, Class I railroads are developing AI models that adapt thresholds dynamically to ambient and train-specific conditions, reducing nuisance stops caused by disc-brake heating.
In India, the national EHMS project is experimenting with cloud-based AI classifiers to handle the enormous volume of alarms generated daily across more than 900 HABD sites.
The critical innovation is edge computing: by processing data locally, bandwidth requirements are reduced, latency is eliminated and alarms are transmitted already filtered, with confidence scores attached. Transparency is preserved by recording both AI outcomes and rule-based alarms for regulatory audit.
However, the application of AI in safety-critical systems is not without risks. Machine-learning models may introduce bias, generate non-transparent outputs or even misclassify anomalies (hallucinations), which could undermine confidence in alarm validity. For this reason, periodic audits of the models are essential, including version control, independent validation against shop-find data and the preservation of parallel rule-based logic for cross-checking. Regulatory acceptance will ultimately depend not only on demonstrated performance but also on explainability and traceable governance of the algorithms employed.
6.3 Digital twins and predictive maintenance
A third vector is the integration of HABD/HWD data into digital twin models of rolling stock and infrastructure. Rather than treating alarms as isolated events, digital twins allow condition data to be contextualised within a virtual replica of the vehicle or subsystem (see Figure 4).
 The flowchart shows a linear data flow between three connected components. The left rounded text box labeled “Train (Sensors: I R, acoustic, vibration, R F I D)” is shown. A right-pointing arrow connects this box to a central rectangle labeled “Cloud Data Platform”. Another right-pointing arrow from the central rectangle connects to a rounded rectangle on the right labeled “Digital Twin (Virtual Train Model)”.
Conceptual representation of a digital twin for HABD/HWD. Source: Authors’ own work, drawing on international pilots referenced in Sections 6.1–6.3
The flowchart shows a linear data flow between three connected components. The left rounded text box labeled “Train (Sensors: I R, acoustic, vibration, R F I D)” is shown. A right-pointing arrow connects this box to a central rectangle labeled “Cloud Data Platform”. Another right-pointing arrow from the central rectangle connects to a rounded rectangle on the right labeled “Digital Twin (Virtual Train Model)”.Conceptual representation of a digital twin for HABD/HWD. Source: Authors’ own work, drawing on international pilots referenced in Sections 6.1–6.3
Japan's JR-East links HABD measurements with Train Control and Monitoring Systems (TCMS), creating real-time health dashboards for Shinkansen fleets. Sub-threshold temperature increases are tracked against axle and bearing histories, enabling planned interventions before failure.
China Railway is piloting multispectral infrared arrays feeding into national Big Data platforms. Combined with fleet records, these datasets support predictive simulations of degradation pathways across thousands of kilometers.
Australia is trialling “whole-of-fleet digital twins” for iron-ore trains in the Pilbara, integrating HABD, WILD and vibration data into models that predict wear progression under 40,000 t gross loads.
For ECMs, digital twins transform HABD alarms into lifecycle intelligence: repeated marginal events trigger bearing replacement based on actual condition rather than mileage intervals, reducing costs while improving safety.
The integration of HABD/HWD data into digital twins follows the broader trend of virtualised railway systems (Ding et al., 2019) and global big-data applications in transport (Ghofrani, He, Goverde, & Liu, 2018).
6.4 Cloud-ready interoperability and cross-border data exchange
A persistent barrier to effective HABD/HWD use is fragmentation of alarm rules across borders. The European Hotbox Monitoring System (EHMS) project has pioneered standardised alarm payloads, including: site ID, vehicle ID (AVI/RFID), corrected temperatures, ΔT values, environmental context and alarm classification. These payloads can be transmitted via cloud APIs to neighbouring IMs, ensuring continuity for cross-border trains.
This approach is no longer limited to Europe.
In North America, the AAR is developing common interchange protocols to allow hotbox alarms generated on one railroad to be trusted by another, reducing redundant inspections.
In China and India, national cloud systems already consolidate HABD alarms across vast networks, with near-real-time distribution to regional OCCs.
Pilot initiatives in South America (Brazil and Mexico) are beginning to link HABD portals with cloud-based monitoring dashboards accessible to both IMs and RUs.
In Asia, JR-East has begun integrating HABD data with Shinkansen TCMS and digital twin platforms, while China Railway is trialling multi-spectral infrared arrays and AI classifiers at national scale. These pilots confirm that fifth-generation systems are already operationally tested outside Europe and North America. China's and India's cloud-integrated national monitoring architectures are consistent with documentation from CARS (2019) and Indian Railways (2022).
Cloud-ready interoperability has three benefits: it reduces duplication, accelerates operational response and provides regulators with structured datasets for safety oversight.
Yet achieving this vision depends on agreed payload schemas and interface standards. Without them, the proliferation of proprietary solutions could undermine the very goal of cross-border interoperability.
6.5 Cybersecurity and data integrity
As HABD/HWD become digital nodes on multiservice networks, cybersecurity has become a core RAMS concern. Alarms must be trusted not only technically but digitally. Best practice now includes.
Encryption and VPNs: ensuring data from trackside to OCC is protected against interception.
Role-based access control (RBAC) and multi-factor authentication for maintainers accessing HABD cabinets or cloud portals.
Cryptographic signatures and hashing applied at the point of capture, guaranteeing that thermal data and images cannot be altered in transit.
IEC 62443 and ISO 27001 compliance: already mandatory for some European IMs, increasingly adopted in Asia and North America.
Annual penetration testing and audit logs integrated into the Safety Management System.
These measures guarantee that HABD/HWD alarms are not only operationally credible but also legally defensible, an essential requirement as safety authorities rely on digital evidence in investigations.
The importance of cyber-secure alarm evidence is reinforced in derailment-prevention guidance (UIC, n.d.).
6.6 Global perspective on innovation
The innovation trajectory is clearly global, not regional.
India: scale and centralised EHMS architecture.
South Africa: hybrid HABD + acoustic detectors for heavy-haul manganese and coal trains.
Latin America: Brazil's Vale and MRS deploy HABD at mine and port entry points, often in extreme environments; Mexico's Ferromex integrates detectors into cross-border freight management.
Australia: heavy-haul iron-ore corridors linking HABD with fleet digital twins under extreme loads.
Japan and China: integration of HABD into national digital railway strategies, with predictive dashboards and multispectral sensors (CARS, 2019)
These diverse practices confirm that while specific deployment logics vary, the innovation trajectory is converging towards multi-sensor, AI-enabled, cloud-connected, cybersecure and internationally interoperable detectors. HABD/HWD are thus evolving from narrow safety devices into strategic components of global railway digitalisation and resilience.
Global pilots in Europe, North America, Asia and Australia confirm that AI, digital twins, multi-sensor fusion and robust cybersecurity are reshaping the future of HABD/HWD.
7. Discussion
The preceding sections established what HABD/HWD are, how they are deployed internationally, how they should be operated and maintained, what they cost and return and where technology is heading. This discussion synthesises those strands into actionable insights for IMs, RUs, ECMs and regulators, highlighting the practical trade-offs, governance choices and policy levers that determine outcomes on real networks.
7.1 Balancing safety and operational resilience
A persistent tension underpins HABD/HWD use: minimising derailment risk versus containing operational disruption. The balance is shaped by thresholds, confirmation logic and on-the-day decisions in the OCC. The risk-management approach aligns with international safety frameworks such as low as reasonably practicable (ALARP) and ERA's common safety method for risk evaluation and assessment (CSM-REA; ERA, 2020) and with derailment prevention studies (D-RAIL Project, 2014; SUSTRAIL Project, 2015).
Risk philosophy (ALARP): Treat HABD/HWD as barriers in the derailment risk bow-tie. Targets commonly adopted are detection effectiveness ≥95%, nuisance rate ≤5% of alarms, MTTA (mean time to acknowledge) ≤5 min on main lines.
Threshold strategy:
Conservative (lower absolute and ΔT thresholds): maximises capture probability but increases stops.
Permissive (higher thresholds, stricter confirmation): lowers disruption but risks late capture of fast-developing faults.
Balanced/hybrid (absolute + differential + ambient correction): generally optimal for mixed traffic.
Operational playbook: codify three responses tied to alarm levels and geography:
Continue under monitoring with speed restriction.
Controlled stop at next siding or platform.
Immediate stop before high-consequence exposures (e.g. long tunnels, major viaducts, dense urban areas).
Confirmation mechanics: dual-site confirmation where practicable; if not, use evidence packages (thermal frame, CCTV still, AVI/RFID, ambient) and, where available, cross-signal corroboration (e.g. WILD impact anomaly on same axle/wheelset).
Corridor classes: define A/B/C corridors by consequence (hazardous goods, HSR, heavy-haul). Apply progressively tighter thresholds and shorter decision windows moving from C→A.
7.2 Economic sustainability
Positive cost–benefit ratios are achievable and were demonstrated, but they are not automatic; they depend on execution. The value levers described are consistent with maintenance optimisation evidence from Network Rail (2021) and predictive maintenance literature (Ding et al., 2019).
The influence of multi-sensor fusion and AI on ROI aligns with international benchmarking (UIC, 2025a).
Value levers:
Multi-sensor portals (HABD + WILD + ALC ± acoustic/vibration): higher CAPEX, lower lifetime unit cost per credible alarm through false-positive suppression.
AI/edge filtering: 20–30% reduction in unnecessary interventions; lowers delay minutes and inspection costs, improving CBR by ∼0.2–0.3 points in typical portfolios.
OCC discipline: consistent decision trees reduce variance in disruption costs; MTTA and mean time to clear (MTTC) are primary financial drivers.
CMMS/ECM integration: converts alarms into planned work orders; reduces premature bearing replacements (often 15–20%), lifts fleet reliability.
Contracting models:
Classic CAPEX + OPEX.
Availability-based service contracts (KPIs on uptime, nuisance rate, evidence quality).
Outcome-based (bonus/penalty on network delay minutes attributable to detector alarms).
Portfolio economics: economies of scale in calibration labs, spares pooling, cyber tooling. Staged roll-out mitigates budget spikes while building evidence to refine thresholds.
7.3 Harmonisation versus local adaptation
International traffic demands common rules; geography demands local nuance.
Minimum common core (harmonise):
Alarm taxonomy (warning/alert/critical) and minimum data elements (site ID, vehicle ID, T, ΔT, ambient, confidence).
Evidence package format and retention policy (for audits and cross-border trust).
Competence profiles (OCC analysts, field technicians) with mutual recognition across IMs.
Local optimisation (adapt):
Ambient/seasonal correction tables, brake-type modifiers, gradient/curvature siting rules.
Desert, alpine or tropical operating envelopes (solar glare shielding, snow/ice accretion management, vegetation control for optics).
Governance instrument: corridor-level MoUs (e.g. heavy-haul, HSR international) setting out payloads, response equivalence and hand-over rules for trains crossing boundaries.
Several of these issues remain unsettled today and will only be resolved through cross-border agreements.
Ultimately, convergence should not imply uniformity. While a common core of alarm taxonomies, data payloads and competence profiles is necessary, climate conditions, rolling stock diversity and operational philosophies will continue to justify local adaptations. The role of international standards is therefore to provide a trusted baseline, while leaving scope for RU/IM agreements to define context-specific adjustments (UIC & DB Netz AG, 2020).
7.4 Integration into digital railway strategies
HABD/HWD are no longer stand-alone; they are data services inside an enterprise architecture.
Reference architecture:
Field/edge (sensors, local health monitoring, AI classifiers).
Secure comms (MPLS/LTE/5G with VPN, RBAC).
Platform (data lake/stream, digital twin, API gateway).
Applications (OCC dashboards, ECM/CMMS, analytics, regulatory reporting).
Interoperability: adopt cloud-ready APIs and a common event schema (EHMS-style) so neighbouring IMs can trust and action alarms in near real-time.
Safety management system (SMS) linkage: close the loop–alarm → operational action → maintenance action → feedback into thresholds/models; evidence flows into incident learning and periodic safety reviews.
PTC/ATP/ATO adjacency: maintain advisory separation (HABD/HWD not vital), but feed decision support to drivers/dispatchers where permitted to shorten reaction times.
Standardisation of data formats and APIs is thus not merely technical housekeeping but the precondition for scalable, vendor-independent interoperability across corridors.
7.5 Policy and socio-economic implications
The business case is wider than prevented derailments.
Passenger market impacts: higher punctuality and fewer severe disruptions strengthen public trust and reduce compensation liabilities; supports modal shift on HSR/intercity.
Freight competitiveness: reliable corridors for hazardous goods and bulk commodities underpin supply-chain resilience and reduce diversion to road (RISSB, 2022).
Safety valuation: integrate Value of Preventing a Casualty (VPC) and environmental damage (hazmat containment) in appraisals; these often tip marginal schemes into viability.
Funding & incentives: regulators can recognise HABD/HWD within safety improvement funds or allow accelerated depreciation; corridor-level co-funding where benefits spill over multiple IMs/RUs.
Skills & industry development: competence frameworks, calibration labs and cyber capabilities create local supplier ecosystems and long-term capability, not just assets.
7.6 Future challenges and countermeasures
False positives on legacy IR: retire/retrofit with multi-sensor + ambient correction; deploy geo-specific tuning and dual-site confirmation on critical corridors.
Model governance (AI): version control, explainability artefacts, periodic re-training with ground-truth labelling from shop-finds; keep rule-based path in parallel for auditability.
Cybersecurity exposure: IEC 62443/ISO 27001 controls, MFA for remote access, signed data at capture, periodic penetration tests; treat cyber as part of RAMS.
Obsolescence & REPEX: plan 7–10-year technology refresh cycles (sensors/comms) and budget REPEX at 20–30% of CAPEX; modular enclosures ease upgrades.
Data ownership & sovereignty: clarify who owns alarm/evidence data and under what legal or contractual terms it is shared across borders; embed these provisions in corridor MoUs, regulatory frameworks or procurement contracts, recognising that data sovereignty rules may otherwise become a barrier to interoperability.
Power/comms in remote areas: hybrid energy (grid + solar), store-and-forward buffering, periodic backhaul via passing trains or satellite where terrestrial links are weak.
Standardisation gaps: converge on payload schemas, minimum siting criteria and competence recognition; use corridor pilots as pathfinders to de-risk widescale adoption.
7.7 Synthesis and recommended roadmap
What we know: HABD/HWD are technically mature, operationally effective and economically positive when embedded in disciplined O&M and digital ecosystems. Multi-sensor + AI reduces nuisance and increases confidence; cross-border APIs unlock network value.
In practice, multi-sensor configurations typically combine infrared measurements with acoustic bearing signatures and vibration indicators. AI algorithms applied at the edge commonly include supervised classifiers trained on labelled thermal and vibration datasets, as well as anomaly-detection models that identify deviations from normal operating patterns before threshold exceedance. These methods jointly reduce false positives and increase diagnostic confidence compared with infrared-only systems.
What to do next (12–36 months):
Pathfinder corridors (one passenger, one freight/heavy-haul) to prove harmonised payloads and joint response rules.
Deploy multi-sensor portals at high-consequence locations with dual-site confirmation before tunnels/viaducts.
Stand-up OCC playbooks with KPI boards (effectiveness, nuisance, MTTA/MTTC) and quarterly threshold reviews.
Integrate with CMMS/ECM and create a digital twin pilot for one fleet; measure avoided failures and premature replacements.
Establish competence portability agreements and a shared calibration protocol across participating IMs.
Implement a cyber-hardening programme proportionate to risk (VPN, RBAC, MFA, signed telemetry, pen-tests).
Strategic end-state: HABD/HWD function as interoperable, cyber-secure, multi-sensor data services that support predictive maintenance and consistent operational decisions across borders–delivering measurable gains in safety, punctuality and socio-economic value.
Harmonisation and competence portability are essential to unlock international interoperability while preserving local adaptation to geography and traffic mix.
8. Conclusions
HABD/HWD have evolved from isolated thermal sensors into integral components of the digital railway ecosystem. The combined insights from benchmarking, operational practice, cost–benefit analysis and strategic discussion lead to several overarching conclusions, consistent with evidence from UIC Network Monitor Phases 1–3 (UIC, 2024; UIC, 2025a; UIC, 2025b), international standards (ERA, 2020) and derailment studies (D-RAIL Project, 2014; SUSTRAIL Project, 2015).
The strategic implications can be summarised across five domains (see Figure 5): Safety-relevant and not optional. HABD/HWD systems prevent a measurable share of derailments and overheating-related incidents. Even under conservative assumptions, they avert several derailments annually in Europe, depending on traffic mix and deployment density, reducing fatalities, damage and disruption. Their role is not auxiliary but central to modern railway safety assurance.
 The flowchart shows a structured list of system benefits presented in five stacked sequential sections. The top rounded box is labeled “Safety: Early-warning systems prevent derailments” and marked with a red circular marker on the left. Below it, another overlapping rounded box is labeled “Economy: C B R 1.6 to 2.1, strong R O I on key corridors”, marked with a green circular marker. Further down, another overlapping rounded box is labeled “Innovation: 5th gen: A I, multi-sensor, digital twins”, marked with a blue circular marker. The next overlapping rounded box is labeled “Harmonisation: Common thresholds and competence portability”, marked with an orange circular marker. At the bottom, the overlapping rounded box is labeled “Socio-economic: Protects passengers, freight and environment”, marked with a purple marker. Each marker is aligned on the left side of each box.
Key messages-HABD/HWD. Source: Authors’ own work
The flowchart shows a structured list of system benefits presented in five stacked sequential sections. The top rounded box is labeled “Safety: Early-warning systems prevent derailments” and marked with a red circular marker on the left. Below it, another overlapping rounded box is labeled “Economy: C B R 1.6 to 2.1, strong R O I on key corridors”, marked with a green circular marker. Further down, another overlapping rounded box is labeled “Innovation: 5th gen: A I, multi-sensor, digital twins”, marked with a blue circular marker. The next overlapping rounded box is labeled “Harmonisation: Common thresholds and competence portability”, marked with an orange circular marker. At the bottom, the overlapping rounded box is labeled “Socio-economic: Protects passengers, freight and environment”, marked with a purple marker. Each marker is aligned on the left side of each box.Key messages-HABD/HWD. Source: Authors’ own work
Operational discipline determines value. The economic and safety benefits demonstrated in the CBA are sustainable only when detectors are operated within robust rulebooks, maintained through traceable calibration and governed by competence frameworks. False-positive suppression, OCC decision trees and ECM closure processes are decisive in protecting the business case.
Economically justified under risk-based deployment. When deployed on high-risk corridors – heavy-haul freight lines, high-speed passenger services, long tunnels, viaducts and hazardous goods routes – HABD/HWD consistently deliver positive cost–benefit ratios (typically 1.6–2.1), with higher values observed on heavy-haul and hazardous-goods corridors (1.8–2.1) and slightly lower but still positive ratios on high-speed passenger lines (1.6–1.9). Multi-sensor portals with WILD and ALC increase upfront CAPEX but outperform in lifecycle economics due to reduced nuisance alarms and enhanced diagnostic value.
Technological trajectory is clear. The transition towards fifth-generation systems – multi-sensor fusion, AI-enabled filtering, digital twins and cloud-ready interoperability – is already underway. These innovations promise earlier detection, lower false positives and integration with predictive maintenance, transforming HABD/HWD from reactive alarms to proactive asset management tools.
Harmonisation is a precondition for interoperability. The current diversity in thresholds, alarm logic and response protocols undermines international trust and efficiency. UIC's IRS 70729, EHMS data exchange and ERA's CSM-REA provide the foundations for convergence. Achieving alignment on alarm taxonomies, data payloads and competence recognition is essential for cross-border corridors.
Socio-economic impacts go beyond derailment prevention. By reducing disruption, HABD/HWD protect passenger confidence, freight competitiveness and supply-chain reliability. They contribute to climate resilience by reducing incident-related delays and support modal shift objectives by making rail safer and more reliable.
These conclusions consolidate the technical, economic and operational evidence presented across the study and position HABD/HWD as essential components within digitalised, interoperable and risk-based railway safety strategies.
HABD/HWD are not just safety devices but strategic enablers of predictive maintenance, network resilience and socio-economic sustainability.
HABD and HWD are no longer emerging technologies but established components within modern railway safety and condition-monitoring architectures. Their continued development and progressively harmonised deployment contribute to improving operational resilience and reducing overheating-related risks across diverse network types. When integrated within digital maintenance platforms and aligned operational rulebooks, these systems support more consistent decision-making and enhance the effectiveness of predictive maintenance practices. As international frameworks mature, HABD/HWD are expected to play an increasingly important role in transforming thermal failures from largely unpredictable events into risks that can be systematically monitored and mitigated.

