

This study aims to capture the dynamic characteristics of customer experience in rural homestays through online reviews and to assess how customer experience dimensions evolve over time. The goal is to promote the sustainable development of rural homestays and to offer innovative approaches for research in this domain.
A dynamic assessment framework was developed using online review data sourced from Ctrip.com. The framework integrates natural language processing, machine learning and time series analysis to identify long-term trends and temporal fluctuations.
Rural-specific personalized service, rural living comfort, scenic-area-oriented convenience, rural experience value perception and local culinary experience are key dimensions influencing customer experiences in rural homestays. The consequences of these dimensions for customer experiences exhibit dynamic characteristics that potentially fluctuate over time and demonstrate varying practical effects on the utility of customer experiences.
By incorporating experience economy theory and dynamic capability theory, this study establishes a theoretical framework for examining rural homestay experiences. It mines real customer experience dimensions from unstructured texts (e.g. online reviews) and applies time series analysis to track evolving patterns. This enriches theoretical research on the experience economy and broadens the application of dynamic capability theory in tourism contexts.
1. Introduction
In recent years, rural homestays [1] have become central to rural tourism, offering unique host–guest interactions and immersive cultural experiences (Wang et al., 2018b). Especially after the pandemic, rural homestays have emerged as a popular option for tourists seeking refuge from urban environments (Wu et al., 2024).
While researchers have explored rural homestays through online reviews on Airbnb (Cheng and Jin, 2019; Lee and Kim, 2023; Luo and Tang, 2019), most studies have focused on static characteristics (Ju et al., 2019; Li et al., 2023; Tao et al., 2024; Leick et al., 2024; Peng et al., 2024). For example, Cheng and Jin (2019) examined how perceived mental health risks influence rural revisit intentions using a survey related to the COVID-19 pandemic. Dai et al. (2025) applied structural equation modeling to assess the impact of rural homestay experience on tourist loyalty in sustainable development. However, customer experience is inherently dynamic, shaped by evolving contexts, environments and consumer needs, especially in the context of rural homestays, which are dependent on scenarios and interactions. For instance, demand for customized services surged during the COVID-19 pandemic, while comfort emerged as a dominant concern in the postpandemic era. This shift in priorities has not been sufficiently examined in the literature.
Most existing studies have relied on static methods, such as small-sample data surveys, which fail to capture demand fluctuations during external shocks like pandemic (Lemon and Verhoef, 2016). Few studies have assessed how the utility of customer experience evolves over time, particularly through time-series analysis of unstructured online review data. To address this gap, this study involved the construction of a dynamic assessment framework of rural homestay customer experience utility rooted in experience economy theory and dynamic capability theory. This framework identifies key experience dimensions and tracks their temporal patterns.
A comprehensive analysis of 30,350 online reviews of Hongcun was conducted to identify the fundamental dimensions that influence the customer experience of rural homestays. This analysis also revealed the dynamic characteristics of the experience utility of these dimensions across various temporal stages. The analytical process included natural language processing (NLP) for data preprocessing, machine learning (ML) (XGBoost) to validate dimension representativeness and time-series analysis – specifically the Autoregressive Integrated Moving Average (ARIMA) model – to uncover temporal trends. The contributions of this study are twofold:
It introduces a dynamic assessment framework based on online reviews, offering a methodological alternative to static approaches.
It provides data-driven insights for rural homestays to optimize resource allocation, promote dynamic iteration of industry standards, manage risk and identify new development opportunities.
2. Literature review
2.1 Rural homestays
With personalized accommodation at their core, rural homestays have become integral to global rural tourism and differ markedly from traditional hotels (Kunjuraman and Hussin, 2017). Typically located in rural or scenic areas, they offer a retreat from urban life and an opportunity to experience nature (Han, 2019). Rural homestays’ characteristics vary globally: Southeast Asian homestays often rely on the local rich natural resources to attract tourists but lack infrastructure and offer only simple accommodations (Kunjuraman and Hussin, 2017). Mura (2015) studied rural boarding families in Malaysia through blogs and online interviews, highlighting the varying types of boarding families in different countries. In contrast, farmstays and bed and breakfasts (B&Bs) accommodations in Europe offer home-based accommodations that blend a warm, homely atmosphere with personalized service and an emphasis on on-site experiences (Aiello et al., 2020; Frochot, 2005).
Rural homestays leverage natural and cultural assets, offering distinctive architectural styles and rural lifestyles. Beyond lodging, they allow visitors to gain insights into local culture and become integrated into the fabric of local communities (Mura, 2015). Rural homestays also promote local economic development and the preservation of rural culture. With growing interest in rural tourism and sustainability both in China and internationally, research on rural homestays has expanded globally.
The development of digital technologies for analyzing large data sets has transformed the research paradigm for homestays (Cheng and Jin, 2019). Contemporary studies have focused on diverse experiences (Asyraff et al., 2024; Liu et al., 2022b), host–guest interactions (Dai et al., 2024; Wang et al., 2018a), marketing strategies (Lu et al., 2022; Nieto et al., 2014), homestay satisfaction (Wang et al., 2024) and dimensions of hospitality in rural homestays based on online review analysis (Qiu et al., 2024). Notably, international research has explored similar topics, including cultural differences in host–guest interactions by European scholars (Pizam et al., 2000) and the role of community-participatory homestays in postepidemic recovery in Southeast Asia (Kunjuraman and Hussin, 2017; Sari et al., 2022). Compared to traditional accommodations, Chinese rural homestays exhibit unique characteristics in terms of service content, operational models and business features. In-depth research on this niche market can provide both practical insights and theoretical contributions to the global rural homestay literature. As online reviews have become a primary channel for customers to share their experiences, analyzing unstructured textual data offers new possibilities for understanding consumer experiences in rural homestays worldwide.
2.2 Rural homestay online reviews
The tourism and hostelry sector has undergone significant changes due to advancements in network communication technologies and the emergence of consumer-focused service philosophies (Buhalis and Law, 2008). Among these changes, the growing prevalence of independent travel is especially notable, with decision-making gradually shifting from travel agencies to individual travelers (Wu and Zhao, 2022). In today’s internet-driven environment, consumers increasingly share their perceptions and experiences of products and services through online platforms (Wu and Zhao, 2022). At the same time, many rely on online reviews to reduce uncertainty during purchase decisions (Arici et al., 2023), using other consumers’ firsthand accounts to assess the authenticity and reliability of product or service information (Guo et al., 2017).
Compared to conventional questionnaires, online reviews – as unstructured, user-generated content – can more comprehensively reflect customers’ evaluations and minimize subjective interference in data collection (Xiao et al., 2024). As such, they offer greater potential for understanding customer consumption experiences.
Online reviews are considered a reliable source for understanding customer preferences, the quality of experiences and service expectations (Calderón-Fajardo et al., 2024; Contessi et al., 2024; Moreno‐Brito et al., 2024). In tourism and hostelry research, analyzing customer experiences and preferences through online reviews is now common practice. However, studies specifically focusing on online reviews of rural homestays remains scarce. Nieto et al. (2014) studied rural homestays in Spain to examine the impact of marketing decisions (e.g. pricing and advertising) on customer word of mouth and its influence on homestay performance. Melo et al. (2016) gathered online reviews and visualization data from information media websites to study online reviews, commercial online visibility and its consequences for rural homestay establishments. Fanelli (2019) conducted an empirical study investigating how prices and features relate to tourist evaluations. Qiu et al. (2024) used a mixed-method approach with big data technology to extract four dimensions of hospitality from rural homestay reviews.
While these pioneering studies are valuable, no research to date has examined how online review data can be used to assess the utility of rural homestay customer experiences – or how such analysis might drive the evolution of those experiences.
2.3 The utility of customer experience in rural homestays
The degree to which a customer experience is considered useful is widely regarded as a key indicator of a rural homestay’s attractiveness and competitiveness (Wang et al., 2024). According to Pine and Gilmore’s (1998) experience economy theory, customer experience refers to subjective feelings and satisfaction customers derive during the purchasing process. It emphasizes the psychological state of the customer at the time of consumption (Kahneman and Thaler, 2006), encompassing not only their perception of the product or service but also a multilevel emotional process. The theory posits that there are four dimensions of experience: entertainment, education, esthetics and escapism. In the rural homestay context, these dimensions manifest as sensory, emotional, social and cultural experiences (Wang et al., 2024). These dimensions interact to shape an overall evaluation of experience utility, which customers assess by weighing benefits against costs (Zeithaml, 1988), ultimately affecting their satisfaction and loyalty.
Previous research has examined these dimensions in homestay contexts. Experience utility comprises the key attributes of customer interactions and feelings throughout the homestay journey (Lemon and Verhoef, 2016). Sensory experiences include visual, auditory and olfactory perceptions of the accommodation environment – for instance, architectural style, interior decoration, bedding comfort and surrounding landscapes (Peng et al., 2024; Tussyadiah and Zach, 2016). Emotional experience captures feelings such as joy, relaxation and surprise during the stay (Liu et al., 2022b) and has been shown to directly affect satisfaction and affinity for rural homestays. Cultural experience involves the deep integration of rural homestays with local culture through displays of traditional culture, folk activities, handicrafts and local cuisine, enhancing customers’ cultural identity and engagement (Cui et al., 2024). Social experience involves interactions among guests, hosts and local residents (Wong and Chan, 2023), which can foster emotional attachment to homestays and significantly influence satisfaction, especially in homestays emphasizing community engagement.
Although existing research has outlined these dimensions, most studies have relied on questionnaires or small-sample data (Wang et al., 2024), failing to capture the dynamic characteristics of experience utility. Specifically, they have often used cross-sectional data, conceptualizing customer experience as a static outcome and disregarding the temporal dimension (Teece et al., 1997). This methodological shortcoming hinders the capacity to understand the dynamic patterns of customer experience over time. Due to limitations in sample sizes and research settings, measurements based on psychological scales may fail to capture customers’ actual experiences (Lashley, 2008).
To address these gaps, this study draws on 30,350 online reviews to capture both real-time changes and long-term trends in customer experience. Using NLP and ML, we extract and validate customer experience dimensions from unstructured text. Finally, by integrating time series analysis, we systematically explore the dynamic mechanisms of customer experience utility in rural homestays.
2.4 Time series analysis
According to dynamic capabilities theory, organizations must sense market changes and reconfigure resources to adapt to environmental changes to maintain competitiveness (Teece et al., 1997). Service-dominant logic also highlights that customers are pivotal contributors to value cocreation. However, extant research has predominantly focused on customers’ immediate feedback on services, overlooking the long-term evolution of their experience evaluation. Consequently, long-term dynamic evaluation of customer experience utility is of particular importance in the field of tourism services.
Time series analysis, as a core approach to dynamic evaluation, is primarily applied in the tourism and hospitality sectors for the following scenarios:
In the field of tourism, Gunter and Önder (2015) used multicity monthly panel data to forecast international tourism demand, thereby unveiling patterns in tourism demand evolution through comparative model accuracy. Concurrently, Song and Zhang (2025) used a method based on a layered spatiotemporal network to reveal that the environmental impacts of tourism activities exhibit significant temporal dependency and nonlinear characteristics. Xu et al. (2024) developed a postpandemic tourist volume forecasting framework to support the sustainable recovery of the tourism industry.
In the hospitality industry, time series analysis is typically used for occupancy rate forecasting. For instance, Pan and Yang (2016) accurately predicted occupancy rates by integrating multiple big data sources, helping hotels optimize their operational strategies. Furthermore, Zhang et al. (2017) used a combined approach of Ensemble Empirical Mode Decomposition and ARIMA models to achieve efficient forecasting of daily hotel occupancy rates. Tian et al. (2023) proposed a multidimensional hybrid evaluation prediction model (Md-Pred) for forecasting hotel order cancellations, enhancing decision support in hotel operations management. However, while these studies offer valuable insights for operational optimization in the hospitality industry, research on the dynamic evolution of accommodation experience dimensions remains relatively scarce (Dimitrovski et al., 2024; Liu et al., 2022a). Consequently, this study endeavors to address this research gap by using time series analysis, thereby offering new theoretical perspectives and practical guidance for the field.
In this study, we divided the review data into T1–T3 stages based on macroenvironmental changes (rather than equal intervals), aligning with the phased recovery characteristics of rural tourism (Asyraff et al., 2024). We converted utility values of experience dimensions into time series to overcome the limitations of conventional scoring methods (Choi et al., 2024). Violin plots were used to simultaneously visualize the mean trend and degree of dispersion, addressing the shortcomings of line plots in expressing distributional heterogeneity (Tanious and Manolov, 2022). In addition, we used the ARIMA model to quantitatively analyze these patterns, demonstrating the rigor of the time series approach. To the best of our knowledge, this study is the first to use text mining outputs as inputs for time series analysis, offering a scalable framework for dynamically assessing rural homestay experiences (Kong and Lou, 2023).
3. Methodology
3.1 Research background
Hongcun, located in Yixian County, Huangshan City, Anhui Province, is a traditional village with over a thousand years of history and is renowned as the “Village in a Painting.” At the beginning of the 21st century, it was added to the United Nations Educational, Scientific and Cultural Organization (UNESCO) World Heritage List. The selection of Hongcun as a research case (Chen et al., 2024) was primarily based on two main considerations. First, Hongcun is a national AAAAA-level tourist attraction, known for its distinctive natural scenery and rich cultural heritage. It has been named one of the “Top Ten Favorite Ancient Towns for Foreign Visitors.” In 2023, the Hongcun scenic area received 3.3 million visitors, generating RMB14.9bn in tourism revenue. Second, Hongcun is one of the birthplaces of Hui culture, and its deep historical and cultural significance enhances the appeal of local homestays.
3.2 Data sources and preprocessing
3.2.1 Data sources.
This study used homestay recommendations from Ctrip for Hongcun in Yixian County and selected listings with over 100 reviews for data collection. After screening, 101 homestays were selected, and a total of 32,702 reviews were collected using a Python script (Kwon, 2023). Ctrip automatically filters out invalid or irrelevant reviews, retaining only those deemed helpful for potential consumers, which significantly enhances data quality.
This study divides the data into three time periods. To validate the scientific validity of this segmentation, the Bai–Perron structural break test was applied (results presented in Appendix). This identified two significant breaks: December 2022 (when pandemic restrictions were lifted) and October 2023 (when visitor numbers gradually recovered). These breaks perfectly align with the T1–T3 phase divisions, confirming the segmentation’s validity:
T1: During the pandemic (September 2021–December 2022). This period marks the immediate effects of the COVID-19 pandemic on tourism. It corresponds with the timeline of widespread travel restrictions, lockdowns and sharp declines in tourist activity (Zheng et al., 2025). This period is crucial for analyzing the pandemic’s direct impact on rural tourism and lodging quality.
T2: Early postpandemic (January 2023–October 2023). This period marks the recovery of the tourism industry and is crucial for assessing the speed and effectiveness of rural homestay recovery as well as how new or reemerging trends affect customer experiences.
T3: Restoring the new normal (November 2023–present). During this period, the number of mainland tourists gradually returns to prepandemic stable levels. This phase reflects the recovery of the tourism industry and is essential for evaluating the long-term relevance of customer experience utility in the context of sustained industry recovery.
3.2.2 Data preprocessing.
First, irrelevant comments were removed. The criteria for deletion included non-Chinese comments, comments consisting only of symbols or emojis and overly short comments (containing only a few words). Next, we performed word segmentation and removed stop words by expanding the word segmentation and stop word lists while also eliminating irrelevant location-related terms in the comments, such as “hotel,” “Huangshan” and “homestay.” After filtering noise, we obtained 30,350 valid comments.
Step 1: Jieba word segmentation processing
Jieba is a general-purpose tool for processing text (Bird et al., 2009). Although it is not specifically designed for the lodging industry, its flexibility in handling domain-specific language and large amounts of text makes it a practical choice for interpreting the nuances of customer experiences with rural homestays.
Step 2: Removing stop words
Stop words help reduce redundancy and improve the accuracy of text mining (Pavithra et al., 2024). We used the Harbin Institute of Technology (HIT) stop word list to remove common modal auxiliaries and conjunctions such as “and,” “but” and “yet” from the comments. Location-related terms were also added to the stop word list to further refine the text.
Step 3: Filtering noise
Following stop word removal, the segmented text was further cleaned to eliminate unrelated content such as numbers, non-Chinese words and traditional Chinese characters. This resulted in a refined dataset suitable for further analysis.
3.3 Research design
This study used text mining and big data analytics to explore the utility dimensions of rural homestay customer experiences and their dynamic changes. Due to the timeliness and volume of unstructured customer review data, such texts can capture realtime customer preferences and evolving sentiments, offering deep insights (Kong and Lou, 2023). While existing hospitality research has increasingly adopted a customer perspective, traditional methods often lack the sensitivity to detect subtle, realtime changes in customer perceptions. The innovative research methodology used in this study better aligns with contemporary customer behavior and provides a more nuanced and responsive view of how customer needs are expressed and prioritized over time. The research framework, illustrated in Figure 1, was designed to comprehensively assess rural homestay customer experience utility.
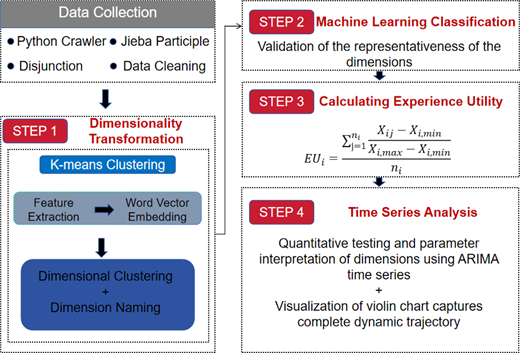
Step 1. Mining rural homestay customer experience attributes
After preprocessing, Term Frequency-Inverse Document Frequency (TF-IDF) values were used to represent the importance of words in the text (Xiao et al., 2022). Word2Vec was then used to convert salient words into word vectors, and K-means clustering was applied to group them into categories.
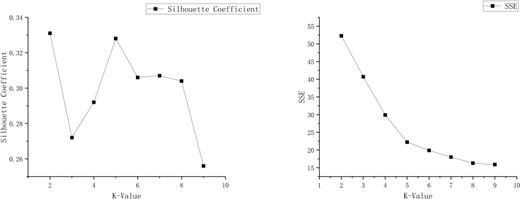
To determine the optimal number of clusters, a combination of the elbow method and the silhouette coefficient was used [2]. The initial K-value range was set from 2 to 9, and evaluation curves were plotted. As shown in Figure 2, silhouette coefficients increase significantly when K-values are set at 2 and 5, while the Sum of Squared Errors within Clusters curve shows a clear inflection at K = 5. This indicates that grouping words into five clusters produces the most meaningful results. Meanwhile, Khan and Fatma (2022) used netnography to extract five key experiential dimensions of star-rated hotels from online travel platforms, demonstrating strong alignment with the K = 5 framework of this study. Furthermore, Tussyadiah and Zach (2016) discovered that personalized service and convenience constitute core differentiators from traditional hotels. These studies further validate the theoretical soundness of the dimensional classification. A systematic qualitative analysis was then conducted to define the five experience dimensions.
Salient words from each cluster were first extracted, and representative comments were analyzed in detail. Understanding of each dimension was refined through iterative discussions, leading to the identification and provisional naming of core themes. To enhance the reliability and validity of the naming process, several tourism experts were consulted. They were provided with lists of salient words, representative comments and preliminary naming suggestions for each dimension. The experts evaluated the rationality and appropriateness of each label. The results of this validation process are shown in Table 1.
Intraclass correlation coefficient
| Evaluation dimension and measurement type | Intraclass correlation | 95% Confidence Interval | Value | F test with true value 0 | |||
|---|---|---|---|---|---|---|---|
| Lower bound | Upper bound | df1 | df2 | Sig | |||
| Rationality | |||||||
| Single measures | 0.729 | 0.378 | 0.961 | 13.647 | 4 | 16 | 0.000 |
| Average measures | 0.931 | 0.753 | 0.992 | 13.647 | 4 | 16 | 0.000 |
| Appropriateness | |||||||
| Single measures | 0.800 | 0.499 | 0.973 | 21.000 | 4 | 6 | 0.000 |
| Average measures | 0.952 | 0.833 | 0.994 | 21.000 | 4 | 6 | 0.000 |
Two-way mixed effects model in which people effects are random and measure effects are fixed
Step 2. Validating dimension representativeness and importance
An ML classification model (XGBoost) was adopted to validate the relevance of the extracted dimensions to the actual customer experience (Li and Managi, 2025). In the model construction stage, the gradient boosting decision tree was used as the base learner. The optimal model configuration was determined through parameter optimization: The number of iterations (n_estimators) was set to 100 to ensure model convergence, and the learning rate (learning_rate) was set to 0.1 to balance the effectiveness of the training process with the risk of overfitting. For regularization, the L2 penalty term (lambda) was set to 1 to control model complexity, while the L1 regularization term (alpha) was kept at 0 to preserve feature information integrity.
The sampling strategy used full data sampling (subsample = 1), all features (colsample_bytree = 1)and complete node splitting (colsample_bynode = 1) to retain the full distribution characteristics of the data set. The tree structure depth was limited to 10 layers to prevent overfitting, and this configuration was validated as a Pareto optimal solution through grid search.
The experimental design followed standard ML modeling practices. The data set was randomly split into training and testing sets at a 70:30 ratio, and robustness was ensured through fivefold cross-validation. To further confirm the reliability of the extracted dimensions, backpropagation (BP) neural network models with a single hidden layer were also constructed for comparison, using ReLU as the activation function and the Adam algorithm (initial learning rate: 0.001) as the optimizer. Both models were trained using early stopping (patience = 10) to prevent overfitting.
Step 3. Measuring rural homestay customer experience dimensions
Previous destination studies have used term frequency analysis to assess the importance of destination attitudes (Chen et al., 2023). To improve upon this method and avoid biases inherent in analyzing long texts, we used the TF-IDF method to quantify rural homestay customer experience utility. The theoretical foundation was drawn from salience theory (Bordalo et al., 2012, 2013), which posits that individuals focus on information based on its relative salience. In other words, an attribute’s distinctiveness within a reference system directly influences its weight in decision-making.
TF-IDF captures this salience by combining local immediate saliency (TF) with global relative saliency (IDF). This integration accurately reflects the dual mechanisms underlying salience theory, forming a solid basis for utility assessment. The TF-IDF value of each salient word is extracted and mapped to a corresponding dimension based on the clustering results. Finally, equation (1) is used to calculate the actual experience utility:
where denotes the actual experiential utility value for dimension i, denotes the number of significant words under dimension i and denotes the TF-IDF value of the jth significant word in the dimension i. is the normalization of the TF-IDF values, which maps the TF-IDF values of different words to the [0–1] interval to eliminate the difference in magnitude. In this process, and represent the minimum and maximum values of the TF-IDF values within the ith dimension, respectively. The formula retains the capacity to quantify the frequency with which words appear in comments and whether words are unique in the overall anticipation. It also eliminates differences in the frequency of different words through normalization, ultimately aggregating them into a simple average. The resultant visual depiction provides a quantitative basis for dynamic trend analysis.
Step 4. Time-series-based dynamic analysis of dimensions
To fully capture the evolving patterns in customer experience dimensions over time, violin plot visualization was combined with ARIMA time series modeling. This hybrid approach balances intuitive visual description with statistical rigor.
Violin diagrams were used to illustrate the dynamic fluctuations in the distribution of each dimension (Tanious and Manolov, 2022), while ARIMA models were used to quantitatively assess and parameterize trends at each stage, providing a comprehensive view of each dimension’s dynamic trajectory.
4. Results
4.1 Customer experience dimensions
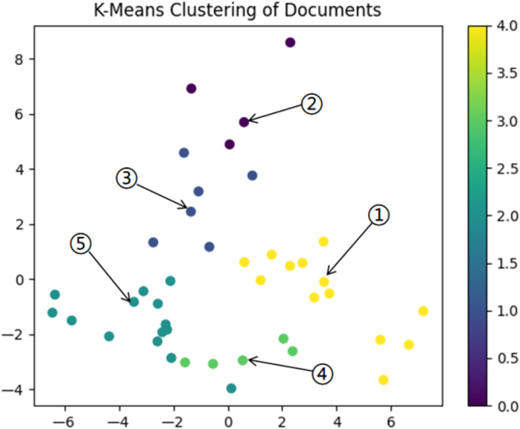
Figure 3 presents the results of K-means clustering. Based on 30,350 online reviews, the study identified five core dimensions of rural homestay customer experience: rural-specific personalized service, rural living comfort, scenic-area-oriented convenience, rural experience value perception and local culinary experience (Table 2). These results partially align with the “sensory experience – emotional experience” framework proposed by Peng et al. (2024), but it further refines the independent dimensions of service interaction (rural-specific personalized service) and utility value (scenic-area-oriented convenience, rural experience value perception). This is especially relevant to the nonstandardized services and localized experiences characteristic of rural homestays (Han, 2019).
Rural homestay customer experience utility dimensions
| Customer experience dimension | Remarkable words |
|---|---|
| Rural-specific personalized service | Service, enthusiastic, transfer, boss, boss lady, luggage, parking lot, help, thoughtful, store, free, service attitude, considerate |
| Rural living comfort | Room, clean, environment, hygiene, facilities, complete, comfortable, tidy, comfortable, decoration, design, warm, style, air-conditioning |
| Scenic-area-oriented convenience | Scenic, convenient, location, geographic location, distance |
| Rural experience value perception | Recommended, experience, satisfaction, worthwhile, value for money, price |
| Local culinary experience | Breakfast, flavor, delicious, restaurant |
For example, the rural-specific personalized service clusters contain words such as “transfer,” “boss” and “help,” which reflect common host–guest interactions in rural homestays. The scenic-area-oriented convenience dimension includes keywords like “scenic distance” and “location,” which are particularly relevant in the context of Hongcun’s designation as a World Heritage Site (Chen et al., 2024).
4.2 Dimensional representativeness validation
Following the extraction of the experiential dimension, the study’s validity was validated. To avoid potential bias from using the same data in both dimension extraction and validation, a “historical dimensions – latest ratings” validation framework was applied. Dimensions were extracted from review texts dated September 2021–September 2024, while review ratings from September 2024 to June 2025 served as the dependent variables in constructing the XGBoost model.
To further mitigate bias caused by closures, new establishments or fluctuations in review volume, only homestays with consistent review data across both time periods were retained, resulting in 86 valid data points.
The model’s performance is shown in Table 3, all of which demonstrate strong classification performance. XGBoost outperformed other models overall. This consistent result across algorithms confirms that the five experience dimensions are representative of rural homestay customer experience and are robust under various modeling assumptions. From a computational social science perspective, these findings affirm that the five core experience dimensions constitute a comprehensive explanatory system for rural homestay customer utility. This provides both a theoretical foundation and practical decision-making guidance for optimizing service design in the rural homestay sector.
4.3 Quantifying customer experience utility
The actual experience utility values for rural homestay customers were calculated using equation (1). The results are presented in Table 4. Across the three time periods (T1–T3), the utility values for each dimension exhibited dynamic changes; however, the magnitude and direction of these changes varied significantly. To further verify the significance of these differences, a one-way analysis of variance (ANOVA) was conducted to test for mean differences across time periods, and standard deviations were calculated to assess the stability of data distribution.
Actual customer experience utility
| Customer experience dimension | T1 | T2 | T3 | F (ANOVA) | p | SD (T1–T3) |
|---|---|---|---|---|---|---|
| Rural-specific personalized service | 0.194 | 0.217 | 0.205 | 4.32 | 0.015* | 0.012 → 0.018 |
| Rural living comfort | 0.181 | 0.224 | 0.235 | 8.76 | 0.001** | 0.015 → 0.010 |
| Scenic-area-oriented convenience | 0.162 | 0.193 | 0.175 | 3.89 | 0.023* | 0.020 → 0.015 |
| Rural experience value perception | 0.082 | 0.1 | 0.101 | 1.24 | 0.291 | 0.008 → 0.007 |
| Local culinary experience | 0.045 | 0.056 | 0.046 | 0.95 | 0.387 | 0.005 → 0.006 |
*p < 0.05, **p < 0.01; standard deviations were calculated separately by time period (T1 to T3)
4.4 Dynamic analysis of customer experience dimensions
While prior studies have identified key indicators influencing rural homestay experiences (Tawfik and Alzahrani, 2024), few have directly modeled changes in customers’ actual experience utility. To capture dynamic trends across dimensions more precisely, this study used ARIMA modeling to quantify the five dimensions, supported by violin plot visualizations.
4.4.1 Model commonality and methodological consistency.
The selection process for the ARIMA model is outlined in Appendix. The stationarity of all dimensions was confirmed through first-order differencing via ADF testing, with a p-value less than 0.05. The order was determined as p = 1, q = 1 based on the ACF/PACF tailing-off characteristics. A comparison of candidate models, such as ARIMA (0,1,1) and ARIMA (1,1,0), revealed that ARIMA (1,1,1) exhibited optimal performance across AIC (447.725–552.917), BIC and Ljung–Box residual tests (p > 0.05). Consequently, this model was adopted uniformly, with the results presented in Table 5.
ARIMA model results
| Dimension | Differential order | ADF test p-value | Model formula | Significance of core parameters | Information guidelines | R² | Q6 (p-value) |
|---|---|---|---|---|---|---|---|
| Rural-specific personalized service | 1 | 0.031** | y(t)=29.575 + 0.447y(t − 1)−1.0ε(t − 1) | AR(1):p = 0.051; MA(1):p = 0.000*** | AIC = 552.917 | 0.535 | 0.633 |
| BIC = 559.138 | |||||||
| Rural living comfort | 1 | 0.002*** | y(t)=32.537 + 0.440y(t − 1)−0.979ε(t − 1) | AR(1):p = 0.296; MA(1):p = 0.311 | AIC = 548.630 | 0.602 | 0.701 |
| BIC = 554.852 | |||||||
| Scenic-area-oriented convenience | 1 | 0.004*** | y(t)=7.969 + 0.482y(t − 1)−1.0ε(t − 1) | AR(1):p = 0.027**; MA(1):p = 0.000*** | AIC = 468.181 | 0.535 | 0.587 |
| BIC = 474.403 | |||||||
| Rural experience value perception | 1 | 0.036** | y(t)=5.866 + 0.507y(t − 1)−0.961ε(t − 1) | AR(1):p = 0.162; MA(1):p = 0.055* | AIC = 447.725 | 0.584 | 0.683 |
| BIC = 453.946 | |||||||
| Local culinary experience | 1 | 0.010*** | y(t)=2.794 + 0.429y(t − 1)−1.0ε(t − 1) | AR(1):p = 0.174; MA(1):p = 0.997 | AIC = 399.665 | 0.451 | 0.798 |
| BIC = 405.887 |
***p < 0.01, **p < 0.05, *p < 0.1; Q6 is the lagged 6th order Ljung–Box statistic p-value
4.4.2 Time series trend analysis.
A combination of violin plots and ARIMA results reveals a discernible change in the data [Figure 4(a)]. The mean value of rural-specific personalized services exhibits a “rise then decline” trend (T1:0.194 → T2:0.217 → T3:0.205), consistent with the results shown in Table 4. The concentrated distribution in T1 indicates relatively consistent customer evaluations of rural-specific personalized services, while the significantly expanded distribution in T2 reflects diversified service demands in the early postpandemic period. Meanwhile, the dispersed distribution in T3 suggests that some homestays failed to consistently meet personalized customer needs. The AR(1) = 0.447 coefficient (Table 4) indicates continuity in service quality, while MA(1) = −1.0 suggests that random perturbations lead to reverse adjustments, consistent with the industry’s need for responsiveness.
 The figure presents violin plots comparing five rural experience factors across three time intervals T1, T2, and T3. These include rural-specific personalised service, rural living comfort, scenic-area-oriented convenience, rural experience value perception, and local culinary experience. Each plot depicts minimum, maximum, and average values, with density reflecting data spread. Rural living comfort and value perception display higher variability in T3, while local culinary experience shows consistent distribution. The plots together depict how these rural experience attributes change over time in distribution and range.
Explanation of violin diagrams (a) Rural-specific personalized service (b)Rural living comfort (c) Scenic-area-oriented convenience (d) Rural experience value perception (e) Local culinary experience
Source: Authors’ own work
The figure presents violin plots comparing five rural experience factors across three time intervals T1, T2, and T3. These include rural-specific personalised service, rural living comfort, scenic-area-oriented convenience, rural experience value perception, and local culinary experience. Each plot depicts minimum, maximum, and average values, with density reflecting data spread. Rural living comfort and value perception display higher variability in T3, while local culinary experience shows consistent distribution. The plots together depict how these rural experience attributes change over time in distribution and range.Explanation of violin diagrams (a) Rural-specific personalized service (b)Rural living comfort (c) Scenic-area-oriented convenience (d) Rural experience value perception (e) Local culinary experience
Source: Authors’ own work
The rural living comfort dimension shows continuous mean value growth (T1:0.181 → T3:0.235), with a narrowing distribution by T3. The broader distribution in T1 indicates significant variation in rural living comfort evaluations [Figure 4(b)]. The distribution in the T2 and T3 stages gradually concentrates, indicating that the hardware upgrades have standardized the quality of offerings. With R2 = 0.602, rural living comfort shows the highest regularity among the dimensions. The near-significant MA(1) term indicates effective short-term corrective measures.
The scenic-area-oriented convenience dimension displays an inverted U-shaped trend [Figure 4(c)], matching the outcomes presented in Table 3 (T1:0.162 → T2:0.193 → T3:0.175). The widest distribution in T2 reflects substantial variance in scenic-area-oriented convenience demands during early postpandemic recovery. The distribution in the T3 stage exhibits slight narrowing, yet the overall distribution remains dispersed, confirming the spatial disparity of “core scenic area – peripheral homestays” in Hongcun. This finding suggests that spatial accessibility requires optimization through the provision of support facilities, such as shuttle buses (Dai et al., 2024). The significant AR(1) = 0.482 (p = 0.027) and MA(1) = −1.0 (p = 0.000) terms suggest that long-term advantages related to location and transportation conditions (e.g. proximity to scenic spots) and short-term scheduling (e.g. optimization of feeder buses) jointly affect scenic-area-oriented convenience.
As revealed in Figure 4(d) and (e), rural experience value perception and local culinary experience dimensions show no significant changes. This phenomenon fundamentally reflects a substitution effect in tourist evaluation logic, whereby experience-based attributes take precedence over price considerations. Keyword association analysis reveals that experiential terms such as “owner,” “service,” “environment” and “comfort” frequently appear in online reviews – significantly more often than “price” or “value for money.” This indicates that tourists place greater emphasis on nonstandardized, locality-specific experiences, which are difficult to assess within traditional cost-performance frameworks. The reason for the relatively low significance of the local culinary experience dimension lies in its role as a stable anchor within the foundational experience attributes. Tourists’ core expectation regarding rural cuisine centers on authenticity – reflecting a desire for standardized local flavors rather than culinary innovation. Positioned as a baseline requirement in the evaluation system, the utility of food experiences exhibits far less fluctuation than emotionally driven dimensions such as rural-specific personalized service and rural living comfort. As long as the taste meets expectations, it seldom becomes a focus in tourist reviews.
In summary, the violin plots and ARIMA analyses indicate that rural living comfort and rural-specific personalized service are the dominant long-term drivers of rural homestay experience. Their ARIMA trend coefficients are statistically significant at the 5% level. In contrast, scenic-area-oriented convenience and local culinary experience are more influenced by external factors, as reflected by the absolute magnitude of MA(1) = 1.0. Rural experience value perception shows minimal fluctuation (lowest AIC = 447.725), suggesting that customers’ perceptions of value for money are relatively stable and less impacted by short-term variation.
5. Conclusion and discussion
This study, set against the backdrop of the COVID-19 pandemic, analyzed 30,350 online reviews from 101 rural homestays in Hongcun, Anhui Province, China. Using a combination of NLP, ML and time series analysis, it identified key dimensions shaping rural homestay customer experience utility and the dynamic mechanisms underlying customer experience.
The findings confirm that customer experience in rural homestays is shaped by five core dimensions: rural-specific personalized service, rural living comfort, scenic-area-oriented convenience, rural experience value perception and local culinary experience. The importance of each dimension varied over time. During T1 (the pandemic period), rural-specific personalized service was the most influential factor, while in T2 (early postpandemic) and T3 (restoring the new normal), rural living comfort gradually became the dominant concern. These results underscore the value of capturing customer experience utility from a dynamic perspective and offer a new theoretical basis for promoting the sustainable development of rural homestays.
The findings of this study unequivocally demonstrate the dynamic logic of customer experience in rural homestays. Variations in the external environment (e.g. epidemics, policy changes or tourist arrivals) alter the relative importance of each experience dimension through the mechanism of demand–supply interaction. Specifically, the “safety priority” during the pandemic shock period (T1) elevates the importance of rural-specific personalized service, “compensatory consumption” in the recovery period (T2) amplifies multidimensional demands and the “quality return” in the normal period (T3) shifts the focus toward rural living comfort. This insight overcomes the limitations of static experience research and provides new empirical evidence for understanding the environmental sensitivity of tourism service experiences.
The case of Hongcun highlights the particularities of homestays located within cultural heritage sites. Here, customer experience is influenced not only by service quality but also by scenic flows, local policies and spatial layout. For instance, variation in the scenic-area-oriented convenience dimension reflects shortcomings in the collaborative management of homestay and scenic areas, while improvements in rural living comfort reflect the effectiveness of policy-driven interventions in enhancing the overall experience. These findings offer transferable lessons for managing homestays in comparable rural destinations, underscoring the need to tailor dynamic adjustment strategies to local resource endowments.
In summary, this study not only quantifies the dynamic shifts across customer experience dimensions but also reveals the principle of situational appropriateness in rural homestay experience management, grounded in the specific context of epidemic impacts and the characteristics of Hongcun. This dual perspective provides both a theoretical basis for constructing a dynamic evaluation framework and a practical foundation for implementing phased optimization strategies.
5.1 Theoretical implications
Our research makes three key contributions. First, this study expands the dynamic aspect of experience economy theory. While Pine and Gilmore (1998) identified key experience dimensions – entertainment, education, escape and esthetics – their framework did not address how these dimensions evolve dynamically in response to external changes. This study proposes a dynamic experience economy model through time series analysis. The multidimensional aspects of customer experience are perceived differently across various time periods, with their utility dynamically shifting in response to external environmental changes. For example, personalized rural services yielded highest utility in T1, while rural residential comfort reached peak utility in T2 and T3. This approach addresses the limitations of static dimensions in experience economy theory by introducing the concept of “dynamic experience utility.” Our findings also provide the first empirical evidence of the contingency nature of the experience dimensions, demonstrating that customer experience is a dynamically reconfigured process in response to external shocks (e.g. the pandemic). This contributes a new perspective to the “environment-demand” dynamic adaptation framework within the context of experience economy theory.
Second, analysis of 30,350 comments across multiple time periods revealed that the evaluation of scenic-area-oriented convenience peaked in T2 (0.193) before declining. This fluctuation closely aligned with shifts visitor flows to Hongcun Scenic Area and changes in transport infrastructure. These results indicate that customer evaluation is a process of continuous feedback and correction of service system suitability. This study quantitatively verifies, for the first time, the dynamic driving effect of customer participation on service optimization, offering micro-behavioral evidence for the interactive cocreation mechanism in service-dominant logic.
Finally, this study offers micro-empirical support for dynamic capability theory in tourism services by demonstrating how rural homestays dynamically adapted to external changes through capability-driven resource realignment. During the pandemic (T1), sensing capabilities enabled the identification of safety needs, prompting resource restructuring (e.g. contactless transfers, enhanced cleaning) that raised personalized service utility (0.194). In the recovery phase (T2), integrating capabilities detected compensatory demands, which led to optimized convenience resources (e.g. shuttle alliances) and improved location-based convenience utility (0.193). During normalization (T3), innovation capabilities identified quality expectations, and comfort upgrades (e.g. smart devices, renewed bedding) further enhanced comfort utility (0.235). By incorporating homestay characteristics – local specificity, service nonstandardization and resource constraints – this study concretizes the sense–integrate–innovate logic into a closed-loop path: identifying capabilities, matching demand, reconfiguring resources and enhancing utility. This provides a structured framework for building dynamic capabilities, enabling homestays to adjust competencies and resources in response to external shifts, thereby improving both experiential utility and market competitiveness.
5.2 Practical implications
This study is predicated on empirical analysis of rural homestays. It provides operational guidelines and evidence-based insights for both operators and government departments.
For homestay operators, the findings (Table 3) offer clear direction for resource allocation. In the T1 (the crisis period), operators should focus on emotionally resonant services, such as maintaining guest preference profiles (e.g. whether they need wake-up calls or have dietary restrictions), offering personalized pick-up and drop-off services and providing handwritten welcome notes. These practices reduce risk while enhancing warmth. In the T2 (the recovery period), in response to the difficulty of carrying luggage on the stone roads in Hongcun Scenic Area, local homestays are advised to form a “shuttle alliance” to meet the heightened demand for scenic-area-oriented convenience. In T3 (the normalization period), rural living comfort should be the core focus. Referring to Hongcun’s Homestay Quality Enhancement Program, initiatives such as quarterly bedding renewal, installation of noise-reducing air-conditioners and the addition of smart devices can sustain improvements in rural living comfort, transforming them into long-term competitive advantages for local homestays.
For local governments and relevant departments, the study shows that rural-specific personalized service, rural living comfort and scenic-area-oriented convenience are foundational factors in shaping customer experience. In the wake of heightened public concern regarding health and safety in the aftermath of the pandemic, local authorities can collaborate with industry associations to develop or refine quality certification standards for rural homestays. These standards should extend beyond basic hardware requirements and include criteria reflecting the unique attributes of rural homestays and postpandemic consumer concerns, such as service warmth and detailed hygiene practices.
Simultaneously, governments should invest in infrastructure and public services, using big data from online reviews to detect shifts in customer concerns and experiential value, providing regional tourism authorities with realtime market insights, thereby enabling the timely detection and intervention of problems.
6. Limitations and future research directions
It is important to acknowledge the limitations inherent in this study. First, the data were collected exclusively from rural homestays located in the Hongcun area of Anhui Province, China. While this site is illustrative, the findings may not be readily generalizable to rural homestays in other regions or countries. Future research could broaden the scope to include rural homestays in diverse geographic and cultural contexts to test the applicability of the findings across settings.
Second, this study relied solely on user reviews from Ctrip.com. While Ctrip is a major platform in China, the exclusive use of a single source may introduce bias and limit the generalizability of the findings (Choi et al., 2024). Future studies could integrate data from multiple mainstream platforms (e.g. Ctrip, Airbnb, Tripadvisor) to enable comparative analysis to reveal commonalities and differences in user reviews across platforms and thereby enhance external validity and generalizability.
Third, the use of TF-IDF may underestimate low frequency but high-impact attributes. This limitation is connected to the contextual dynamics of salience theory. In certain circumstances, specific attributes may become salient despite being mentioned infrequently. However, their low frequency results in a reduced IDF weight. Future research should address this issue by incorporating methods that can identify such low frequency but contextually significant attributes, thereby improving the theoretical grounding and adaptability of the approach to the dynamic nature of rural homestay experiences.
Finally, while this study focused on the dynamic utility of rural homestay customer experience in the context of a pandemic, capturing the evolution of experience dimensions in nonpandemic scenarios may require a longer observation period. Future research should extend the timeline to examine customer experience dynamics during stable periods, using long-term time-series data to better reflect gradual changes in customer expectations and preferences.
This study thanks the members of Professor Chaohui Wang’s team for their assistance. This work was supported by the National Natural Science Founda-on of China (No. 42171243) And there are no financial conflicts of interest to disclose.
Appendix Breakpoint inspection
The study used a theory-driven specified breakpoint detection method. The selection of this approach was predicated on the following considerations: Firstly, time series analysis relies not only on data-driven methodologies but also necessitates integration with domain knowledge and theoretical expectations (Bai and Perron, 2002). Secondly, preliminary exploratory analysis (e.g. visual inspection of the time series plots) suggested potential structural changes near the 16th and 26th observation points, which correspond to December 2022 and October 2023, respectively. This approach circumvents the potential overfitting issues that are inherent in purely data-driven methodologies, thereby enhancing the interpretability of the results.
The specified breakpoint detection method is founded on the theory of structural change, with its core assumption being that if a time series exhibits a genuine structural break at a specific point, the statistical characteristics before and after that point should differ significantly. The present study was inspired by the Chow test (Chow, 1960), yet it was extended to accommodate scenarios with multiple breakpoints.
The specific implementation steps are as follows:
Breakpoint preselection: Preliminary data analysis and theoretical considerations suggest that preselect time points 15 and 25 as candidate breakpoints.
Statistical validation: For each preset breakpoint, an independent samples t-test should be used to compare the mean differences between the subsequences before and after the breakpoint, thereby verifying the statistical significance of the change.
Segmented modeling: In the context of validated breakpoints, the temporal series is segmented into multiple components, with the descriptive statistics for each segment calculated independently.
To ensure the validity of breakpoints, rigorous statistical validation criteria were established. These criteria include the mean difference between subsequences before and after the breakpoint reaching statistical significance (p < 0.05), each subsequence containing at least three observation points to guarantee the validity of statistical tests.
The figure illustrates the results of the breakpoint test, while the table presents the statistical significance of mean tests before and after the breakpoint.
 The figure contains four line graphs analysing rural-specific personalised service, scenic-area-oriented convenience, rural living comfort, and rural experience value perception. Each graph tracks values across a time index with vertical lines marking breakpoints and horizontal lines indicating segment means. The data patterns fluctuate, showing points of structural change. Rural living comfort and convenience display more frequent shifts, suggesting variations in rural satisfaction and experience trends across different time segments.
Breakpoint detection diagram
Source: Authors’ own work
The figure contains four line graphs analysing rural-specific personalised service, scenic-area-oriented convenience, rural living comfort, and rural experience value perception. Each graph tracks values across a time index with vertical lines marking breakpoints and horizontal lines indicating segment means. The data patterns fluctuate, showing points of structural change. Rural living comfort and convenience display more frequent shifts, suggesting variations in rural satisfaction and experience trends across different time segments.Breakpoint detection diagram
Source: Authors’ own work
Descriptive statistics of time series segments at specified breakpoints
| Dimension | Period | Mean | Std. dev. | Breakpoint t-value | Breakpoint p-value | Min | Max |
|---|---|---|---|---|---|---|---|
| Rural-specific personalized service | T1 | 848.07 | 640.63 | −4.743*** | 0.000 | 67 | 2503 |
| T2 | 1832.6 | 610.6 | 582 | 2899 | |||
| −2.781** | 0.011 | ||||||
| T3 | 1991.18 | 681.51 | 770 | 3391 | |||
| Scenic-area-oriented convenience | T1 | 260.13 | 179.79 | −5.121*** | 0.000 | 20 | 625 |
| T2 | 577.8 | 178.06 | 194 | 872 | |||
| −2.667** | 0.014 | ||||||
| T3 | 603.64 | 205.91 | 220 | 961 | |||
| Rural living comfort | T1 | 815.73 | 524.31 | −5.763*** | 0.000 | 100 | 2129 |
| T2 | 1822 | 576.97 | 648 | 2784 | |||
| −3.454** | 0.003 | ||||||
| T3 | 2126.36 | 682.55 | 824 | 3310 | |||
| Rural experience value perception | T1 | 206.27 | 137.45 | −5.271*** | 0.000 | 27 | 545 |
| T2 | 433.4 | 127.39 | 155 | 652 | |||
| −3.276** | 0.004 | ||||||
| T3 | 503 | 164.06 | 203 | 809 | |||
| Local culinary experience | T1 | 90.47 | 67.39 | −4.701*** | 0.000 | 3 | 243 |
| T2 | 194 | 74.01 | 46 | 315 | |||
| −2.9** | 0.007 | ||||||
| T3 | 206.91 | 59.78 | 104 | 298 |
***, ** indicate statistical significance at the 1% and 5% levels, respectively. T1–T3 represent the three periods segmented by the specified breakpoints at time points 15 and 25
Notes
Homestay refers to a type of accommodation in which guests pay to stay in private homes, typically interacting with a host or family who resides on the premises and shares some common areas (Lynch, 2005). Homestays represent a global phenomenon and appear in various forms across different countries (Mura, 2015). In the context of Hongcun, most homestays are located in residential buildings within the scenic area, making the term more appropriate than B&Bs.
Text clustering faces two fundamental challenges:
High dimensionality: Word vector spaces, such as those created from TF-IDF matrices, often exceed 104 dimensions.
Sparsity: The proportion of non-zero features in a given document is typically below 0.1, leading to highly sparse data distributions. This causes silhouette coefficients to compress into the 0.2–0.5 range, significantly lower than that those observed in structured data clustering (Aggarwal & Zhai, 2012). Therefore, the silhouette coefficient values in this study are considered acceptable.

