


This research aims to study the barriers to digital transformation (DT) faced by micro, small and medium-sized enterprises (MSMEs) within the Cultural and Creative Industries (CCIs) in the Basque Country. It identifies key obstacles and explores how public policy can support overcoming these barriers to enhance organizations’ competitiveness.
This research uses a quantitative approach, surveying 268 CCI MSMEs in the Basque Country using a standardized online questionnaire. The authors analyzed the response through descriptive statistics, correlation analysis and multiple regression to assess the impact of various barriers and organizational characteristics on organizational DT level.
The findings highlight that organizations with lower DT levels perceive barriers more acutely, specifically knowledge-related barriers, such as the lack of information about appropriate technologies and qualified staff, and organizational culture barriers, including the low prioritization of DT within organizations. Moreover, certain organizational characteristics and collaboration with other organizations and public administration assistance enhance the perceived level of DT and reduce the perception of the barriers.
This research fills a gap in the literature by focusing on DT in CCI MSMEs, a sector with unique structural characteristics and significant economic importance. It provides policymakers with actionable insights to design targeted interventions that address specific barriers, thereby fostering competitiveness in CCIs.
1. Introduction
Cultural and Creative Industries (CCIs) are increasingly recognized for their dual role: their intrinsic cultural value and their contribution to innovation, socioeconomic development and regional competitiveness (Boix-Domènech and Rausell-Köster, 2018; Sanjuán Belda et al., 2023). This relevance has led to their inclusion as key elements in European regional policy (Barandiaran-Irastorza et al., 2020; Boix Domenech et al., 2022).
Nevertheless, CCIs operate in a rapidly evolving environment that presents both opportunities and critical challenges (Dörflingler et al., 2016), particularly in relation to digital transformation (DT), which is reshaping business models, value chains, employment and skill requirements (Aguiar and Waldfogel, 2021; Vendrell-Herrero and Wilson, 2017). While DT adoption can enhance productivity in micro, small and medium-sized enterprises (MSMEs) (Hwang and Kim, 2022), it is often inhibited by a range of barriers – factors that delay, obstruct or discourage DT (Packmohr et al., 2023).
These barriers include knowledge-related constraints, economic limitations, organizational culture challenges, time pressures and more. In the case of CCIs – dominated by micro and small firms with limited internal capabilities – these challenges are especially pressing (Dörflinger et al., 2016). Although a growing body of research has identified common DT barriers in MSMEs (Abel-Koch et al., 2019; Lammers et al., 2019; Rupeika-Apoga and Petrovska, 2022), fewer studies have focused specifically on CCI. The present study draws on this broader literature, as well as on selected contributions addressing CCIs directly (Dörflingler et al., 2016; Roecker et al., 2017) and sector-specific cases such as museums and performing arts (Carvalho and Matos, 2020; Horváth, 2024; Nikolaou, 2024).
To address this gap, the article explores two research questions:
What barriers hinder the digital transformation of CCI MSMEs? and
How can public policy help overcome them?
The analysis is based on quantitative data from a standardized questionnaire administered to 268 CCI MSMEs in the Basque Country (Spain). While the regional scope of study presents a certain limitation, this context offers a representative case of CCI MSMEs facing DT in a European setting and opens the way for future research that could broaden the perspective through cross-country comparisons or multiregional data.
The results show that, beyond structural or financial constraints, the most significant barriers to DT in CCI MSMEs are related to knowledge and organizational culture. These findings underscore the need for public policies that move beyond generic DT initiatives and directly address these internal, and often underestimated, challenges. The remainder of the article is structured as follows: Section 2 reviews the literature on DT in this sector and the barriers involved; Section 3 describes the methodology; Section 4 presents the results; and Section 5 discusses the main implications and conclusions.
2. Analytical framework
2.1 Digital transformation in cultural and creative industries
DT is recognized as a driver of innovation and progress and is expected to exert profound and lasting effects on enterprises and society (Dörflingler et al., 2016). As DT permeates various industrial sectors, it significantly reshapes organizational structures and leads to widespread changes (Van Tonder et al., 2020). DT goes beyond the traditional approach to digitization (Horváth and Szabó, 2019). It entails a complete restructuring incorporating digital technologies into all aspects of business operations (Prokůpek, 2019). This transformation represents a fundamental shift, impacting not only product and process improvement but also business models, organizational management and entire supply chains, posing significant challenges for organizations (Horváth and Szabó, 2019; Parviainen et al., 2022).
In this study, we follow the definition of DT as proposed by Gong and Ribiere (2021, p. 12), which characterizes it as “a fundamental change process, enabled by the innovative use of digital technologies accompanied by the strategic leverage of key resources and capabilities, aiming to radically improve an entity and redefine its value proposition for its stakeholders.” This perspective characterizes DT as a multidisciplinary process involving changes in strategy, organization, information technology, supply chains, marketing and value creation (Radicic and Petković, 2023).
In CCIs, DT has enabled innovation and experimentation (Chandna and Salimath, 2020). Mangematin et al. (2014) even claim that no set of industries has felt the impact of DT more than the CCIs. From creation to consumption, all steps in the value chains of CCIs have been influenced by this new scenario, bringing about new opportunities for innovative practices (De Voldere et al., 2017; Snowball et al., 2021).
DT has opened up new spaces and possibilities for cultural and creative creation, even leading the way for novel and innovative artistic genres and techniques (Massi et al., 2021). Moreover, Massi et al. (2021) highlight that empowered by DT, consumers may now turn into prosumers, as they can interact directly to exchange and co-create cultural and creative products and services based on a collaborative production perspective. New online platforms have also democratized access to cultural products, allowing producers to reach broader audiences without intermediaries (Prokůpek, 2019). Bakhshi and Throsby (2012) also highlight how DT has altered cultural consumption. They see these changes in three main elements:
interactivity, referring to the ability to engage in two-way communication with the audience;
convergence, indicating that cultural goods can be accessed without time and space constraints; and
connectivity, enabling direct communication between users and suppliers.
Waldfogel (2022) notes that DT has also lowered the costs of creating, distributing and promoting new products and services, enabling individuals or smaller groups to engage in creative entrepreneurship by bringing new products to market with minimal financial resources.
Consequently, in an era in which DT has become both an opportunity and a challenge (Taormina and Baraldi, 2022), organizations within the CCIs must adapt to this trend (Parviainen et al., 2022). As highlighted by some authors (Jones et al., 2021; Raimo et al., 2022), such adaptation is a complex process that may be fraught with barriers that could hinder CCI organizations from successfully undergoing the necessary transformation (Truant et al., 2021). Overcoming those barriers requires a multilayered strategy (Dörflingler et al., 2016). Hence, subsection 2.2 develops a framework capturing the different barriers that might hinder the DT of CCIs.
2.2 Barriers to digital transformation in cultural and creative industries
As previously discussed, DT is a multifaceted process often facing numerous obstacles. These barriers – factors that inhibit, delay or obstruct DT (Packmohr et al., 2023) – must be thoroughly examined to inform effective organizational strategies and targeted public policies. While the literature identifies several barriers common across sectors, their relevance varies depending on industry characteristics, organizational size and culture and regional business contexts (Chen et al., 2021). Despite the growing importance of this topic, limited research specifically addresses the barriers faced by CCI MSMEs. Given the sector’s heterogeneity, some CCI organizations resemble entities from other industries more than they do each other. To address this diversity, our analytical framework combines insights from CCI-specific research and broader studies on MSMEs.
Table 1 presents the framework developed for this study. It builds on prior contributions by Dörflingler et al. (2016) and Roecker et al. (2017), who provide essential groundwork for understanding DT barriers in CCIs. However, Dörflingler’s model is limited in scope, while Roecker’s is overly detailed and fragmented. Our framework proposes a more streamlined, thematically organized categorization based on an extensive literature review. It integrates sector-specific insights (e.g. Trubnikova and Tsagareyshvili (2021) on opera; Carvalho and Matos (2020), Nikolaou (2024) on museums; Evci et al. (2025), Horváth (2024) on theatre and performing arts) with broader MSME literature, aiming to balance analytical clarity with the complexity of DT in CCIs.
Barriers to DT in MSMEs
Among broader studies, Resource-Based View (RBV) approaches – such as Rupeika-Apoga and and Petrovska (2022) – have been especially relevant in identifying internal resource-based constraints. However, to reflect CCI-specific realities, we also included barriers outside the RBV framework, such as market demand and intellectual property, highlighted in the literature as relevant to understanding DT challenges in these sectors.
3. Methodology
Given that DT in CCI MSMEs represents a novel and emerging phenomenon, a case study approach was deemed appropriate for exploring this topic in real-life contexts (Yin, 2017). The case of the CCIs of the region of the Basque Country in Spain is explained in subsection 3.1.
3.1 Case description
In 2022, CCIs in the Basque Country comprised 16,924 firms (11% of all economic activity) and employed 34,213 people (3.75% of total employment) (Retegi et al., 2023). These organizations are predominantly microenterprises, with an average of just over two employees per firm and a high self-employment rate. This structural pattern is consistent with Eurostat (2022) observation of CCIs across Europe, and aligns with Pratt’s (2012) notion of a “missing middle,” referring to the scarcity of medium-sized firms. This fragmented composition intensifies the challenges associated with DT, as smaller organizations often lack the internal capabilities and resources required to adopt and integrate digital technologies effectively.
DT has been formally integrated into the 2028 Basque Strategic Plan for Culture as a strategic objective for strengthening the sector (Gobierno Vasco, 2023). This cultural policy orientation builds upon the earlier designation of CCIs as a priority area in the Basque Smart Specialization Strategy and its implementation through the Euskadi Creativa [Creative Basque Country] program (Gobierno Vasco, 2020). The primary institutional mechanism currently supporting this objective is the Basque District of Culture and Creativity (BDCC), a regional platform created to coordinate and enhance existing public and private initiatives to develop the CCI sector (Gobierno Vasco, 2023).
The BDCC provides a centralized structure to guide, accompany and strengthen CCI organizations in innovation, internationalization and business competitiveness, with DT as a core focus. It offers four levels of support: a first level consisting of a guide of digital tools available on the BDCC website (Level 00); basic orientation provided by BDCC staff (Level 01); specialized guidance from expert consultants and technology agents (Level 02); and advanced, tailor-made advisory services co-developed with sector stakeholders (Level 03). Among these, Levels 02 and 03 are the most relevant for supporting DT, as they provide in-depth, customized assistance adapted to each organization’s specific needs and maturity (Basque District of Culture and Creativity, 2024).
In summary, the maturity of the Basque CCI ecosystem, enhanced by the BDCC’s comprehensive support infrastructure, offers a compelling case to examine DT barriers and inform how institutional services might evolve to better respond to the sector’s DT needs.
3.2 Questionnaire design
This questionnaire was developed through collaboration between Orkestra – Basque Institute of Competitiveness and the Basque Government’s Department of Culture and Language Policy. Orkestra’s research team designed the initial draft based on the literature review, which was reviewed by policymakers to ensure relevance. Following consensus, a pretest with four organizations assessed its clarity and effectiveness, leading to revisions for the final version. While the questionnaire addressed various facets of DT, this study focuses on responses to two key questions:
“Evaluate your organization’s current level of Digital Transformation.”
The responses were recorded using a six-point Likert scale, ranging from 1 (Not Digitally Transformed) to 6 (Highly Digitally Transformed). This format was chosen to avoid a neutral midpoint, which may encourage indecisive answers (Neuman, 2014), while staying within a cognitively manageable range (Simms et al., 2019).
For the descriptive analysis in subsection 4.1, responses were dichotomized into Less Digitally Transformed (1–4) and Highly Digitally Transformed (5–6). This binary classification improves interpretability and avoids ambiguity in group comparisons. However, this approach involves trade-offs, notably the potential loss of nuance and the reduction of variability in the data, which may limit the granularity of insights. To preserve analytical precision, the original six-point scale was retained for the correlation and regression analyses:
“To what extent do you believe the following barriers or obstacles are significant in hindering the digital transformation of your business?”
It entails a high economic risk (B1).
Costs are too high (B2).
Insufficient availability of suitable funding sources (B3).
Lack of qualified and trained staff (B4).
Lack of information and knowledge about appropriate technology (B5).
Lack of information and knowledge about the market and its needs (B6).
Internal rigidities and apprehension about change (B7).
It is not among the organization’s priorities (B8).
Inability to allocate sufficient time (B9).
Lack of interest of customers to new goods or services (B10).
Factors related to intellectual property (B11).
The response choices for the 11 items were designed again on a six-point Likert scale, 1 (irrelevant) to 6 (very relevant).
To enhance the analysis, responses to both questions have been cross-referenced with several independent variables (characteristics of the organizations) collected through the questionnaire. These variables include the type of the organization, the branch of activity, organizational size, whether the organization has collaborated with another entity for DT, and whether it has received support from public administrations for DT. This approach allows for a nuanced understanding of how various factors influence the perception of DT and associated barriers within the CCI sector.
3.3 Sample selection, data collection and description of the sample
CCIs are context-dependent and difficult to define (Unceta et al., 2021). To delineate the scope of activities examined in this research, this study relies on the definitions and classifications provided by two key reports that establish the boundaries of CCI within the Basque Country and link these boundaries to the A38 branches of activity within the NACE-2009 classification system (Retegi et al., 2022a, 2022b). This perimeter is based on internationally recognized criteria, ensuring comparability with other regions, while also reflecting the institutional and economic specificities of the Basque Country.
The analysis focuses on the NACEs within the following branches: “JA: Publishing, audiovisuals, radio and television, and information technology,” “M + N: Professional, scientific and technological activities” and “R: Recreational and cultural activities” ( Appendix 2). Other branches were excluded, as they typically fall outside the remit of the Departments of Culture.
The questionnaire was sent to the 9,829 organizations listed under the selected NACEs in the DIRAE (Basque Institute of Statistics – EUSTAT). It was electronically distributed and self-administered, with mailings launched on January 9, 2023, and reminders on 17 and 24. A total of 268 valid responses were obtained. Table 2 presents the distribution and characteristics of the responding organizations by independent variables. Although the sample does not exactly replicate the population structure, it provides broad coverage across key segments, including type of CCI, branch of activity and company size. At an 85% confidence level, the margin of error remains below 7% for the main subgroups, supporting the use of the data set for an exploratory analysis of DT patterns in the industry.
Distribution of the sample
| Variables | Group breakdown | Absolute frequency | Relative frequency (%) |
|---|---|---|---|
| Type of CCI | Cultural | 131 | 48.88 |
| Performing arts | 14 | 5.22 | |
| Visual arts | 16 | 5.97 | |
| Audiovisual and multimedia | 52 | 19.4 | |
| Books and press | 30 | 11.19 | |
| Music | 5 | 1.86 | |
| Heritage, museums, archives and libraries | 14 | 5.22 | |
| Creative | 137 | 51.11 | |
| Architecture | 70 | 26.11 | |
| Design | 28 | 10.44 | |
| Language industries | 17 | 6.34 | |
| Advertising | 20 | 7.46 | |
| Video games | 2 | 0.74 | |
| Branch of activity | JA | 87 | 30.96 |
| M + N | 153 | 54.45 | |
| R | 28 | 9.96 | |
| Company size (no. workers) | 1–9 (micro) | 220 | 78.29 |
| 10–49 | 38 | 13.52 | |
| 50–249 | 8 | 2.85 | |
| 250+ | 2 | 0.71 | |
| Organizations that have collaborated with another organization to carry out the DT | Yes | 126 | 47.01 |
| No | 142 | 52.95 | |
| Organization that have received assistance from public administrations to carry out the DT | Yes | 20 | 7.46 |
| No | 248 | 92.53 | |
| Perception of the degree of DT | Less digitalized | 120 | 44.77 |
| More digitalized | 148 | 55.22 |
3.4 Quantitative analysis
We did a quantitative analysis to explore the barriers affecting the DT of CCI MSMEs. This comprises an initial descriptive analysis of the variables of interest based on an analysis of the means of each barrier (with values from 1 to 6) estimated at the different values of the control variables. The differences between the means across the various groups were assessed using non-parametric tests, given that we analyze ordinal variables with non-normal distributions. Specifically, the Wilcoxon-Mann-Whitney test was employed for the control variables – Type, Size, Degree of DT, Collaborators and Assistance – while the Kruskal–Wallis test was used for the variable Branch of Activity, as this variable is not ordinal.
Subsequently, we conducted a correlation analysis to explore the relationships between the perceived level of DT of the organization (dependent variable) and the perceived barriers (independent variables) associated with each control variable. We used R statistical software (R Core team, 2023) to construct the correlation matrix. Kendall’s Tau-b correlation coefficient was used, whereby a value of −1 indicates a perfect negative correlation, 0 means no correlation and 1 means a perfect positive correlation (Kendall, 1948). Correlation coefficients below 0.3 are regarded as indicating a low effect, while those above 0.3 are considered as indicating a medium effect (Cohen, 1992).
We also use a multiple regression approach. We model the linear effect of the independent variables (barriers and control variables) on the perceived level of DT of the organizations using Ordinary Least Squares. This approach enables a more comprehensive analysis by considering the effects of all variables on the dependent variable. Model 1, expressed in equation (1), only includes the barriers:
Model 2, expressed in equation (2), incorporates all the independent variables, barriers and control variables (related to the characteristics of the organizations in the sample):
Finally, Model 3 (presented in the subsection 4.3) includes only the variables selected through the Least Absolute Shrinkage and Selection Operator (LASSO) (Tibshirani, 1996), used to identify the variables that explain our model. This procedure reduces the coefficients of some variables by penalizing the inclusion of nonsignificant variables, leaving those not reduced to zero as the variables selected to be used in the model.
4. Results analysis
4.1 Descriptive analysis
In Table 3, we present the average values assigned to each barrier, broken down by control variables and the perceived level of DT. The three economic barriers and the lack of time to dedicate to DT stand out as the most significant. Knowledge-related barriers receive medium importance on average.
Descriptive statistics
| Type | Size | Branch of activity | Collaborators | Assistance | Level of DT | ||||||||||
|---|---|---|---|---|---|---|---|---|---|---|---|---|---|---|---|
| Category of barrier | Barriers | Total | Cultural | Creative | Micro | Rest | JA | M + N | R | Yes | No | Yes | No | Less DT | More DT |
| Economic barriers | (B1) | 4.07 | 4.18 | 3.97 | 4.03 | 4.27 | 4.22 | 4.03 | 3.86 | 4.24 | 3.92 | 4.15 | 4.06 | 4.10 | 4.05 |
| (B2) | 4.41 | 4.44 | 4.37 | 4.36 | 4.60 | 4.39 | 4.41 | 4.46 | 4.61 | 4.22 | 4.75 | 4.37 | 4.46 | 4.36 | |
| (B3) | 4.18 | 4.24 | 4.12 | 4.20 | 4.04 | 4.34 | 4.13 | 3.89 | 4.25 | 4.10 | 4.20 | 4.17 | 4.36 | 4.03 | |
| Barriers related to the availability of knowledge | (B4) | 3.19 | 3.34 | 3.05 | 3.10 | 3.63 | 3.13 | 3.11 | 3.86 | 3.19 | 3.19 | 3.50 | 3.16 | 3.64 | 2.83 |
| (B5) | 3.44 | 3.44 | 3.45 | 3.53 | 3.04 | 3.22 | 3.50 | 3.82 | 3.23 | 3.63 | 2.50 | 3.52 | 4.02 | 2.97 | |
| (B6) | 3.16 | 3.19 | 3.12 | 3.19 | 3.02 | 2.97 | 3.20 | 3.54 | 2.99 | 3.30 | 2.70 | 3.19 | 3.65 | 2.75 | |
| Barriers related to organizational culture | (B7) | 2.70 | 2.69 | 2.71 | 2.60 | 3.13 | 2.46 | 2.72 | 3.32 | 2.69 | 2.69 | 2.75 | 2.69 | 3.00 | 2.45 |
| (B8) | 2.59 | 2.44 | 2.74 | 2.63 | 2.40 | 2.43 | 2.61 | 2.96 | 2.24 | 2.89 | 2.10 | 2.62 | 2.95 | 2.29 | |
| Barriers related to time availability | (B9) | 4.19 | 4.04 | 4.34 | 4.25 | 3.94 | 3.93 | 4.33 | 4.29 | 4.21 | 4.17 | 3.75 | 4.22 | 4.64 | 3.83 |
| Barriers related to the markets in which they operate | (B10) | 3.12 | 3.20 | 3.04 | 3.15 | 3.00 | 3.10 | 3.10 | 3.29 | 3.03 | 3.19 | 3.40 | 3.09 | 3.36 | 2.93 |
| (B11) | 2.65 | 2.71 | 2.58 | 2.64 | 2.69 | 2.53 | 2.68 | 2.82 | 2.50 | 2.77 | 2.70 | 2.64 | 2.65 | 2.64 | |
(1) Only the means highlighted in italic are statistically significant, corresponding to p-values < 0.05. (2) Values ranging from 1 to 3 are classified as low, those from 3 to 4 as medium and values exceeding 4 are considered high
Focusing on statistically significant differences, we observe variations by organizational size: small and medium-sized enterprises (SMEs) perceive the lack of qualified and trained staff (B4) as more relevant, while microenterprises assign greater importance to the lack of knowledge about appropriate technologies (B5).
Regarding the differences in perceptions across the branches of activity, CCI engaged in Recreational Activities (R) perceive the barrier of internal rigidities and apprehension about change (B7) more significantly, followed by those in Professional, Scientific and Technological Activities (M + N) and then Publishing, Audiovisuals, Radio and Television and Information Technology (JA).
As to collaboration, organizations that have not partnered with others for DT perceive both B5 and the lack of internal prioritization (B8) as more critical. Similarly, those without public support assign higher importance to B5 compared to those receiving institutional assistance.
Finally, organizations that consider themselves less digitally transformed consistently perceive almost all barriers as more relevant, except for B1, B2 and B11.
4.2 Correlation analysis
Table 4 presents the statistically significant Kendall’s Tau-b correlations (p < 0.05) between the perceived level of DT and the relevance assigned to each barrier, disaggregated by organizational characteristics. All reported correlations are negative, indicating that stronger perceptions of barriers are consistently associated with lower DT levels. Values equal to or above −0.3, interpreted as a moderate effect size, are shown in bold for emphasis.
Correlation between the perception of DT and perception of barriers depending on each descriptive variable
| Control variables | Control variables breakdown | Economic barriers | Barriers related to the availability of knowledge | Barriers related to organizational culture | Barriers related to time availability | Barriers related to the markets in which they operate | ||||||
|---|---|---|---|---|---|---|---|---|---|---|---|---|
| B1 | B2 | B3 | B4 | B5 | B6 | B7 | B8 | B9 | B10 | B11 | ||
| Total | −0.189 | −0.307 | −0.257 | −0.132 | −0.189 | −0.176 | −0.117 | |||||
| Type | Cultural | −0.274 | −0.324 | −0.252 | −0.275 | −0.232 | −0.270 | −0.148 | ||||
| Creative | −0.292 | −0.252 | −0.162 | |||||||||
| Size | Micro | −0.203 | −0.325 | −0.283 | −0.136 | −0.214 | −0.162 | |||||
| Rest | ||||||||||||
| Branch of activity | JA | −0.274 | −0.395 | −0.365 | −0.319 | −0.255 | ||||||
| M + N | −0.274 | −0.205 | −0.188 | |||||||||
| R | −0.322 | −0.336 | −0.286 | |||||||||
| Collaborated with other organizations | Yes | −0.146 | −0.282 | −0.297 | −0.193 | −0.162 | ||||||
| No | −0.218 | −0.307 | −0.209 | −0.134 | −0.172 | −0.190 | −0.135 | |||||
| Public administration’s assistance | Yes | |||||||||||
| No | −0.212 | −0.298 | −0.255 | −0.120 | −0.178 | −0.186 | −0.132 | |||||
Only statistically significant correlations (p < 0.05) are shown. Values equal to or greater than - 0.3 are highlighted in italic, indicating moderate or stronger effects
Among the five categories, knowledge-related barriers (B4, B5 and B6) show the highest number of significant negative correlations across organizational types. B5 (lack of knowledge about appropriate technology) stands out for its consistency and strength, especially in cultural organizations, microenterprises, firms in the JA branch, noncollaborators and those without public support. B4 (lack of qualified staff) and B6 (lack of market knowledge), though showing moderate effect in some cases, also register multiple significant correlations in these same groups, highlighting the widespread impact of knowledge deficits.
In addition, B8 (low prioritization of DT within the organization), related to organizational culture barriers, presents several significant correlations, particularly in the R sector and among less digitally advanced firms.
Looking across subgroups, the JA branch of activity, cultural organizations, microenterprises and firms lacking collaboration or institutional support exhibit the highest concentration of significant negative correlations across multiple barriers. This suggests that certain types of CCI organizations are especially affected by internal obstacles, particularly those related to knowledge and culture.
These patterns provide a first indication of which barriers – and which types of organizations – are more closely associated with lower levels of DT, offering a basis for further analysis in the following section.
4.3 Regression analysis
Table 5 presents a simplified summary of the three regression models developed. Full outputs, including all coefficients and standard errors, are available in Appendix 1. The table focuses on the direction and significance of effects to ease interpretation.
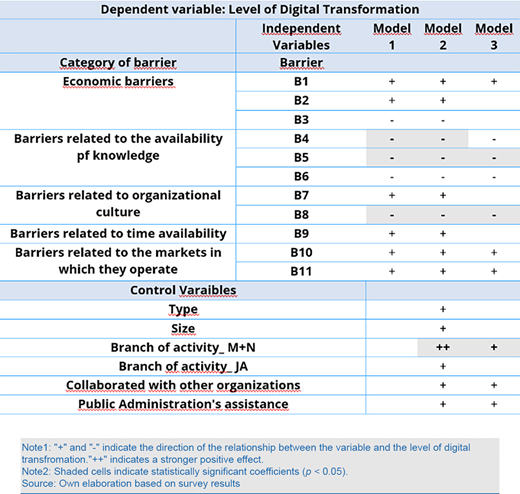
Model 1 (adjusted R2 = 0.135) identifies three barriers negatively associated with the perceived level of DT: lack of appropriate technology knowledge (B5), low prioritization of DT (B8) and lack of qualified staff (B4). Model 2 (adjusted R2 = 0.149) adds control variables, showing that belonging to the M + N branch of activity (professional, scientific and technological activities) is positively associated with DT compared to the R sector.
Model 3, selected as the most suitable specification (adjusted R2 = 0.159), includes only the variables selected by LASSO, which eliminates nonrelevant predictors. Figure 1 graphs Model 3’s coefficient estimates with 95% confidence intervals. In contrast to the table, the chart highlights the magnitude and statistical precision of each effect, offering a clearer view of which variables are most relevant. As expected, B5 and B8 retain a significant negative effect, while the M + N sector again shows a positive relationship:
 The image presents a graph showing coefficient estimates for different factors related to a model, labelled on the vertical axis. The horizontal axis represents the estimate values, ranging from minus zero point six to positive zero point six. Each factor is illustrated with points indicating estimates, accompanied by horizontal lines illustrating confidence intervals. Significant factors are marked with blue circles, while non-significant ones are represented by grey circles. The graph includes annotations for specific factors like high economic risk, lack of qualified staff, lack of information about technology, and several others, detailing the nature of each variable. The layout effectively distinguishes significant and non-significant results, aiding in the understanding of their impact on the model.
Regression Model 3
Source: Authors’ own elaboration based on survey results
The image presents a graph showing coefficient estimates for different factors related to a model, labelled on the vertical axis. The horizontal axis represents the estimate values, ranging from minus zero point six to positive zero point six. Each factor is illustrated with points indicating estimates, accompanied by horizontal lines illustrating confidence intervals. Significant factors are marked with blue circles, while non-significant ones are represented by grey circles. The graph includes annotations for specific factors like high economic risk, lack of qualified staff, lack of information about technology, and several others, detailing the nature of each variable. The layout effectively distinguishes significant and non-significant results, aiding in the understanding of their impact on the model.Regression Model 3
Source: Authors’ own elaboration based on survey results
5. Discussion and conclusions
This article analyses the barriers to DT faced by 268 MSMEs in the CCIs of the Basque Country. The set of barriers examined, drawn from existing literature on MSMEs more broadly, proves to be applicable and relevant to the CCI context as well. As the results show, CCI organizations not only recognize these barriers, but assign high levels of importance to them, confirming their conceptual transferability to this sector. While economic barriers receive the highest average importance scores, our findings show that knowledge-related and cultural barriers display stronger and more consistent negative associations with actual DT levels. This contrast highlights a critical gap between what CCI organizations perceive as the most pressing obstacles and those that empirically relate to lower DT.
Compared with broader MSME studies, our results highlight distinctive patterns in the CCI sector. Financial constraints, often central for microenterprises in other industries (Packmohr et al., 2023; Rupeika-Apoga and Petrovska, 2022), do not explain variations in DT among CCI. Correlation results further reinforce the central role of internal barriers, particularly those related to knowledge. All three knowledge-related barriers – lack of appropriate technological knowledge (B5), lack of qualified staff (B4) and limited market knowledge (B6) – consistently show negative associations with DT levels across organizational types, even when not all reach statistical significance in regression models. Notably, B5 stands out as the strongest and most recurrent barrier, especially among cultural, micro and unsupported organizations. These findings are consistent with Abel-Koch et al. (2019), who emphasize internal resistance and skill deficits in Spanish SMEs, and with Truant et al. (2021), who underscore the relevance of internal capabilities over resource availability. They also echo Carvalho and Matos (2020), who highlight limited strategic vision and digital competencies in the cultural sector.
Importantly, our results align with the qualitative findings of Roecker et al. (2017), who identify internal organizational challenges, particularly the difficulty of integrating technical knowledge into creative processes, as central barriers to DT in CCI. Our study complements these insights by providing quantitative confirmation that internal barriers are statistically associated with reduced DT levels.
Our findings also contrast with expectations in sector-specific literature. For example, Horváth (2024) identifies intellectual property as a significant obstacle in the performing arts. However, in our study, this barrier is assigned low importance and shows no statistical relationship with DT, suggesting that, in practice, it is not a major constraint for most CCI MSMEs.
Organizational characteristics are also reflected in the correlation results. Cultural organizations, microenterprises, firms in the Recreational (R) and Audiovisual (JA) sectors, and those that have not collaborated or received public support show a higher number of significant negative correlations across internal barriers. However, when considered individually in regression models, these structural attributes do not significantly explain variations in DT levels – underscoring the greater influence of internal strategic focus and knowledge capacity.
As Rupeika-Apoga and Petrovska (2022) note, DT rarely occurs spontaneously and often requires targeted policy intervention (Chen et al., 2021). Based on the findings of this study, and acknowledging the heterogeneity of CCI organizations (Parviainen et al., 2022), effective support policies should prioritize the strengthening of internal strategic capacity, access to expert knowledge and mechanisms for structured collaboration.
The BDCC is well positioned to lead this effort. Beyond its existing multilevel support structure, the BDCC could expand its role by offering sector-specific analyses of relevant technologies and personalized advice for their implementation. This would reduce uncertainty and guide informed decision-making. Moreover, the BDCC should actively promote DT as a strategic priority, using its “BDCC Thursdays” to raise awareness, share good practices and foster peer learning through real case studies of successful digitalization.
Although KSIGUNE – the Basque Knowledge Cluster for CCIs – was not the primary focus of this article, its relevance becomes clear given the prominence of knowledge-related barriers. Greater alignment between BDCC and KSIGUNE could help address the digital skills gap systemically. The BDCC, through its direct interaction with organizations, is ideally placed to detect emerging skill needs and transmit them to KSIGUNE. KSIGUNE, in turn, could liaise with universities and vocational centers to adapt curricula and training provision, contributing to long-term sectoral resilience.
This study presents several limitations that open avenues for future research. While the regional focus on the Basque Country ensures contextual depth and policy relevance, the findings may be most applicable to regions with similar institutional and sectoral structures. A cross-regional comparison would provide a broader view of how territorial factors shape DT. Additionally, although the barrier framework is derived from general MSME literature, comparisons with other industries in the same region could reveal interesting contrasts. The study also lacks CCI-specific innovation performance indicators, which could help link DT more directly to creative outputs. Finally, while the quantitative approach offers statistical robustness, future research could incorporate qualitative methods, such as interviews or case studies, to deepen understanding of organizational behavior and decision-making in the face of DT challenges.
References
Appendix 1
Regression analysis
| Dependent variable: level of digital transformation | ||||
|---|---|---|---|---|
| Independent variables | ||||
| Category of barrier | Barriers | Model 1 | Model 2 | Model 3 |
| Economic barriers | (B1) | 0.037 (0.068) | 0.037 (0.068) | 0.047 (0.041) |
| (B2) | 0.022 (0.078) | 0.007 (0.080) | ||
| (B3) | −0.009 (0.052) | −0.008 (0.052) | ||
| Barriers related to the availability of knowledge | (B4) | −0.096* (0.052) | −0.090* (0.054) | −0.073 (0.045) |
| (B5) | −0.160***(0.056) | −0.142**(0.057) | −0.142***(0.054) | |
| (B6) | −0.082 (0.059) | −0.079 (0.058) | −0.073 (0.057) | |
| Barriers related to organizational culture | (B7) | 0.061 (0.047) | 0.051 (0.048) | |
| (B8) | −0.126***(0.044) | −0.099** (0.045) | −0.097**(0.041) | |
| Barriers related to time availability | (B9) | 0.013 (0.049) | 0.003 (0.049) | |
| Barriers related to the markets in which they operate | (B10) | 0.083 (0.055) | 0.071 (0.055) | 0.079 (0.054) |
| (B11) | 0.008 (0.046) | 0.010 (0.046) | 0.010 (0.045) | |
| Control variables | ||||
| Type | 0.245 (0.248) | |||
| Size | 0.057 (0.174) | |||
| Branch of activity_MN | 0.708**(0.309) | 0.262**(0.125) | ||
| Branch of activity_JA | 0.312 (0.231) | |||
| Collaborated with other organizations | 0.174 (0.135) | 0.166 (0.130) | ||
| Public administration’s assistance | 0.344 (0.251) | 0.364 (0.247) | ||
| Constant | 5.264*** (0.265) | 4.525*** (0.421) | 5.014*** (0.250) | |
| Observations | 268 | 268 | 268 | |
| R2 | 0.170 | 0.203 | 0.191 | |
| Adjusted R2 | 0.135 | 0.149 | 0.159 | |
(1) **p < 0.05; ***p < 0.01. (2) The full output of the LASSO regression is available upon request
Appendix 2
NACE codes included in the target population
| NACE – 2009 | Subsectors | Branch of activity (A38) |
|---|---|---|
| 7111 | Architecture | M + N |
| 7990 | Performing arts | M + N |
| 9001 | R | |
| 9002 | ||
| 9004 | ||
| 9329 | ||
| 7420 | Visual arts | M + N |
| 9003 | R | |
| 7722 | Audiovisual and multimedia | M + N |
| 5829 | JA | |
| 5912 | ||
| 5914 | ||
| 5915 | ||
| 5916 | ||
| 5917 | ||
| 5918 | ||
| 6010 | ||
| 6020 | ||
| 7410 | Design | M + N |
| 7430 | Language industries | M + N |
| 7312 | Book and press | M + N |
| 5811 | JA | |
| 5813 | ||
| 5814 | ||
| 5819 | ||
| 5920 | Music | JA |
| 7219 | Heritage, museums, archives and libraries | M + N |
| 7220 | ||
| 9102 | R | |
| 9103 | ||
| 9105 | ||
| 9106 | ||
| 7311 | Advertising | M + N |
| 5821 | Videogames | JA |

