Off-site construction (OSC) methods are proposed as a viable improvement to traditional construction with the potential to deliver higher quality products, faster construction times, and reduced project costs. This study aims to provide an insight into the precast concrete manufacturing process (PMP) and the possibility to improve productivity and increase viability of its adoption through realizing its potential benefits.
We collected empirical data from a medium sized Australian precast concrete company and analysed using a system dynamics (SD) modelling approach. The labour productivity and profitability were simulated for different sensitivity scenarios across five (5) main PMP activities: reinforcement, formwork, concreting, finishing, and crane operation.
The results revealed the main bottleneck activity hindering the productivity of PMP as reinforcement. Overtime allocation was identified as the most economical solution compared to increasing the crew size, for a potential fast-tracking scenario. Higher profitability can be achieved by significantly increasing the production throughput by at least 40% as sunk costs are better distributed.
Limited research exists quantifying actual data from industry for labour productivity measurement, and cost investigations, especially for the PMP for concrete products. This paper fulfils this gap through the proposed flexible and robust SD models tested using empirical data.
1. Introduction
Traditional construction is highly labour intensive where 20–35% of the total project budget is generally due to labour costs (Jarkas and Bitar, 2012; Jayathilaaka et al., 2022). Complexity and uncertainties associated with weather and unknown or differing site conditions, material price inflation, supplier and subcontractor issues, and design and contractual complications can significantly influence the labour productivity (Arja et al., 2009; Kimiagari and Keivanpour, 2019). Construction projects also frequently suffer from schedule and cost overruns. On average, schedule delays were encountered in 74% of projects (Rivera et al., 2016) and cost overruns in almost 80–90% of construction projects (Flyvbjerg et al., 2004; Mao et al., 2016). Hamza et al. (2022) and Johansen and Wilson (2006) argued the main reason for these issues as the low levels of productivity corresponding to construction activities. The industry also suffers from sluggish growth in labour productivity in the last few decades (Assaad et al., 2023). For example, the global annual average growth in construction labour productivity (CLP) estimated over the last two decades was only 1%, whereas in manufacturing sector, productivity increased by 3.6% (Barbosa et al., 2017). Investigations of US construction industry (Sveikauskas et al., 2016) confirmed these results with long-term productivity growth estimations of 1.1%–1.6% for residential housing, 0.5% for highways, and 2.7% for industrial construction.
Off-site construction (OSC) is arguably the most common and feasible alternative construction method that can improve productivity issues and deliver quality products cheaper and faster (Assaad et al., 2020). OSC is comprised of several processes from fabrication of individual components, sections, or entire modules in a controlled environment at an off-site manufacturing facility to on-site assembly of these produced elements (Murray-Parkes et al., 2017). It should be noted that there are different terms used to describe OSC – modular construction, industrialized construction, volumetric construction, panelized construction, prefabrication etc. We will use the term OSC as the overarching term for the rest of this paper. OSC methods moved from more traditional prefabrication to more advanced manufacturing methods to encompass manufacturing of standardized and repeatable elements with additional potential for automation, digitalization and robotization, and continuous improvement (Attouri et al., 2022). OSC methods have the potential to considerably minimize schedule and cost uncertainties of a construction project. They provide the opportunity to construct sustainable building structures with standardized elements with higher quality with improved productivity and reduced costs (Hanafi et al., 2015). This productivity improvement was argued to be possible due to the less complicated nature and reduced labour dependency during manufacturing and on-site assembly processes (Blismas et al., 2006). Precast concrete was identified as the most extensively used material for OSC due to its wide applicability for different building elements, higher efficiency, and durability (Smith, 2010). Smith (2016) discussed the potential of OSC using precast concrete to improve productivity by 30% when compared to traditional on-site construction methods.
Productivity of OSC differs from construction labour productivity (CLP), but the topic of schedule and productivity and the associated costs for traditional in situ construction has been subjected to extensive research (Rathnayake and Middleton, 2023; Wang et al., 2023). Chen and Samarasinghe (2020) and Durdyev and Ismail (2019) argued that there are major differences between OSC and traditional construction methods across areas such as design, manufacturing, supply chain, and on-site assembly. Therefore, the main factors influencing CLP and measurement techniques for traditional construction must be modified for successful adoption in OSC. Previous literature identified the manufacturing process as the main bottleneck for OSC (Wang et al., 2018) with high potential to improve overall productivity as 75–90% of total work done for precast projects during this stage (Cameron and Di Carlo, 2007; Joshi, 2021). In terms of total project costs, 70–75% of costs incur during manufacturing phase (including transportation) whereas design and planning and on-site assembly accounts for the remaining expenses (Mao et al., 2016). Therefore, it is critical to investigate the productivity for different activities in manufacturing stage and improve the process such that all aspects of cost, schedule, and quality are managed optimally (Mao et al., 2015; Wuni et al., 2022). Limited studies have been carried out quantifying empirical industry data for OSC and it is even scarcer for the precast concrete manufacturing process (PMP). This study focused on productivity and cost investigations for the manufacturing stage of OSC process using a system dynamic (SD) modelling approach. We chose this approach as it is a widely used and accepted method to measure productivity for construction processes (Khanzadi et al., 2018; Al-Kofahi et al., 2022). The validity of the proposed model was tested using actual industry data from a medium-scale precast manufacturing factory in Australia.
This paper addresses a gap in labour productivity related studies in precast manufacturing process using actual industry data and provides insights into its main bottlenecks, process improvement, and profit maximization. The main research question of the study is: How can System Dynamics (SD) modelling be utilized to identify constraints affecting labour productivity in precast concrete manufacturing, simulate productivity under different scenarios, and optimize overall profitability? The three main objectives of the research study are:
Identify and analyse the key constraints affecting labour productivity in precast concrete manufacturing, including operational, logistical, and workforce-related factors.
Develop a System Dynamics (SD) model for the precast manufacturing process, and to simulate labour productivity under various scenarios to evaluate potential improvements.
Design a SD cost model for the overall precast concrete manufacturing process, and to identify and evaluate optimal scenarios for maximizing profitability through simulation.
2. Background
2.1 Labour productivity definitions and measurement
Construction activities are complex, and each individual activity is unique from project to project (Song and Abourizk, 2008; Chapman et al., 2010). Hence, the interpretation of labour productivity in construction industry is ambiguous in nature, and it’s difficult to provide a standard definition due to the variation of productivity trends in the field (Allmon et al., 2000) although there exists certain industry accepted benchmarking standards such as RSmeans used in United States. In general, construction productivity is defined as the ratio between total input of resources, and total output of units and is measured at varying levels of detail for different processes (Song and Abourizk, 2008). Industry professionals also define CLP as a ratio between earned worker-hours and expended worker-hours, where worker-hours is a unit of measure that represents the amount of work performed by one worker in one hour (Hanna et al., 2005). In this study, we defined labour productivity as the units of work produced per man-hour as a measure of physical production throughput. The main units of measurement used in this study are output per labour hour (Units/Worker-hrs) and output per total production cost (AUD/Units) for PMP.
2.2 Precast manufacturing process and productivity
The controlled manufacturing environment provided by PMP can potentially increase productivity when compared to in situ methods (Chen et al., 2016). In a factory setting, production operations can be rescheduled or re-sequenced, and workstation can be reconfigured according to different requirements. It is more likely that there is a relatively stable workforce with better training and predictable productivity. The PMP provides the possibility of using standardized components which allows manufacturers to hire semi-skilled workers who can perform well-defined task at an assigned workstation efficiently in comparison to skilled labour requirement for traditional methods (Smith, 2010). On the other hand, worker productivity fluctuations and machinery or equipment downtime can have a negative impact on PMP resulting in lower labour productivity (Azhar et al., 2013). Arashpour et al. (2018) and Nasirian et al. (2019) argued inefficient use of available resources, and inability to reallocate workforce dynamically from one production stage to another has also led to significant losses in overall productivity.
We framed the PMP under five main manufacturing activities reinforcement, formwork, concreting, finishing, and crane operation, using literature (Chen et al., 2020b; Reichenbach and Kromoser, 2021), feedback from industry professionals and field observations. This study integrates SD modelling to simulate and analyse the impact of various productivity constraints and cost factors unique to precast concrete manufacturing. The study’s scenario-based sensitivity analysis provides practical insights into how varying factors (such as crew size and overtime allocation) affect productivity and cost. Further, it provides a deeper understanding of the specific bottlenecks within the precast manufacturing process. These specialized applications have not been extensively explored in the literature, making it a novel contribution. The originality of this study is further enhanced by the use of actual industry data from a medium-scale precast manufacturing company to test the SD model.
2.3 Factors affecting labour productivity
Studies exist on different factors and their negative impact on labour productivity in the construction, mostly for traditional methods (Nasirzadeh and Nojedehi, 2013; Hamza et al., 2022). As PMP processes are similar to traditional construction, we relied on a semi-systematic literature review of construction productivity research and interviews of precast industry experts to accommodate for potential differences with PMP to create a list of factors affecting labour productivity (Table 1). Thirty-two (32) factors were extracted factors and categorized into five main themes: technical, workforce, supply chain and logistics, management and planning, and external factors based on content analysis process and were validated by precast industry experts. These factors identified from literature were ranked according to its impact on the productivity based on the perception of six precast industry experts to ensure that they accurately reflected the practical setting.
In most scenarios, more than one factor contributes towards the loss in construction productivity. For example, previous studies identified that factors such as worker fatigue, overtime allocation and work area congestion may adversely influence overall productivity simultaneously (Assaad et al., 2023). The improved understanding of these factors and their impact on productivity, provides management with opportunity to efficiently allocate their limited resources, better support workers, and increase their commitment to productivity improvement (Dai et al., 2009b).
3. Research methodology
3.1 Sampling strategy
The sample selection for the interviews was performed by firstly identifying 17 medium or large-scale precast companies in Australia through the prefabrication Australia website (Prefabaus, 2023) and by manual google search. These companies were then contacted using email or LinkedIn profiles. Eight (8) companies responded, and six (6) interviewees were selected from these and two (2) were excluded based on two main criteria: managerial level designation, with a minimum of 10 years’ experience in precast industry (Table 2). For field observations the sample was limited due to limited precast companies in Australia and location constraints for the researcher. We identified four potential companies from the directory and conducted on-site factory visits and meetings to determine their suitability and willingness for participation. From this sample we selected a fully operational medium-scale precast company which was willing to provide data for the SD model. The sampling adequacy was established as there were no new factors identified after 4 interviews from industry experts reaching saturation.
For field observation we considered each key activity or task within the production process as a sampling unit (e.g. the reinforcement of a panel, or the setting up of formwork). We used a time-interval sampling technique to observe production between 10–15 panels/day for a week to account for variability in worker performance, shifts, and other external factors (e.g. material availability, delay in drawings). A structured observation checklists was used to record the time taken for each task, interruptions, workforce distribution, and resource usage and the findings were verified with production data from factory.
3.2 System dynamics approach
We adopted a system dynamics (SD) modelling approach to simulate the labour productivity in the precast concrete manufacturing process. SD was first introduced by Forrester (1997) and incorporates a dynamic system which can effectively simulate the interactions of different variables changes over time (Mawdesley and Al-Jibouri, 2009). SD provides a comprehensive approach by modelling feedback loops, delays, and accumulations in a system (Sterman, 2002). This is crucial in precast manufacturing where processes are interdependent and changes in one part of the system can have cascading effects (Ogunlana et al., 2003; Lim et al., 2020). SD modelling uses different diagramming tools such as causal loop diagrams (CLD) and stock and flow diagrams (SFD) to capture the structure of the respective systems (Sterman, 2002). Other simulation methods may not inherently model feedback loops or causal relations. For instance, Genetic Algorithms (GA), Particle-Swarm Optimization (PSO), and Machine Learning models like Artificial-Neural Networks (ANN) focus more on optimization rather than understanding system behaviour. This objective-oriented simulation method of SD enables modelling complex precast manufacturing activities and associated factors (Khanzadi et al., 2018). Further SD is designed to handle time delays and stocks/flows, which are important in manufacturing systems where changes take time to propagate through the system. Whereas as in many techniques, such as GA and ANN, operate more statically or in discrete steps, which might not effectively capture the time-dependent nature of precast manufacturing processes. Most of these optimization methods have inherent limitations due to assumptions made, high sensitivity to initial parameters and premature convergence. The summary of construction labour productivity simulation and modelling methods used in previous research is presented through Table 3.
SD has been successfully used across previous research studies to model productivity for traditional construction projects (Mawdesley and Al-Jibouri, 2009; Khanzadi et al., 2018). Additionally, it was used to study specific aspects of precast manufacturing such as the impact of change orders (Al-Kofahi et al., 2022), and impact of yard stock and inventory management on productivity (Lim and Kim, 2023). In this study CLD was used to identify and qualitatively model the relationships of different factors on productivity and construct the SD productivity model. SFD was used for the SD cost model as it can identify and differentiate between stock and flow variables flows whereas causal loops do not (Sterman, 2002). Modelling and simulation were conducted in Stella Professional version 2.1.3 software (ISEE Systems, 2021).
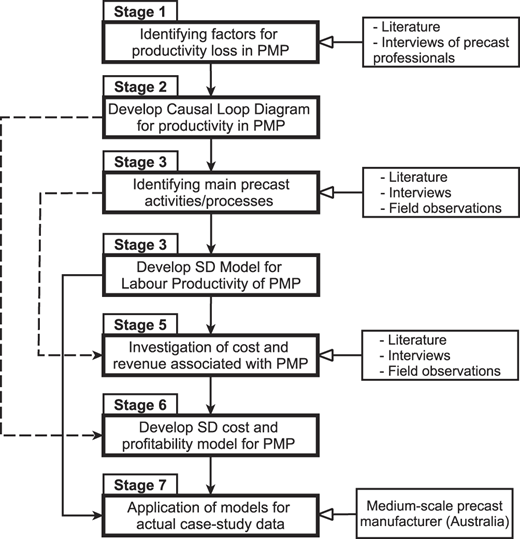
3.3 Modelling stages
We constructed a preliminary checklist using a semi-systematic literature review and open-ended interviews from industry experts. The literature review was carried out across established databases and academic libraries relevant to the construction field (SCOPUS, ASCE library and Google Scholar) using key word search. The inclusion criteria for literature for the research study were (1) Only studies directly related to labour productivity in precast concrete manufacturing or closely related fields were included (2) it is published in a peer-reviewed journal (3) Only publications after year 2000 were considered. The articles were screened for relevance and a manual snowballing was carried out to include articles missed during initial screening. Content analysis was incorporated for the collected qualitative data from the literature review and expert feedback from open-ended interviews to identify the different themes and factors. The data was coded, and the frequency or relevance of each factor was analysed using NVivo software. A preliminary checklist was constructed using the content analysis process under five (5) themes and was verified by the experts for accuracy. A preliminary checklist of factors was created for different themes which was verified by the experts and then ranked by them based on their perception of the level of impact on productivity (Figure 1). The means of the rankings were used for the final impact ranking of the factors. These rankings were cross-checked with literature for accuracy. The causal relationships between the different factors were also identified through content analysis process. Based on this analysed data, we constructed the CLD and mapped out the links of productivity factors for PMP. The initial CLD was reviewed by industry experts and their feedback was incorporated to refine the diagram, ensuring that it accurately represented the complex interactions within the PMP.
The main activities or processes of PMP were investigated through literature and field observations and were verified by interviews from precast professionals in Australia. Using the CLD and findings from investigations, a detailed SD model was developed incorporating the five main PMP activities. A comprehensive SD stock and flow cost model was constructed to investigate on the costs (direct and indirect) and revenue for the overall PMP. Using these models, productivity and cost simulations were carried out and analysed for different sensitivity scenarios using actual industry data from a medium scale precast manufacturing company case-study.
3.4 Model development
The verification of the CLD framework and SD model structures were performed through interviews of precast concrete industry professionals in Australia. The input variables used for SD models were extracted from empirical data of a medium scale precast concrete manufacturer in Australia (Table 4).
We derived the SD model equations from investigation of previously established and verified definitions of productivity and cost for construction and manufacturing industries (Equations (1)-(5)). The total worker hours (TWHn) is the sum of normal work hours (NWH) for reinforcement (rf), formwork (fw), concreting (co), crane (cr), and finishing (fi) activities. (TWHo) is the sum of overtime work hours (OWH) for these activities. The labour productivity (LP) is presented as a function of total production throughput (TPT), TWHn, TWHo, and productivity loss (PL). Where, the PL is the sum of losses from fatigue (F), crew size increase (CS), and work area congestion (WC). The total production cost is derived using the sum of direct and indirect production costs. Potential profit or loss is calculated using the difference of total revenue generated for the unit price (P) and TPC ( Appendix: Table A1).
Where,
3.5 Model verification
The model testing and verification were carried out to identify errors in the proposed model, understand the limitations, fix these errors, and develop the best available model to be applied for the research problem scenario. Five tests suggested by Sterman (2002): dimensional consistency, boundary adequacy, parameter verification, structure verification, and extreme condition were performed to verify the SD simulation model.
Dimensional consistency: The consistency of units was checked for the developed models using the software and the dimensions were confirmed. For further verification, we individually checked the accuracy of dimensions of variables and constants used in the mathematical functions to formulate the SD models.
Boundary adequacy: The adequacy test was performed to identify whether the fundamental ideas for solving the problem are endogenous to the model. The significant variables used in the two models (productivity and cost) such as total normal worker-hrs, total overtime worker-hrs, labour cost, material cost, transportation cost were all generated endogenously. Few variables like average selling price and factory overhead costs are exogenous variables. These variables incorporated in the models have been conceptualized and established for construction as well as precast industry. In this model the change in behaviour is consistent with the expected outcome from boundary relaxation.
Parameter verification: The parameter values used in the model building are consistent with body of knowledge of the precast construction industry. The values provided for the model were based on an actual case-study from a medium scale precast factory in Australia and were confirmed through expert interviews. The parameters such as crew size, overtime, production throughput and different cost parameters were all verified from case-study data and interviews. The critical production loss factors: fatigue, increase in crew size, work area congestion values were extracted from previous literature and applied to the model.
Structure verification: This test determines the consistency of the model when compared to the real system in question. For example, in this model once the crew size or the overtime is changed the productivity of the activities, and the labour cost is changed accordingly (Table 6). This change is also affected to the final stock and flow cost model where the total cost to produce a unit and final profit/loss of the company is adjusted subsequently (Table 7). As discussed in parameter verification all the variables used in the model has its real-life counterparts and thus further verifying the model structure.
Extreme condition test: The developed models were tested under extreme conditions for the robustness. Extreme values were input into the model parameters and behaviour of the model was tested under these conditions and compared with real-life system. The simulations revealed the models behaved similar to these actual conditions of precast factories. The impact of critical variables such as overtime, crew size and production throughput on labour productivity and profitability of the company were analysed during the sensitivity scenario analysis of the model.
4. Results and discussion
4.1 Precast concrete manufacturing process (PMP)
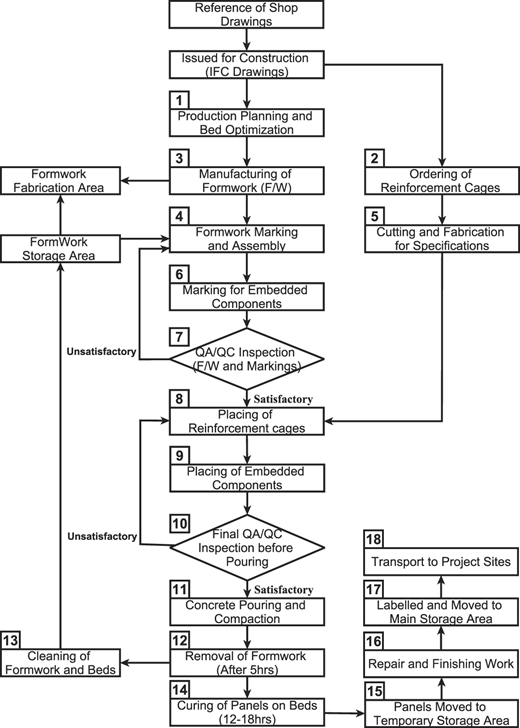
The manufacturing process was argued as the main bottleneck for OSC having the most significant impact on overall productivity across cost, schedule, and quality aspects (Wang et al., 2018). Typically, manufacturing constitutes of 75–90% of total work done and 75–80% of total budget allocation for a precast project (Mao et al., 2016; Joshi, 2021). We presented a detailed 18-step manufacturing process for precast concrete units through data gathered from previous literature, and interviews from precast professionals (Figure 2). The basic flow of activities is the same for all scenarios considered in the study.
The most critical bottleneck activities for precast manufacturing process impacting the labour productivity identified by industry professionals were reinforcement cutting and fabrication (Step 5) (Kim et al., 2020, 2021; Gusmao Brissi et al., 2022) and concrete curing (Step 14) (Ramezanianpour et al., 2013; Alghazali et al., 2020). The reinforcement requirements vary for different projects and within the project itself and further need arises to custom tie and pre-tie for most of units. Considerable reinforcement tying work and additional bars must be added even after the reinforcement cages are placed inside moulds. Minimum curing requirement of 12 hrs is also a limiting factor for labour productivity at the factory as units cannot be shifted from beds to storage area before specific strength parameters are achieved. Additionally, formwork and concreting pouring and finishing activities have been identified as having a significant bearing on the overall manufacturing labour productivity (Lee and Ham, 2018; Reichenbach and Kromoser, 2021). In this study the authors investigated five (5) manufacturing processes: reinforcement, formwork, concreting, crane operation, and finishing using SD modelling approach. These activities were selected due to their high impact on labour productivity and the potential to control and improve when compared to activities such as curing.
We carried out a preliminary investigation for the labour productivity and cost for these main activities using the empirical data gathered from a medium scale precast manufacturing factory in Australia (Table 5). The average daily production throughput of the factory was taken as 25 Units with a total crew size of 22 workers. For these preliminary calculations overtime allocation and the productivity losses during the process were not considered. The cycle time for the factory was estimated as 3.0 Units/hr considering an 8.0-hour daily work schedule and an average volume of 2.75 m3/Unit. The preliminary investigation identified reinforcement as the most labour-intensive activity with the lowest productivity and highest labour cost. The most expensive activity can be assumed as concreting work as a significant portion of cost is allocated for one worker although the work hours is only 35% compared to reinforcement. For an accurate interpretation of these findings, simulations have to be carried out for different sensitivity scenarios for dynamic precast manufacturing system.
4.2 Productivity constraints for PMP
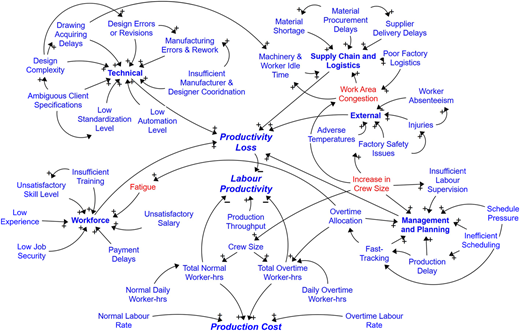
We investigated various productivity constraints through an extensive literature review and series of expert interviews conducted with industry professionals in the precast concrete manufacturing industry. The 32 most significant factors were grouped under five main areas and ranked according to level of influence on labour productivity (Table 1). A causal-loop diagram (CLD) was constructed incorporating these literature and expert interview findings to further analyse the inter-relationships of these main constraints identified (Figure 3).
The qualitative analysis of the labour productivity constraint model revealed the critical factors having the highest impact on productivity to be worker fatigue (W1), increase in crew size (M1), work area congestion (S1), delays in receiving drawing (T1) and adverse temperatures (E1). From these five factors, delays in receiving drawings and effect of adverse temperatures were difficult to accurately estimate and incorporate in the model. Hence, we used fatigue, crew size increase, and work area congestion as the three main productivity loss factors in the SD labour productivity model. From the above factors, the literature identified worker fatigue to have the highest impact on labour productivity for construction industry. O’Neill and Panuwatwanich (2013) argued the negative effect of fatigue on productivity for construction could vary between 5–15%. This was further verified by interviews with precast managers in Australia who estimated an approximately 10% loss in productivity during overtime work. These loss percentages due to fatigue were also consistent across studies carried out by Parody et al. (2020) for manufacturing companies. For the case of crew size increase, Mattila et al. (2007) discussed the productivity loss could vary from 5% up to 18% depending on the percentage by which crew size was increased for construction industry. As the increase in crew size is capped to 20% of baseline for the case-study, only 5% productivity loss was 5% productivity loss was assumed for the SD model. Dabirian et al. (2023) argued the loss in productivity from work area congestion to be 10–30% for traditional construction sites. The expert interviews revealed that this loss is relatively lower for precast factories compared to in situ construction, and this value was estimated to be around 5%, which was used for the proposed model.
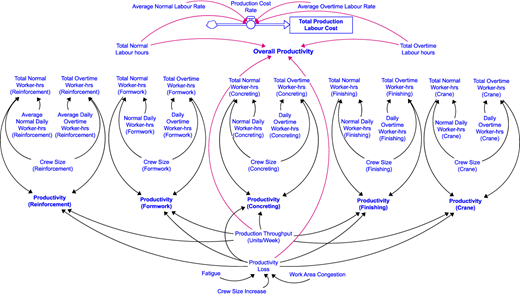
4.3 Labour productivity model for PMP
A quantitative SD model was constructed for overall PMP (Figure 4). The model simulated five main activities for PMP: reinforcement, formwork, concreting, finishing and repair, and crane operation under eight different sensitivity scenarios (Table 6). The sensitivity scenarios were selected based on industry professional feedback and from actual case study data from the precast factory. The baseline scenario is the current levels of workforce, productivity rates, resource allocation, and cost structures used assuming there’s no productivity loss from external factors. Further it is assumed that there are no changes or improvements made to the current system, such as no increase in overtime (OT), no changes in crew size, and no implementation of new technologies or processes. The different scenarios (1, 2, 4, 5 and 7) were simulated to investigate the productivity variations when production was increased by 10%, 20% and 40% from baseline scenario. The 10% and 20% increases were accommodated by increasing the overtime allocation or crew size whereas for a 40% surge in production both overtime and the crew size had to be increased. Similarly, simulations were carried out for decrease in productivity by 10%, 20% and 40% where the same baseline crew size had to be employed. Where, 40% is the theoretical maximum throughput of the system with the given constraints on space, labour and equipment availability for the considered case study. This value may vary based on the size and facilities available within from factory to factory.
The model considered three main productivity loss factors: fatigue (10% applied only for overtime), crew size increase (5%), and work area congestion (5%) for the overall productivity calculations. These were used due to their high impact on productivity and are quantifiable compared to other factors of the qualitative model. The authors identified several factors such as delay in receiving drawings, material delivery delays, machinery breakdown and poor factory logistics which may have a significant impact on the productivity. Most of these factors are difficult to forecast and generalize as their impact vary from factory to factory and quantifying these factors accurately for the precast industry is not practical. Hence for this study only the above three parameters were used.
4.4 Model application for case-study
The proposed system dynamic model was employed for a case-study at a medium scale precast concrete manufacturing facility in Australia. The maximum weekly production throughput for baseline scenario of the facility was 175 Units and total production crew size was 22 workers. The complete set of input variables used in the model are presented in Table 4. It was assumed that the baseline scenario was for 100% production capacity of normal workforce with no productivity loss from any factors.
The results for the baseline scenario calculated the productivity of overall PMP as 0.162 Units/Worker-hr which was the maximum productivity across all scenarios (Table 6). For individual activities the highest productivity was simulated for finishing and crane operation (3.125) followed by concreting process (1.125). The lowest productivity values were obtained for reinforcement (0.391) followed by formwork (0.480). These results suggest the critical bottlenecks in PMP to be reinforcement which equates to only 35% of the concreting productivity. The results of this study are consistent with previous research carried out by Chen et al. (2016, 2020a) and Reichenbach and Kromoser (2021).
The comparison of Scenarios 1 and 2 where throughput was increased by 10%, produced 4% loss in productivity when overtime was allocated whereas for increase in crew size the value was significantly higher (23%). This loss increased to 9% when throughput was increased to 20% (Scenario 4) under the overtime scenario, while the loss from crew size increase reduced to 17% as the same crew for 10% throughput increase was able to deliver the new output (Scenario 5). These results highlight overtime allocation maybe the best solution when increase in throughput is relatively low. For Scenario 7 both overtime and crew size were required to be increased to achieve 40% increment of production throughput which also led to 26% loss in overall productivity. In scenarios 3, 6, and 8 where production throughput had to be reduced, productivity values decreased significantly by 10%–40% from the baseline as the same permanent crew had to be allocated even though throughput decreased due to other factors.
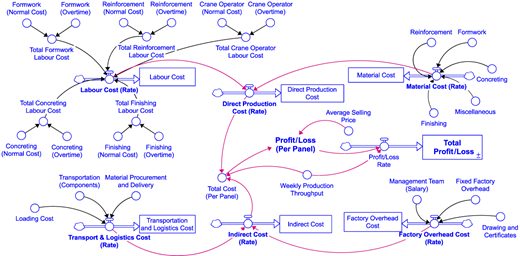
4.5 Cost model for overall PMP
We developed an SD stock and flow model to analyse the profitability of PMP incorporating all costs and revenue of the process. This model was also tested using industrial data from the case-study and provides an insight into the PMP and its cost breakdown which lacks previous practical case-study investigations. The structure of the model consists of five main stocks: direct production cost (labour cost, and material cost), indirect cost (transport and logistics cost, and factory overhead cost), and total profit/loss (Figure 5). The total profit/loss was determined by considering the total revenue flow and total cost flow of the precast production facility. The complete set of input variable used in the model is presented through Table 4.
Cost breakdown highlighted the main direct cost source as material cost which accounted for more than twice the labour cost whereas main indirect cost was from the factory overheads (Table 7). The baseline simulation results for weekly analysis period provided the average cost to produce one unit as $2,052 while the profit was calculated as 448 $/Unit. The results show that the material and other indirect costs are less controllable compared to labour cost which can be potentially reduced by achieving a higher labour productivity. These results align with the findings of (Mao et al., 2015, 2016) carried out for traditional construction.
For Scenarios 1 and 4 where the throughput was increased by 10% and 20% using allocation of overtime the profit per panel decreased by 9% and 18% respectively. The impact on total profitability was minimal due to the increased revenue for above scenarios (Table 7). Whereas for Scenarios 2 and 5 when the throughput was increased using additional work force the total profit simulated 18% and 8% reduction respectively confirming the simulation results of SD productivity model. The highest profitability of $90,650 was simulated for scenario 7 where the throughput was increased by 40% by allocating overtime and increasing crew size simultaneously. When the throughput is reduced by 40% the results simulated a potential loss of $6,405, highlighting the importance of achieving the maximum production capacity.
5. Conclusions
This study presented a SD modelling approach for the prediction and improvement of labour productivity and investigation of costs associated with the PMP. Previous research often relied on static models or focused on isolated aspects of the manufacturing process, whereas our approach integrates multiple activities and their interactions, offering a dynamic and holistic view of the productivity and costs in PMP. A key contribution of this research is the application of the SD model to actual industry data from a medium-scale precast manufacturing company, allowing for the testing of different sensitivity scenarios. This real-world validation of the model provides robust, actionable insights that are directly relevant to industry practitioners, setting this study apart from more theoretical works. The findings of the study indicate that among the manufacturing activities considered, reinforcement is the least productive followed by formwork indicating that there may be inefficiencies or challenges associated with these PMP activities. This targeted identification of bottlenecks contributes to the literature by providing empirical evidence of where and how productivity gains can be achieved within the PMP. Exploration of alternative techniques or systems, efficient resource allocations, technologies or process optimizations that can streamline and expedite the process are recommended to improve the productivity of these bottleneck activities.
For the OSC to be a viable option the production throughput has to be increased considerably to counter the subsequent escalation of costs from increased workforce and to better distribute the sunk costs. Integration of novel OSC principles such as repeatability of units, standardization, automation, and digitalization into the PMP has the potential to significantly improve productivity of the process. The results further highlighted, overtime allocation as the best solution compared to increasing crew size, for a potential fast-tracking scenario where a relatively low throughput increase is expected (10–20%).
In conclusion, this study provides insights into the PMP and the potential to improve productivity and increase viability of its adoption through realizing its potential benefits. The authors believe this research extends the current body of knowledge by offering a flexible and robust simulation tool for productivity and profitability analysis in precast manufacturing, grounded in real-world data and focused on practical improvements. The limitation of the study is that it only concentrates on SD simulation method, and we recommend further research using other approaches such as mathematical modelling and discrete event simulation (DES) to extend these findings. Other critical productivity constraints such as delays in receiving engineering drawings, worker skill level, and adverse temperatures which were not used in this study can be quantified and incorporated for future models. Further, only the factory overheads were considered in addition to direct and indirect costs directly associated with precast production for this profit/loss calculation. Overheads such as head-office expenses, and taxes were not considered for these calculations. Future research incorporating precast logistics is recommended as an efficient logistics process optimizing transport, storage, and on-site installation, maximizes labour and equipment utilization, leading to faster project completion and lower costs.
The authors would like to acknowledge the contributions from various industry professionals that provided input to this article.
Disclosure statement: No potential conflict of interest was reported by the authors.
Ethics statement: This research has been reviewed and approved (LR, 2023–6,693–12998) by the University Human Research Ethics Committee (UHREC) of Queensland University of Technology (QUT) or delegated review body as meeting the requirements of the National Statement on Ethical Conduct in Human Research (2007, updated 2018).
Data availability statement: Some or all data, models, or code generated or used during the study were provided by a third party and are confidential in nature and may only be provided with restrictions (e.g. anonymized data from precast companies). Some of the data, models, and codes supporting this study’s findings are available from the corresponding author upon reasonable request.