

Background: A range of local social and environmental factors has an impact on farmers' views of climate change and choices on the use of coping mechanisms. This study examines the factors that are limiting farmers' perceptions of climate change and their coping mechanisms in Gimbi district, Western Ethiopia.
Methods: A household survey and focus group discussion were employed to collect relevant data. A total of 402 randomly selected households and six focus group discussions containing 72 participants were used to gather data. Binary logit models were used to analyze the collected data.
Results: Farmers noted that some of the signs of climate change included increasing temperature, erratic rainfall, late onset of rainfall, and early cessation of rainfall. We discovered that there are three distinct sets of climate adaption strategies used by farmers: crop management, soil and water conservation and intensive farm management. The primary determinants of farmers' perceptions of climate change and adaptation techniques were household head age, education, soil fertility, market access, and agricultural training. Age, education, and soil fertility level were the characteristics that significantly impacted farmers' perspectives and coping mechanisms among the primary drivers evaluated in the area. Use of agroforestry, shifting planting dates, and fertilizer application were all essential farming practices used as climate adaptation measures.
Conclusions: Both socioeconomic and environmental factors have found to affect farmers' perceptions of climate change in the area. The existing socioeconomic and environmental factors, in turn, affect their choice of strategies to adapt to climate change. When implementing climate change adaption strategies, it is critical to assess farmers' level of awareness of climate change and their coping strategies, as well as the factors limiting their ability to adapt to climate change.
Introduction
Climate change has had a significant impact on food production and agriculture worldwide (Alemu & Mengistu, 2019). According to the Intergovernmental Panel for Climate Change (IPCC) (2014) projection report, agricultural output in developing nations will decrease by approximately 50% with a minimum rise in global temperatures (1–2 °C). Sub-Saharan Africa is highly susceptible to the impacts of climate change and variability owing to rainfall-dependent agriculture and its weak adaptive capacity (Matewos, 2019). The adverse magnitude of this alteration mainly affects the livelihoods of the agrarian communities living in the region (Kalele et al., 2021). Climate change continues to be the most momentous challenge for agricultural development and food security across Sub-Saharan Africa (Arora, 2019).
The world is now concerned with how to lessen the consequences of a changing climate and coping measures (Eriksen et al., 2021). Farmers use adaptive strategies to respond to the effects of climate change. Socioeconomic conditions and local environments play a significant role in the success of adaptation strategies in different parts of the region (Chersich & Wright, 2019; McKinley et al., 2021). Various environmental and social factors affect farmers’ perceptions of climate change and their decisions to use particular coping strategies (Wondimu et al., 2022; Yoosefi Lebni et al., 2020). For instance, owing to climatic changes, smallholder farmers may change domestic crop cultivation to new and more adaptable crop types, but doing so may reduce their productivity (Belay et al., 2017). Consequently, the effectiveness of an adaptation strategy depends on the participation of numerous stakeholders (Prutsch et al., 2018; Wamsler, 2017).
Evidently, it is crucial to investigate adaptation measures to reduce the anticipated adverse impacts of climate variation (Fawzy et al., 2020; Raza et al., 2019). As a strategy to help smallholder farmers lessen the existing outcome of a fluctuating environment, it has been acknowledged that having the capacity to adapt to the changing climate is commonly endorsed as a policy priority (Belay et al., 2017; Raza et al., 2019). Various studies have been conducted to examine and identify the factors influencing farmers’ adaptation decisions to address the main problems caused by climate change and to recommend the best adaptation mechanism choices. The findings of such studies were largely aimed at agricultural productivity changes and/or suggested adaptation measures towards the changing climate. This is a serious drawback because a range of factors affect farmers' responses to changing environmental factors and their coping techniques.
The impacts of climate change and the variables influencing the selection of adaptation in African agricultural systems have been analyzed using various methods (Marie et al., 2020; Mwinkom et al., 2021). Owing to the diversity of the countries studied, it is extremely difficult for collective research to offer insights into identifying country-specific impacts and adaptation possibilities (Eriksen et al., 2021; Sitati et al., 2021). As a result, these studies did not address socioeconomic and environmental issues or agro-ecological aspects within each explicit area. In other words, the adoption of coping strategies to adapt to a changing climate is specific to the environment, and it limits the role of adaptation measures across different localities.
Ethiopia, like many other African nations, is incredibly susceptible to climate unpredictability and change (Asrat & Simane, 2017). Most of the country’s population obtains food, employment, and money from agriculture. For instance, the agriculture industry is responsible for roughly 40% of the GDP, 75% of employment, and 80% of exports (USAID, 2021). Even though it contributes significantly to the economy as a whole, Ethiopia's agriculture industry is currently fundamentally vulnerable to climate-related catastrophes like drought (Mekonnen et al., 2021). Furthermore, data indicate that Ethiopian agriculture is well-known for its minimal dependence on external inputs, which makes it susceptible to any climatic or related factor change (Shukla et al., 2021; Zerssa et al., 2021).
As attested, most findings on climate change conducted in the country have mainly focused on food production and soil fertility management. However, the level of knowledge about coffee farmers' perceptions and adaptation measures to climate change and the limitations of their strategies remain limited. As a result, there are limitations in addressing perception and adaptation strategies as the determinants of adaptation strategies. Hence, this study has focused on (1) assessing farmers’ understanding and coping measures to the changing climate and (2) investigating the determinants of smallholder coffee farmers’ adoption of coping strategies in Gimbi district, Western Ethiopia.
Methods
Ethics statement
The researchers obtained a formal support letter from Addis Ababa University. The letter was submitted to the West Wollega Zone Administration Office, and its consent was obtained. The zonal administration office then wrote an official letter to the Gimbi District Environmental Protection Office (GDEPO), where the study was conducted. Based on this, the GDEPO wrote a permission letter to the researcher and copied it to the kebele administrations of the respective kebele to cooperate with the research. In view of that, the kebele administration arranged the dates (starting from March 2, 2020) and the places where to contact the households and focus group discussants for the interviews and the discussions. Accordingly, verbal informed consent was obtained from the households, discussants, and informants before data collection in conformity with the anonymity of the study participants. Furthermore, the COREQ guidelines for reporting focus group discussions have been applied (see Chemeda, 2022).
Description of the study area
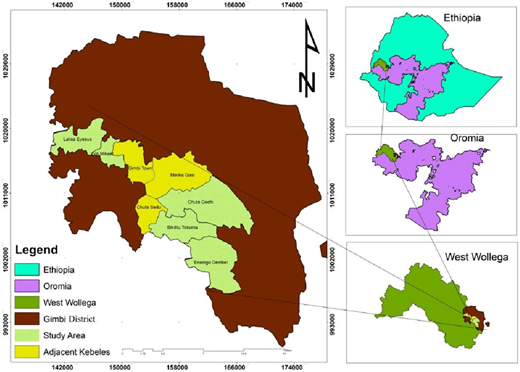
Gimbi is located in Oromia National Regional State, Western Ethiopia, between 142000 and 174000 E (UTM) and 993000 and 1029000 N (UTM) (Figure. 1). The area has an altitudinal range of 1200–2222-m a.s.l. and includes the lowland and midland altitudinal zones. Haru borders the district to the south, west by Lalo Asabi, north by Gumuz, and east by the East Wollega Zone. It has 32 rural kebeles. The area's typical annual minimum and maximum temperatures range from 10 °C to 30 °C, with an average annual rainfall of 1400–1800 mm.
The total population of the district was estimated to be 163,480 (WWZANRO, 2020). About 83,099 were men and 80,381 were women. It covers 1,183.44 km2 with 124.8 inhabitants per km 2. The typical rural land holding size is approximately 1.2 ha and 0.8 head of livestock. Approximately 21% of the population is engaged in jobs that are unrelated to agriculture.
The rivers and streams flow year-round and seasonally throughout the study area. The rainfall hass a bimodal pattern, lasting from June to September, followed by a long dry period from October to April. A prolonged drought season, known locally as Bona, lasts from mid-October to April, and sometimes into May (data obtained from the district agricultural office and personal communication, March 2020).
A large portion of the area is endowed with potential agricultural production that is mainly used for small-scale farming. The principal crops grown area coffee, sesame, corn, beans, bananas, pumpkins, fruit, sweet potatoes, cardamom, and sugarcane. Coffee farming predominates in the district's southwest, while other crop products dominate in the northeast. It is also rich in small ruminant animals, incense, and gum resources. Nearly all crops, whether grown commercially or by small farmers, are cultivated using rainwater, except for a few places that are used for vegetables and fruits. Approximately 90% of the district's land is agricultural, and coffee, sesame, and corn are the most popular marketable goods.
Sampling techniques
A multi-stage sampling procedure was used in the actual data collection. First, western Ethiopia was chosen as the primary study area. Second, of the 20 districts in the zone, the Gimbi District was selected. Third, out of 32 kebeles in the district, six kebeles were selected based on their altitudinal representatives and agricultural practices. Accordingly, the Enango Dembel and Aba Sena Kebeles from the lowlands, Choli Mikael and Melka Gasi Kebeles from the midlands, and Bikiltu Tokuma and Lelisa Yesus Kebeles from the highlands were selected. The total households (n) that were sampled in each kebele were determined using a proportionate to size sampling strategy using a study sample that was received from the pertinent agricultural sectors.
The primary data were collected from the households, such as from community elders, youth, and females, Development Agents (DAs), and different experts in the district and the zone. The questionnaire for the study was prepared based on literature from prior research and a preliminary survey conducted a month before the study. Before starting the actual data collection, the questionnaire was pre-tested (piloted). In addition, the reliability and validity of the questionnaire were attested. Based on the pretest results, the necessary modifications were made to the questionnaire.
Focus group discussions (FGDs) were also conducted. During the study period, there have been security concerns in the area. Due to this, it was impossible to move from village to village to get participants at their homes. As a result, once the sampling was determined, it was decided to approach the participants face-to-face in public places such as kebele offices, farmer training centers (FTC), health centers (HC), traditional local institutional (TLI) (e.g., Idir and Afosha), and ritual places. Based on this, a farm household survey with 402 interviews and six focus group discussions with 72 participants was conducted regardless of gender, farm size, or wealth level (Table 1). The six focus group discussion topics were classified into three themes separately to address the intended perception, adaptation strategies, and determinant factors investigations. The discussion was topic guided to get views of the participants and identify their experiences of their climate change perceptions and adaptation strategies. There was not anybody else present besides the participants and researchers during the discussions.
Variables used to assess perceptions and adaptation strategies of smallholder farmers.
| Variable | Description | Expected sign |
|---|---|---|
| Gender | 1 if male and 0 if female (Dummy) | – |
| Education | 1 if obtained a minimum of primary education, 0 otherwise (Dummy) | + |
| Marital status | 1 if married with a couple, 0 otherwise (Dummy) | ± |
| Age | age in years (Continuous) | ± |
| Farming experience | farming experience in years (Continuous) | + |
| Size of household | no of individuals in the HH (Continuous) | + |
| Occupation | 1 if farming, 0 otherwise (Dummy) | + |
| Off-farm activities | 1 if engaged in off-farm, 0 otherwise (Dummy) | – |
| Income from farm | Total income from farm activities (Continuous) | + |
| Income from non-farm | Total income from non-farm activities (Continuous) | ± |
| Size of farmland | Total farm size in hectares (Continuous) | + |
| TLU | Reference total tropical livestock units (unit less number) (Continuous) | + |
| Market access | Distance to input markets (km) (Continuous) | – |
| Farmland distance | Distance to output markets (km) (Continuous) | – |
| Credit access | 1 if accessed credit, 0 otherwise (Dummy) | + |
| Agricultural training | 1 if accessed training, 0 otherwise (Dummy) | + |
| Extension services | 1 if accessed extension, 0 otherwise (Dummy) | + |
Information on farmers' understanding of and coping measures for the changing climate and its impact on crop production was considered the main study factor. In addition, soil management techniques, crop production and livestock management practices were also evaluated. The assessment principally included tree planting, soil and water conservation, agroforestry, fertilizer application, improved crop variety, shifting planting dates, crop diversification, drought resistant crop, small-scale irrigation and livestock adjustment. The information sources that farmers use to cope with climate change were considered. It was not possible to audio record the discussions. Instead, field notes were taken during the focus group discussion and used for data. For these discussions, the average time taken was 150 minutes.
Data analysis
In this study, demographic and socioeconomic data were summarized and presented using descriptive statistics such as frequency, percentage, graphs, figures, and tables. In addition, t tests and Chi-square tests were used in order to compare the difference among groups for different socioeconomic and demographic variables. This test is mainly employed to know whether the difference is statistically significant or not.
The descriptive statistics were used to analyze categorical variables, including education, gender, and marital status. Similarly, other categorical parameters were analyzed, including credit access, agricultural training, and extension services. The t-test statistical analysis was employed for the continuous variables including age, farming experience, household size, farm income, farmland size, tropical livestock unit (TLU), market access, and distance to farmland (Table 1).
As indicated by Kpadonou et al. (2017) and Mairura et al. (2021), although multivariate probit modeling has been employed in different studies to examine the factors that influence a farmer's decision to adopt a variety of technologies, this was inappropriate because the study's main focus was on the farmer's individual strategic choices. Therefore, we employed the binary logistic models to assess the variables affecting smallholder perceptions and coping strategies. For this analysis, Microsoft Excel, SPSS and STATA version 12 were used.
where, p represents the possibility of adopting a coping measure, 1- p is the possibility of not adopting a coping measure. β 0 was the intercept, β 1, β 2 … β j were the regression coefficients of determinants, and X 1, X 2 … X j represented the social and environmental explanatory variables.
Results and discussion
Socioeconomic and demographic aspects
The study identified that the average age of coffee smallholder farmers, who participated both in interviews and in focus group discussions (FGDs), in Gimbi district was 47 years. The minimum and maximum ages were 20 and 90, respectively. During the study period, 23% were under 35 years of age, 69% were in the range of 36–65 years, and 8% were above 65 years (Table 2), while the age and education levels of the focus group participants were different from those of surveyed households across the agroecological zones (Table 3). All kebeles had a different number of years of farm experiences (29 years on average) and household dependency ratios (0.3). The average TLU was 1.32, with the lowest at 0.78 and the highest at 1.88. The landholding size of the farmers ranged from 0.125 ha to 6 hectares. In terms of soil fertility, 39% of cultivable land was prone to erosion, 50% was moderately sensitive, and 11% was unaffected.
Respondents’ socio-economic characteristics by study area base with their respective kebeles AB = Aba Sena, ED = Enango Dembel, BT = Bikiltu Tokuma, MG = Melka Gasi, LY = Lelisa Yesus, CM = Choli Mikael.
| Farmers’ characteristics | Categories of the farmers | Study area base | |||||||
|---|---|---|---|---|---|---|---|---|---|
| Lowland | Midland | Highland | |||||||
| AB | ED | BT | MG | LY | CM | Total | |||
| Gender | Male | 67 | 67 | 62 | 67 | 53 | 42 | 358 | |
| Female | 0 | 0 | 5 | 0 | 14 | 25 | 44 | ||
| Age | 35 and below | 28 | 33 | 13 | 0 | 0 | 18 | 92 | |
| 36–50 | 30 | 17 | 24 | 51 | 24 | 28 | 174 | ||
| 51–65 | 9 | 17 | 26 | 16 | 19 | 17 | 104 | ||
| Above 65 | 0 | 0 | 4 | 0 | 24 | 4 | 32 | ||
| Education | Illiterate | Can't read & write | 0 | 23 | 5 | 8 | 29 | 18 | 83 |
| Literate | Primary school | 13 | 29 | 21 | 25 | 5 | 13 | 106 | |
| Secondary school | 36 | 6 | 14 | 18 | 14 | 24 | 112 | ||
| High school | 18 | 9 | 27 | 16 | 19 | 12 | 101 | ||
| Occupation | Farming alone | 45 | 40 | 55 | 24 | 59 | 35 | 258 | |
| Farming and off-farm | 22 | 27 | 12 | 43 | 8 | 32 | 144 | ||
| Total | 67 | 67 | 67 | 67 | 67 | 67 | 402 | ||
Focus group discussion participants’ socio-economic characteristics by study area base with their respective kebeles. AB = Aba Sena, ED = Enango Dembel, BT = Bikiltu Tokuma, MG = Melka Gasi, LY = Lelisa Yesus, CM = Choli Mikael.
| Study area base | |||||||||
|---|---|---|---|---|---|---|---|---|---|
| Lowland | Midland | Highland | Total | ||||||
| Farmers characteristics | Categories of the farmers | AB | ED | BT | MG | LY | CM | ||
| Gender | Male | 8 | 7 | 8 | 7 | 9 | 9 | 48 | |
| Female | 4 | 5 | 4 | 5 | 3 | 3 | 24 | ||
| Age | 35 and below | 2 | 1 | 2 | 3 | 1 | 2 | 11 | |
| 36–50 | 5 | 5 | 3 | 5 | 7 | 6 | 31 | ||
| 51–65 | 2 | 4 | 6 | 3 | 1 | 4 | 20 | ||
| Above 65 | 3 | 2 | 1 | 1 | 3 | 0 | 10 | ||
| Education | Illiterate | Can't read & write | 1 | 0 | 0 | 0 | 2 | 0 | 3 |
| Literate | Primary school | 9 | 8 | 10 | 9 | 7 | 7 | 50 | |
| Secondary school | 2 | 3 | 1 | 3 | 2 | 3 | 14 | ||
| High school | 0 | 1 | 1 | 0 | 1 | 2 | 5 | ||
| Occupation | Farming alone | 8 | 10 | 9 | 11 | 8 | 7 | 63 | |
| Farming and off-farm | 4 | 2 | 3 | 1 | 4 | 5 | 19 | ||
| Total | 12 | 12 | 12 | 12 | 12 | 12 | 72 | ||
Farmers’ climate change perception and farming trends
According to interviews and focus group discussions, 20 years ago, rainfall in the district was more predictable and had a more regular pattern. During those periods, there was usually sufficient rainfall throughout the season for agricultural production. In general, most of the respondents (93%) believe that climatic patterns have changed over the last two decades. Only 7 % did not detect any changes in climatic characteristics.
The focus group participants identified the current farming activities and discussed the trends for the past two decades relating to climate change. The main farming system mentioned by the participants was mixed farming, which was mostly rain-fed. They cultivate different types of crops, which are dominated by coffee and the rearing of animals. They also identified the major crops that are planted in the long rainy season and the short rainy season. Both cash crops and others are produced in the area. Participants responded that the productivity of several crops is declining from time to time compared to those that were produced two decades ago. A few crop types are not produced, and other crops replace them. For instance, previously peas and beans were produced in the area, but now corn and coffee replace them.
“I think the farming system I am following is problematic because the types of crops I am cultivating are inadequate due to environmental limitations. Formerly, I could produce different crops, including peas and beans, but now I cannot produce them in the period two decades ago. Additionally, the land I manage is getting infertile, and I am looking for additional land for cultivation, but I could not get that. My cattle do not have enough grass to graze as there is no free land available, and as a result, their productivity is decreasing. I am selling these and using the proceeds to buy food.” (Participant-1)
Due to this, the farmers ought to cultivate additional land by removing forests to increase production. However, they are facing problems with forest cover and biodiversity reduction, which result in soil fertility decline and increased fertilizer costs. Throughout the conversation, each person has articulated his or her individual point of view. A few of the participants who did not perceive the presence of climate change think differently. They believe that the drying of rivers, the reduction of forest cover, extreme weather conditions, the prevalence of diseases, the reduction of crop production, etc. are the punishment of the creator that came to them because of the evil deeds of people.
“Well, I guess that the shortening of rainfall seasons and intermittently unseasonal rainfall shows the changing of climate. I perceive that the temperature is increasing while the rainfall amount is decreasing. Droughts, disasters, floods, and pests and diseases are all becoming more common on our farm.” (Participant-2)
“… it is obvious that our area was known for its forest coverage and coffee production. Now everything has changed following the forest cover change. Biological diversity is changing, soil fertility is unable to recover, rivers are drying, and irrigation farms are being depleted. I think we are cursed.” (Participant-3)
Additionally, farmers have addressed extreme temperatures and the unpredictable onset or offset of rainy seasons in the last two decades. This study is inconsistent with the findings of a study conducted by Mairura et al. (2021). Their research reported that 80% of participants perceived a temperature rise, whereas approximately 76.3% of them perceived a decline in precipitation in the past decade in the central highlands of Kenya. Similarly, Teshome et al. (2021) explained that most farmers notice increasing temperatures and decreasing rainfall. Furthermore, Dula (2018) reported that in Abeshege Woreda, Ethiopia, approximately 93% and 85% of the respondents perceived an increase in temperature and a decline in precipitation, respectively.
Indicators of climate change and its effects
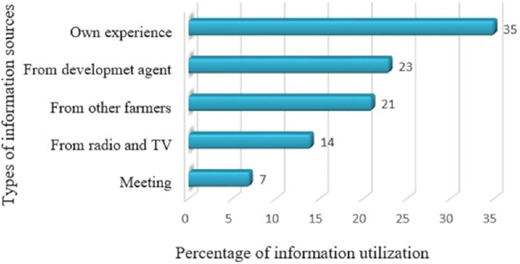
Respondents said that they obtain information about climate change from different sources (Figure 2). About 35% of the respondents were aware of the changing climate and its impacts from their life experiences and external information sources. Respondents also stated that informal communication increased public understanding of climate change. External information sources commonly used by smallholder farmers include the mass media, agricultural extension agents, and seminars (Figure 2). Farmers perceived that climate change had caused an intermittent condition that resulted in a shift in crop production due to a high prevalence of pests and diseases and reduced crop and livestock productivity in the area.
“I think the crop variety and productivity reduction will continue as our village population is increasing. The rainfall reduction is affecting the rain-fed farming. Our forest cover is declining from time to time. Since it is because of our unwise resource usage and population growth, the agricultural productivity reduction will be worse than ever before.” (Participant-4)
“… you know that our livelihoods depend on agriculture, and the current situation is getting worse because our land is not producing sufficient food. The types of crops we produce are being reduced, and some crop types are replaced them. Even with fertilizer, rainfall is insufficient to cultivate what we require. I tend to plant coffee crops while integrating some other complementary crops. "But still, I am unable to stop cutting trees and maintain forests as fuelwood and charcoal making are part of my livelihood.” (Participant-5)
Findings also reported a similar result that addressed the perception of farmers on an increase in temperature and a decline in precipitation as markers of climate change (Affoh et al., 2022; Belay et al., 2021). Most African nations have seen an increase in the yearly average temperature over the past few decades owing to human-induced greenhouse gas emissions (Almazroui et al., 2020). This adversely affects the region’s agricultural productivity. Other findings also stated that climate change is likely to reduce Ethiopian crop production, in particular coffee production, by up to 40% in the 2090s, including the potential loss of suitable planting regions (Chemura et al., 2021).
Adaptation strategies
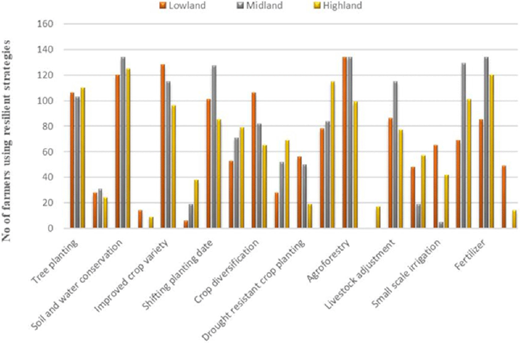
According to the survey and focus group discussions, farmers adopted different strategies to cope with the changing climate in the area. The most common practices farmers used to alleviate the effects of climate change, particularly in the lowlands, were agroforestry and improved crop varieties, followed by soil and water conservation strategies. Most farmers in the midland used conservation of soil and water resources, agroforestry, and fertilizer application at the optimum level and at the same rate (Figure 3). Highland farmers primarily used conserving soil and water, fertilizer application, and tree planting as resilient mechanisms for climate change adaptation. As a general truth, agroforestry is the main land use system that farmers have used for several decades. The intensity of using the system varies among farming communities across the zones. The reason for the difference is that coffee is the most important cash crop produced in the area that was integrated with tree management, particularly forest resource conservation. Coffee production was previously well known in the lowlands and partially in the midlands, according to farmers. This is inconsistent with the findings of Asrat & Simane (2018) and Ahmed et al. (2021).
“I could understand my environment from my observation, through training obtained from a development agent, from radio, and from different meetings held to discuss on climate change issues in my kebele. I mainly cultivate coffee crops and other integrated seasonal crops. As a result, I like to plant trees, conserve soil and water, and protect multipurpose trees on my farm that are used for fruits, fodder, fencing, and fuelwood. This helped me adjust myself and my family to living and working in the area.” (Participant-6)
Farmers stated that crop type or variety shifting was taking place because of rising temperatures and erratic rainfall. For instance, coffee has become the main crop type that is substituting practically everywhere in the area, with various levels in different agroecological systems. Farmers have adapted to appropriate coffee crop management by conserving the various tree species that comprise the agroforestry system. They had largely practiced tree planting and integrated coffee with shade trees over time, eventually progressing to incorporating other crop types into the system. As a result, agroforestry has now spread widely from the lowlands and midlands to the highlands. Most farmers cultivate crops compatible with coffee agroforestry systems, and at the same time, they opt to produce climate change-resistant varieties. As a result, agroforestry has spread widely from the lowland and midlands to the highlands. Consequently, teff, corn, sorghum, and various spices make up the main crops cultivated in the region after coffee.
“… I guess that I would continue adjusting to the changing climate by tree planting with coffee, using crop diversification, improved crop varieties, and drought resistant crops. I have observed my environment through my life experiences, as I have lived on a farm for many years, and several factors affect crop productivity. I managed the land fertility problem by diversifying crops on a plot of land, mixing nitrogen-fixing types, rotating crops, and integrating drought-resistant species. What drove me to look for such measures was what I perceived in my surroundings. I noticed a decrease in rainfall, an increase in temperature, floods, and the prevalence of pests and diseases. I also followed the advice of developmental agents and the information I got from other farmers. In addition to crop management, I believe we should plant trees to conserve soil and water.” (Participant-7)
Other adaptation options include boosting agricultural productivity by using additional inputs, particularly fertilizer per unit area, small-scale irrigation, and supplementary irrigation. The farmers also seek for better alternative adaptation strategies that can solve the problem of the changing climate sustainably (Figure 3). This is consistent with previous research reported by Kumawat et al. (2020); Kuyah et al. (2021) and Zerssa et al. (2021).
“In our kebele, the majority of farmers rear animals and cultivate crops using intensive fertilizer applications. Animal rearing has become based on the advice of developmental workers and information obtained from different sources like TV, meetings, and other farmers. Crop production is also supported in a similar fashion to animal rearing. We adopted these practices from our fathers, but we improved on them to adapt to the changing climate. I believe that these adaptation strategies alone would not make our lives better and more sustainable. We have to practice other coping mechanisms to adapt better to the environment.” (Participant-8)
Determinants of adaptation strategies
Farmers used various strategies, but the factors that influenced their decision to use a particular measure varied (Table 4). For example, tree planting and agroforestry, which determine soil and water management strategies, differed significantly across the determinants, except in land holding size. This result agrees with other findings in different regions (Belay et al., 2017; Hirpha et al., 2020; Mairura et al., 2021).
Marginal effects of the model.
| Variables | Soil and water management | Crop management | Intensive farm management | |||||||
|---|---|---|---|---|---|---|---|---|---|---|
| TP | SWC | AF | ICV | SPD | CD | DRC | LA | SSI | FA | |
| Gender | 0.487 | 0.301 | 0.062 * | 0.223 * | -0.692 | 0.357 * | -0.41 | -0.241 | -0.209 | 0.023 |
| -1.01 | -1.12 | -0.58 | -0.29 | (-1.54) | (0.24) | (-0.57) | (-0.51) | (-0.44) | -1.01 | |
| Age | -0.027 ** | 0.0022 | -0.034 ** | -0.036 ** | -0.00829 | -0.0373 *** | 0.0206 * | 0.0164 | -0.0410 *** | 0.0413 * |
| (-2.82) | -0.13 | (-3.00) | (-2.71) | (-0.94) | (-3.76) | -2.04 | -1.89 | (-3.51) | -2.01 | |
| Family size | 0.186 | -0.662 | 0.054 | -0.0665 | 0.230 | 0.078 | 0.124 | -0.105 | 0.127 | -0.113 |
| -2.28 | (-3.86) | -0.59 | (-0.71) | -3.7 | -1.19 | -1.63 | (-1.66) | -2.16 | (-1.06) | |
| Education | 0.206 | 0.662 * | 0.056 | 0.065 * | 0.237 | 0.079 | 0.118 | -0.105 | 0.132 | 0.113 ** |
| -2.18 | -1.84 | -0.61 | -0.68 | -3.7 | -1.14 | -1.09 | (-1.72) | -2.11 | -1.02 | |
| Farm income | 0.0003 | 0.0006 | 0.012 *** | 0.0005 ** | 0.00933 | 0.00148 | 0.019 *** | 0.0047 * | 0.0193 ** | 0.011 ** |
| -1.28 | -1.39 | -2.28 | -2.13 | -3.60 | -0.35 | -1.51 | -2.02 | -1.18 | -1.26 | |
| Non-farm income | -0.00006 | 0.0002 | -0.0002 *** | -0.0001 * | -0.00008 ** | 0.000145 * | -0.0002 *** | 2.69E-05 | 1.97E-05 | -8.3E-05 |
| (-1.54) | -1.49 | (-3.98) | (-3.10) | (-3.01) | -2.52 | (-3.72) | -0.93 | -0.8 | (-1.23) | |
| Farm size | 0.830 *** | 1.96 *** | 0.520 ** | 2.795 *** | 0.436 *** | 0.697 *** | 0.948 *** | 0.68 *** | 0.186 * | 0.764 ** |
| -4.79 | -3.89 | -2.78 | -4.67 | -4.37 | -5.49 | -7.75 | -5.48 | -2.03 | -2.94 | |
| TLU | 0.421 | -0.628 | 0.246 | 0.084 | 0.272 | 0.079 | 0.518 | -0.305 | 0.182 ** | 0.013 *** |
| -1.12 | (-1.24) | -0.61 | -0.68 | -1.7 | -1.14 | -1.09 | (-1.72) | -1.11 | -1.92 | |
| Soil fertility | 1.094 *** | 0.121 | -0.81 *** | -0.423 | -0.183 | 0.00909 | 0.12 | 0.57 *** | 0.0169 | -1.09 *** |
| -4.85 | -0.43 | (-4.19) | (-1.89) | (-1.39) | -0.07 | -0.82 | -3.82 | -0.12 | (-5.09) | |
| Farmland distance | -0.0134 * | -0.0016 | 0.0290 * | 0.005 | -0.019 *** | 0.00279 | -0.025 *** | -0.004 | -0.0051 | -8.7E-05 |
| (-2.29) | (-0.12) | -2.25 | -0.45 | (-3.62) | -0.51 | (-3.59) | (-0.80) | (-1.04) | (-0.01) | |
| Market access | -0.009 *** | 0.001 | 0.008 * | 0.02 *** | 0.01 *** | 0.00472 * | 0.0108 *** | -0.0014 | 0.00746 *** | -0.01 *** |
| (-3.60) | -0.35 | -2.47 | -3.56 | -5.26 | -2.26 | -4.67 | (-0.31) | -3.66 | (-3.46) | |
| Credit access | 0.312 | 0.24 | 0.056 | 0.0051 * | 0.431 | 0.079 | 0.118 | -0.105 | 0.132 * | 0.113 ** |
| -1.18 | -1.84 | -0.61 | -1.68 | -2.1 | -1.14 | -1.09 | (-1.72) | -2.11 | -1.02 | |
| Extension services | 0.811 -1.29 | 0.48 -0.51 | -3.13 **(-3.25) | 1.024 -1.61 | 1.94 -0.01 | 1.024 -1.61 | -2.95 ***(-2.87) | 0.24 -0.36 | 0.019 -0.03 | 0.116 *-1.01 |
| Agricultural training | -0.0945 (-0.17) | -0.306 (-0.37) | -1.083 (-1.21) | -1.208 *(-2.00) | 1.901 (-0.01) | -1.208 *(-2.00) | 1.497 *-2.87 | -0.136 (-0.23) | 0.688 -1.1 | 0.042 **-1.92 |
| _cons | -1.491 | 3.991 * | 4.147 *** | 3.153 * | -0.683 | 0.53 | -4.214 *** | -1.630 * | -0.615 | 5.3 *** |
| (-1.66) | -2.32 | -3.94 | -2.29 | (-0.94) | -0.68 | (-4.16) | (-2.18) | (-0.81) | -3.46 | |
| N | 402 | 402 | 402 | 402 | 402 | 402 | 402 | 402 | 402 | 402 |
Our finding revealed that having a male as the head of the family boosted the likelihood of greater agricultural diversity and variety as adaptation strategies. The odds of employing improved crop variety, crop diversification, and agroforestry as climate change adaptation techniques increased by 22%, 36%, and 6%, respectively, when the household head was a male (Table 4). By this, Wondimu et al. (2022) and Yoosefi Lebni et al. (2020) contend that male household heads have more opportunities than female household heads to put adaptation measures into practice.
Contrary to the usual assumption, the age of the household has negatively affected the decision to use some adaptation techniques while having a positive influence on others (Table 4). The likelihood of employing adaptation techniques like tree planting, increased crop variety, crop type diversification, agroforestry, and small-scale irrigation drops by 2.7%, 3.6%, 3.7%, 2.1%, 3.4%, and 4.1%, respectively, as the household head's age rises by one year from the average. Similarly, previous studies have reached a variety of conclusions on how to adopt certain soil and water protection measures (Yifru & Miheretu, 2022).
“I am a farmer concerned about coping with the changing climate. In comparison to the farmer's holdings in my kebele, my plot of land is average in size. I am trying to manage the production of sufficient food for my family and supply it to the market so I can buy other complementary foods. However, as I got older, I was unable to produce food using intensive farming, and as a result, I preferred to plant trees and raise some animals. I also cannot go to the market to buy agricultural inputs or sell my produce. Market access affected my adaptation choices to cope with the changing climate.” (Participant-9)
According to current findings, we identified that the use of tree planting, agroforestry, shifting planting dates, drought resistant crops, and fertilizer application were not impacted by education when tested at a 5% significant level (Table 4, Table 6). This conclusion is consistent with past findings indicating that education has a positive impact on farmers' decisions to implement soil and water preservation, improved crop variety, livestock adjustment, and small-scale irrigation (Gebru et al., 2020; Negera et al., 2022).
Parameters estimates of binary logit model for climate change adaptation decisions.
| Variables | Soil and water management | Crop management | Intensive farm management | |||||||
|---|---|---|---|---|---|---|---|---|---|---|
| TP | SWC | AF | ICV | SPD | CD | DRC | LA | SSI | FA | |
| Socioeconomic factors | ||||||||||
| Gender | 0.00186 | 0.014 | 0.0018 | 1.084 * | 0.262 | -1.059 * | 0.699 | -0.505 | 0.0187 | -1.09 |
| 0.02 | -0.04 | -0.002 | -2 | -0.69 | (-2.48) | -1.19 | (-1.24) | -0.04 | (-1.48) | |
| Age | -0.027 ** | -0.00511 | -0.029 ** | -0.045 *** | -0.0142 | -0.0343 *** | 0.0196 | 0.0158 | -0.0383 ** | -0.034 |
| (-2.85) | (-0.30) | (-2.59) | (-3.42) | (-1.61) | (-3.50) | -1.92 | -1.83 | (-3.24) | (-3.50) | |
| Family size | 0.109 | -0.663 | 0.210 | -0.0186 | 0.238 | 0.0791 | 0.0919 | -0.141 | 0.128 | 0.079 |
| -1.49 | (-3.77) | -2.23 | (-0.19) | -3.95 | -1.21 | -1.23 | (-2.25) | -2.19 | -1.24 | |
| Education | 0.0328 | 0.712 ** | 0.0154 | 0.437 ** | 0.0163 | -0.00505 | 0.0111 | 0.139 ** | 0.125 ** | 0.0866 |
| (0.61) | -2.62 | -021 | -2.99 | -0.46 | (-0.12) | -0.21 | (-3.25) | -2.91 | -0.92 | |
| Farm income | 0.00003 | 0.00068 * | 0.00019 * | 0.002 *** | 0.00004 | 0.0002 *** | 0.0002 *** | -2.7E-05 | -0.0001 * | -0.00003 |
| -1.08 | -2.07 | -2.5 | -4.8 | -1.94 | -4.03 | -5.52 | (-1.19) | (-2.24) | (-0.74) | |
| Non-farm income | -0.0001 * | 0.0002 | -0.0002 *** | -0.001 * | -0.0001 ** | 0.0001 * | -0.0002 *** | 1.31E-05 | 2.61E-05 | 0.0040 * |
| (-2.33) | -1.56 | (-4.32) | (-2.48) | (-2.61) | -2.33 | (-3.68) | -0.47 | -1.05 | -2.33 | |
| Farm size | 0.832 *** | 1.820 *** | 0.546 ** | 3.320 *** | 0.443 *** | 0.655 *** | 0.989 *** | 0.669 *** | 0.266 ** | 0.65 *** |
| -4.84 | -3.8 | -2.99 | -4.79 | -4.46 | -5.18 | -8.05 | -5.24 | -2.8 | -5.18 | |
| TLU | 0.651 | 0.879 | 0.891 | 0.622 | 1.582 | 0.111 ** | 0.514 | 0.712 | 1.022 | -0.13 ** |
| -0.49 | -0.69 | -0.57 | -0.41 | -1.71 | -2.81 | -0.39 | -0.41 | -1.71 | (-1.01) | |
| Environmental factors | ||||||||||
| Soil fertility | 0.00977 | -1.328 | 0.0067 | 0.598 | -0.336 | -0.338 | 0.596 | 0.0501 | 1.294 *** | -0.338 |
| -0.02 | (-1.81) | -0.048 | -0.69 | (-0.88) | (-0.85) | -1.36 | -0.12 | -3.35 | (-0.85) | |
| Farmland distance | -0.03 *** | -0.00475 | 0.053 *** | 0.0351 ** | -0.0130 ** | -0.000791 | -0.0228 *** | -0.0110 * | -0.00168 | -0.0008 |
| (-4.92) | (-0.37) | -3.43 | -2.64 | (-2.77) | (-0.16) | (-3.38) | (-2.40) | (-0.35) | (-0.16) | |
| Market access | -0.0012 | 0.00445 | -0.00269 | 0.00562 | 0.0075 *** | 0.0071 *** | 0.0093 *** | 0.0038 * | 0.0048 * | 0.006 *** |
| (-0.92) | -1.03 | (-0.89) | -1.81 | -4.24 | -3.76 | -4.22 | -2.05 | -2.5 | -3.68 | |
| Institutional factors | ||||||||||
| Credit access | 0.027 -0.04 | -0.024 1.02 | -0.504 1.42 | -0.076 (-0.08) | 0.024 -1.63 | 1.028 **-0.39 | -0.062 1.38 | 0.004 -1.13 | -0.209 (-0.64) | 1.208 *-1.48 |
| Extension services | 0.811 -1.29 | 0.48 -0.51 | -3.13 **(-3.25) | 1.024 -1.61 | 1.94 -0.01 | 1.024 -1.61 | -2.95 ***(-2.87) | 0.24 -0.36 | 0.019 -0.03 | 0.116 *-1.01 |
| Agricultural training | -0.0945 (-0.17) | -0.306 (-0.37) | -1.083 (-1.21) | -1.208 *(-2.00) | 1.901 (-0.01) | -1.208 *(-2.00) | 1.497 *-2.87 | -0.136 (-0.23) | 0.688 -1.1 | 0.042 **-1.92 |
| _cons- | 2.037 * | 6.130 *** | 0.922 | -0.691 | -1.422 | 1.425 | -5.388 *** | 0.255 | -2.357 ** | 1.425 |
| -2.28 | -3.32 | -1.23 | (-0.54) | (-1.88) | -1.76 | (-5.35) | -0.34 | (-2.90) | -1.76 | |
| N | 402 | 402 | 402 | 402 | 402 | 402 | 402 | 402 | 402 | 402 |
Like other variables, the income obtained from non-farming negatively influenced practices like livestock adjustment, and small-scale irrigation (Table 4). The data reveals that the greater the farmers' non-farm income options, the more they can afford to conserve soil, irrigate the land, engage in agroforestry, promote crop diversity, cultivate drought-resistant crops, and use less fertilizer. Therefore, with every unit income increase from non-farm sources, crop diversity increased by 0.001% (Table 4). According to previous studies, non-farm activities positively influence the adoption of technologies such as tree planting, agroforestry, using improved crop varieties, and conservation of soil and water (Jha et al., 2021; Waktola & Fekadu, 2021).
Regarding the landholdings, our findings showed that they have a positive association with all adaptation techniques. In this situation, the probability of employing all approaches increases by at least 18.6% for each unit increase in cultivated land. According to other studies, farmers in diverse agricultural regions are more likely to use strategies that enable them to adapt to climate change (Vo et al., 2021). This fact may have given farmers the assurance they needed to put adaptation strategies in place to lessen the effects of climate change. Therefore, due to the size of the farm, the possibility of a successful and meaningful adaptation to climate change has increased (Destaw & Fenta, 2021; Sorvali et al., 2021). In a similar vein, additional research has demonstrated that households with small farmland are more likely to choose conventional crop varieties because of the costs associated with new crop types (Mutanyagwa et al., 2018; Noack & Larsen, 2019).
Small-scale irrigation and fertilizer application were the practices positively impacted by livestock ownership in TLU. As a result, it addressed the fact that per unit increases in animal ownership, small-scale irrigation, and fertilizer use increased by 18.2% and 1.3%, respectively (). The relationship between farmers' decisions to adapt to the changing climate and the number of cattle has been the subject of contested studies (Belachew & Ababu, 2021; Zeleke et al., 2022). According to Amare and Simane (2017), diversifying sources of income is inversely connected with owning cattle. In contrast to what was previously stated, our findings support the findings of Saguye (2017), who found that smallholder farmers were more likely to employ sustainable farming techniques in the West Shoa Jeldu district. Because of this, it is challenging to estimate how livestock holding would affect conservation choices.
“I believe it will be difficult to continue life with the current farming system unless I devise a new mechanism to accommodate the changing environmental conditions. My parents are farmers who raised a large family. The size of the farm they shared with us is small, and on top of that, its fertility is highly declining. I have been producing with intensive farming for a few years now. However, the soil became aggregated over time and was no longer capable of producing. Developmental agents advised me to use lime to reduce its acidity and plant multipurpose trees that are used for compost and as food sources. But, I'm doing it in such a way that I won't get the expected result until the tree grows and produces compostable leaves and edible fruits.” (Participant-10)
Results also revealed that soil fertility status significantly and positively influenced tree planting and livestock adjustment, whereas it significantly and negatively influenced agroforestry and fertilizer application (Table 5). The availability of credit affects farmers' choices to invest in resource-intensive practices or purchase farm inputs, according to Moahid and Maharjan (2020). As a result, labor-intensive technology could make it unfavorable to use improved crop varieties through loan access. Credit-using farmers preferred labor-intensive strategies, which affected small-scale irrigation and fertilizer application.
Sets of factors affecting farmers’ perceptions of climate change in Gimbi district.
| Variables | Coef. (β) | Std. err. | z | P>|z |
|---|---|---|---|---|
| Gender | -0.03 | 0.04 | -0.67 | 0.505 |
| Age | 0.01 | 0.00 | 4.86 | 0.000 *** |
| Family size | -0.01 | 0.01 | -1.84 | 0.066 |
| Education | 0.21 | 0.04 | 5.35 | 0.001 ** |
| Farm income | 0.01 | 0.00 | 0.63 | 0.532 |
| Non-farm income | 0.01 | 0.00 | 0.1 | 0.919 |
| Farmland size | -0.01 | 0.02 | -0.84 | 0.398 |
| TLU | 0.01 | 0.00 | 1.9 | 0.057 |
| Soil fertility status | -0.09 | 0.02 | -5.23 | 0.000 *** |
| Farmland distance | 0.00 | 0.00 | -0.1 | 0.920 |
| Market access | 0.00 | 0.00 | -2.1 | 0.035 * |
| Credit access | 0.06 | 0.04 | 1.44 | 0.151 |
| Extension services | -0.11 | 0.07 | -1.72 | 0.086 |
| Agricultural training | 0.24 | 0.06 | 3.85 | 0.001 *** |
“There are some things that I never considered before: I have ample land resources, which include crop land, grazing land, and forestland. I was considering having large amounts of farmland as the only resource to enrich my life. Now that I have heard what farmers with small plots of land produce, I knew it is far superior to what I produce each year. My land's resources, such as its forest cover, are dwindling, its soil fertility is declining, and the crop types I grow are shifting. What I realized is that I didn't pay attention to the advice of developmental agents and ignored other sources of information.” (Participant-11)
For market availability, the study has shown a positive association with the application of small-scale irrigation, drought-resistant crops, and crop variety. Contradicting this, it had negatively affected the adoption of tree planting and fertilizer application. Smallholder farmers must choose an adaptation depending on those methods' alleged advantages. A finding by Fisher et al. (2015) demonstrated that a farmer's preferred techniques were altering planting dates and switching to crop varieties less susceptible to climate stress, supported by market access. According to Mango et al. (2018), the implementation of sustainable intensive farming considerably lessens the negative effects associated with climatic unpredictability and change.
Additionally, different factors have affected farmers' decisions to adjust to the changing climate to manage soil and water, crops, and intensive farms (Table 4). For instance, the impact of predictor variables' adoption of agroforestry, tree planting, and soil and water conservation varied. Other variables had no noticeable effect on the adoption method. Education and farm family size were the only predictors that had a substantial positive impact on soil and water conservation. Gender, farm income, farmland size, market access, and farm distance were all positive predictors of agroforestry adoption strategy. Non-farm income, soil fertility, and extension services were all negative predictors (Table 4). These findings also suggest that farmers' adaptation strategies are dependent on their localities (Atube et al., 2021; Sorvali et al., 2021).
out as they
Conclusion
This study's primary goals were to assess how farmers perceived and responded to climate change and to discover what influences smallholder farmers' adoption of adaptive measures. According to this finding, few farmers reported no change in any climatic indicator over the decade preceding the study. However, most farmers conveyed that there had been a change over time before the study period. Most notably, according to the farmers, there were temperature rises, decreasing rainfall totals, and shorter agricultural seasons. Farmers face several climate change-related issues, including lower agricultural production, a loss of natural forest cover, a decline in soil fertility, and soil erosion increment. In response to climate change, smallholder farmers have developed various adaptation techniques.
The research investigated three adaptation strategies: soil and water, crop, and intensive farm management. However, the farmers have used various adaptation strategies in response to climate change, and different factors have affected their perceptions and responses to the change. Accordingly, socioeconomic and environmental factors, such as the age of household heads, education, market access, and level of agricultural training, affected the farmers' perceptions toward the changing climate. Similarly, farmer’s perceptions and the existing socioeconomic and environmental factors, in turn, affected the choice of strategies compatible with climate change. Based on this finding, crop management strategies were more significantly associated with farmers' perceptions of climate change than the management of soil and water, as well as intensive farm practices.
This study revealed that different socioeconomic and environmental factors limit the choice of particular adaptation techniques. For instance, farmers' agricultural training determined how they perceived climate change and responded to it. We concluded that the adoption of coping strategies to adapt to a changing climate is specific to an environment, as it limits the role of adaptation measures across different localities. Therefore, authorities should focus on farmers' capacity enhancement priorities to adjust to climate change. Furthermore, when advocating for the deployment of climate change adaptations, it is critical to consider local environmental characteristics such as market accessibility and soil fertility for the viability of adaptation measures in a certain area.
Publisher’s note
This article was originally published on the Emerald Open Research platform hosted by F1000, under the “Sustainable Food Systems” for All gateway.
The original DOI of the article was 10.35241/emeraldopenres.14904.1
Author roles
Chemeda BA: Conceptualization, Data Curation, Formal Analysis, Investigation, Methodology, Resources, Software, Validation, Visualization, Writing - Original Draft Preparation, Writing - Review & Editing; Wakjira FS: Conceptualization, Methodology, Supervision, Writing - Review & Editing; Birhane E: Conceptualization, Methodology, Supervision, Writing - Review & Editing
Grant information:
This work was supported by Addis Ababa University (College of Development Studies, Center for Environment and Development) and the CLIFF-GRADS.
The funders had no role in study design, data collection and analysis, decision to publish, or preparation of the manuscript.
Competing interests
No competing interests were disclosed.
figshare: Determinants on perception of climate change and adaptation strategies of coffee-based agroforestry farmers in western Ethiopia. https://doi.org/10.6084/m9.figshare.21671672.v3 (Chemeda, 2022)
This project contains the following underlying data:
- File 2 Agricultural research.sav (quantitative survey data)
figshare: Determinants of perception of climate change and adaptation strategies of coffee-based agroforestry farmers in western Ethiopia. https://doi.org/10.6084/m9.figshare.21671672.v3 (Chemeda, 2022)
This project contains the following extended data:
- File 1 Questionnaire Word.docx (blank questionnaire)
- File 3 Focus Group Discussion Report (supplementary information on the focus groups)
- File 4 COREQ checklist.docx (completed COREQ checklist)
- Guide to focus group discussions.docx (focus group topic guide)
Data are available under the terms of the Creative Commons Attribution 4.0 International license (CC-BY 4.0).
Author contribution statement
Beshea Abdissa Chemeda conceived and designed the research survey, performed data collection, analyzed and interpreted the data, contributed materials and analysis tools, and wrote the paper.
Feyera Senbeta Wakjira conceived and designed the research survey and supervised and edited the manuscript.
Emiru Birhane conceived and designed the research survey and supervised and edited the manuscript.
The authors are grateful to the Center for Environment and Development at Addis Ababa University for providing research funds to PhD students under the Ministry of Education of Ethiopia. We also thank the CLIFF-GRADS for supporting “Improving productivity and adaptive capacity of Coffee-based agroforestry systems for enhancing food security in a changing climate in Ethiopia”. Our sincere thanks also go to all the workers of the Agriculture and Natural Resources, EPAEFCCA, OFWE, and Coffee and Tea offices of Gimbi Zonal and District for their participation in data collection during the survey and interview.
References
Reviewer response for version 1
Hanifah Ihsaniyati, Universitas Sebelas Maret, Surakarta, Indonesia
Competing interests: No competing interests were disclosed.
This review was published on 5 September 2023.
This is an open access peer review report distributed under the terms of the Creative Commons Attribution Licence, which permits unrestricted use, distribution, and reproduction in any medium, provided the original work is properly cited.
Recommendation: approve-with-reservations
Abstract and Introduction
The research topic is interesting, however, but there is no synchronization of the research objectives between those stated in the abstract, introduction, and in the results and discussion. This can potentially make the explanation unclear and thus confuse the readers. In the abstract, this article has stated that the research objective is to examine the factors that limit farmers' perceptions of climate change and the coping mechanisms at the research location. Likewise, in the results and discussion as well as conclusions, this article has presented the perceptions and determinants of farmers' perceptions of climate change. On the other hand, at the end of the introduction, this article centers on farmers' understanding and investigation of the determinants of coping strategy adoption for climate change, without investigating the determinants of perception.
The significance of adaptation strategies to climate change and the determinants of these adaptation strategies have been depicted in the introduction. However, the importance of climate change perceptions and their determinants have not been adequately described. For example (1) What is the significance of disclosing information about farmers' perceptions of climate change? (2) What is the impact of identifying these perceptions? (3) What are the benefits/impacts that we can get if we identify information on farmers' perceptions of climate change?
In the final part of the introduction, this article has specified that most of the findings on climate change conducted in the research location (country) mainly focus on food production and soil fertility management. However, this article is limited in specifying the farmers’ perceptions and adaptation strategies to climate change. To provide references for readers, the authors are required to add several research articles related to the countries of the research locations, as stated in the statement.
Method
Some of the details of methods and analysis are sufficiently provided.
This article has mentioned that the District of Gimbi was selected among 20 districts in West Ethiopia, but it has not detailed the arguments for the selection of the District of Gimbi. The researchers’ consideration can be a reference for readers to carry out similar research.
In addition to conducting 402 interviews, this study carried out 6 FGDs with 72 participants. Who the FGD participants were and how they were selected have not been explained in the article. This information is important because it can serve as a reference for the readers to replicate proper methods in their future research.
Conclusion
A statement of the practical implications of the results of this study has been specified in the article. To provide an overview of further research, this article needs to state the theoretical implications that might exist from the results of this study.
- Is the argument information presented in such a way that it can be understood by a non-academic audience?
Yes
- Could any solutions being offered be effectively implemented in practice?
Yes
- Is the work clearly and accurately presented and does it cite the current literature?
Partly
- If applicable, is the statistical analysis and its interpretation appropriate?
Yes
- Is real-world evidence provided to support any conclusions made?
Yes
- Are all the source data underlying the results available to ensure full reproducibility?
Yes
- Is the study design appropriate and is the work technically sound?
Yes
- Are the conclusions drawn adequately supported by the results?
Yes
- Does the piece present solutions to actual real world challenges?
Yes
- Are sufficient details of methods and analysis provided to allow replication by others?
Partly
development communication, extension, social media for knowledge sharing, coffee
I confirm that I have read this submission and believe that I have an appropriate level of expertise to confirm that it is of an acceptable scientific standard, however I have significant reservations, as outlined above.
Reviewer response for version 1
Fitriani Fitriani, Politeknik Negeri Lampung, Polinela, Indonesia
Competing interests: No competing interests were disclosed.
This review was published on 17 July 2023.
This is an open access peer review report distributed under the terms of the Creative Commons Attribution Licence, which permits unrestricted use, distribution, and reproduction in any medium, provided the original work is properly cited.
Recommendation: approve-with-reservations
In the background section, adequate information needs to be added regarding the basis of coffee agroforestry practices as part of the choice of climate change mitigation strategy. Previous research citations are required. Add how the relationship between the variables considered as a determinant of mitigation actions and adaptation strategies at the farm level as a justification for research questions.
The classification of the observed variables into environmental and socio-economic factors is not explained in the method of analysis section yet.
The determinant variable needs to be written in detail in the description in the binary logistic model formula used. The determinant estimation model must be clear, whether to separate the mitigation model from the adaptation strategy; or indeed become a unified model.
In the discussion section on selecting the views of the participants presented, it is necessary to provide justification for why they were chosen among all the FGD participants.
In the concluding section, the focus is on the answers to the research objectives. Just focus on the results of exploring the determinants of mitigation and adaptation strategies in dealing with climate change from the discussion. Avoid concluding on a broad spectrum of socio-economic factors, because the conclusions have focused on the determinants of mitigation and adaptation strategies.
- Is the argument information presented in such a way that it can be understood by a non-academic audience?
Yes
- Could any solutions being offered be effectively implemented in practice?
Yes
- Is the work clearly and accurately presented and does it cite the current literature?
Yes
- If applicable, is the statistical analysis and its interpretation appropriate?
Yes
- Is real-world evidence provided to support any conclusions made?
Yes
- Are all the source data underlying the results available to ensure full reproducibility?
Yes
- Is the study design appropriate and is the work technically sound?
Yes
- Are the conclusions drawn adequately supported by the results?
Partly
- Does the piece present solutions to actual real world challenges?
Yes
- Are sufficient details of methods and analysis provided to allow replication by others?
Partly
Agricultural economics; natural resource economics; agribusiness
I confirm that I have read this submission and believe that I have an appropriate level of expertise to confirm that it is of an acceptable scientific standard, however I have significant reservations, as outlined above.
