


This paper aims to examine the moderated mediation effect of the lack of students’ socialization (as one of the COVID-19 consequences) and the university reputation on the relationship between the service innovation and students satisfaction. The relationship between students satisfaction and their loyalty is also examined.
This study adopts a quantitative research approach, whereas the study population consists of all universities’ students in Lebanon. Data were collected from 201 students, elected depending on snowballing sample technique. A questionnaire was used to gather data, whereby partial least squares structural equation modeling was used to check the proposed scales validity and the relationships between the study variables.
The findings reveal a significant direct effect for university’s service innovation on students satisfaction and an indirect effect through the mediation role for university reputation. Moreover, an evidence for weak negative significant effect for lack of socialization on students satisfaction exists. Whereby, lack of socialization does not moderate the relationship between university service innovation and students satisfaction. Finally, students satisfaction has a significant positive effect on their loyalty.
This paper advances the service innovation literature in the higher education sector. In addition, the paper might be the first paper to address the influence of lack of socialization as one of the COVID-19 consequences on students satisfaction. Furthermore, areas for future research are suggested.
1. Introduction
Innovation is concerned with offering novel things, such as new techniques, practices or methods, also it can refer to developing new goods or services (Mckeown, 2008). Thus, innovation is concerned with developing a new products or implementing a new process, which enhance firm’s financial performance (Easa, 2012). Knowing that the primary goal for innovation is to allow firms to acquire sustainable competitive advantage and enhance customer satisfaction (Leonard-Barton, 1992; Easa and Orra, 2020). Nowadays innovation gains its significant importance for both academics and practitioners, due to the substantial raise in global competition level, and customers continuous search for maximizing values out of their purchasing decisions (Michel et al., 2008; Vargo and Lusch, 2004).
This paper devoted its concern to service innovation, knowing that services industry gains its substantial importance, whereas the economic production structure is continually developing (Loungani et al., 2017). Thus, to be researchers devoted a high consideration for Innovation within the service sector as globally rapid growing sector (Al-Ahmad Chaar and Easa, 2020; Hertog et al., 2010). Universities usually adopt innovation to allow their students to face rapidly changing society (Zhu and Engels, 2013). Innovation in higher education institution witnesses a great interest during the last decade, which was revealed through developing networks for international cooperation between global universities, new student’s evaluation methods, acquiring accreditation, diversification of universities programs and courses and finally depending on new technologies in students learning and teaching (Zhu and Engels, 2013).
Globalization imposed additional challenges for higher education’s institutions, in which the competition level increased due to globally free market economy (Rust and Kim, 2012). In the same vein, Tam (2007) stated that high level of competition confronting global educational institutions. Mintzberg and Rose (2003) related the increasing level of competition between the educational institutions to the emergence of virtual universities and international universities in the global market. As a response to contagious increasing in competition intensity firm’s tries to build a competitive advantage to guard its market share through focusing on firm’s innovation (Darroch and McNaughton, 2002). Also, Aziz and Samad (2016) illustrated that firms create innovation strategy to build its competitive advantage, through producing unique products better than its competitors and/or offering outstanding, fast and not expensive services. Relatedly, Sulistyo and Siyamtinah (2016) explained that firm’s innovation capability promotes its competitive advantage, through enhancing its overall performance. Moreover, firms could enhance their customer’s satisfaction and loyalty by offering innovative goods or services (Naveed et al., 2012).
Ratten et al. (2017) illustrated that universities participate in backing up economies and boosting societal well-being. People’s interactions and connections within their community are related to their quality of life, whereas universities have a significant role in facilitating the sense of community (Ratten, 2020). COVID-19 pandemic generated a global limitation on people movement, knowing that lockdown strategies applied by many countries significantly affect their citizens’ mobility. In the same vein, universities were obliged to close their campuses, and to focus more on distance learning, which leaded to physical interaction reduction, thus influencing campus applied socialization strategies. Nowadays, universities are facing a real challenge in imposing socialization strategies through distancing learning, thus, recruiting innovation to reproduce socialization behavior in online learning (Ratten, 2020).
The Lebanese higher education environment was affected by the global competition challenge. The development of new private universities and many Lebanese colleges changing their status to full universities leads to higher completion levels between private universities. Also, Lebanese universities faced lockdown strategies applied as consequences for the COVID-19 pandemic, which created additional challenges related to applying socialization strategies through distance learning. Knowing that private institutions dominate the Lebanese high education sector, in which 48 institutions exist, divided into 36 universities and 12 colleges (SPHERE, 2017). Moreover, the plurality of Lebanese universities that apply the American credit system, are suffering from student’s disloyalty, thus trying to offer a wide variety of academic majors, and to demonstrate market-oriented policies to overcome this problem (Abouchedid and Nasser, 2002).
This paper aims to investigate the effect of service innovation on student’s satisfaction and loyalty in Lebanese higher education institutions, in addition to illustrate service innovation indirect effect through the university reputation on students’ satisfaction. Furthermore, this paper examines the direct effect for the lack of socialization on students’ satisfaction, and its’ moderating effect on the relationship between service innovation and satisfaction. Thus, this article answers the following questions:
Do private Lebanese higher education institutions innovation affect students satisfaction and loyalty?
Does university reputation exert an indirect effect on the relation between Lebanese higher education institutions innovation and students satisfaction?
Does students’ socialization moderated the relationship between university’s innovation and students’ satisfaction?
This study contributes in expanding service innovation literature, knowing that empirical research studies investigating the direct influence of innovation in the service sector on customer satisfaction and loyalty, along with its indirect effect through firms reputations are rare (Ganesan and Sridhar, 2016). Nowadays decrease in students’ socialization is considered as one of the COVID-19 pandemic consequences (Ratten, 2020). Whereby, this paper contributes in studying the influence of students’ lack of socialization on their satisfaction. In the coming sections, this paper presents a theoretical background for the study variables.
2. Theoretical background
Service innovation introduces novel service or/and product to modify the process used in delivering the current service product, which aims for enhancing firm’s financial or non-financial performance (Avlonitis et al., 2001; Damanpour et al., 2009). In the same vein, service innovation main concern is to develop new service, or adjust the recent service idea, to target customers demanding new service product offering (Menor et al., 2002).
Recently, studying the influence of innovation on customers satisfaction and loyalty is acquiring a significant researching importance (Pappu and Quester, 2016), whereas many researchers agreed on the following:
signaling theory; and
expectation disconfirmation theory can be considered as the main recent approaches to investigate the relationship between innovation and customers’ satisfaction (Henard and Dacin, 2010; Giese and Cote, 2000; Pappu and Quester, 2016).
Signaling theory demonstrates that customers are not able to access all the information that enables them to have the right decision concerning the quality and value for novel introduced product/service, hence firms offer customers with information in a form of signals, such as warranty, advertising, brand name, which allow them to specify their level of satisfaction/dissatisfaction. In the same, vein, researchers agreed that innovativeness is considered as the main signal, which passes from organization to customers (Stiglitz, 2000).
Expectation disconfirmation theory illustrates the way customers can feel satisfied concerning novel product/service offerings. This theory mainly relies on the cognitive dissonance theory assumption, which states that person dissonance between reality and cognition affects his future cognition and behavior (Bhattacherjee and Premkumar, 2004). Thus, this theory can be used to measure customers’ satisfaction based on comparison between their expectation and their actual experience related to certain product/service (Oliver, 1980; Patterson et al., 1996). In other words, customers form expectations before actually buying or using a certain product/service, whereby, these expectations will be compared by the actual perceived performance formed after consuming product/service. Moreover, three probable outcomes can be revealed satisfied, neutral and dissatisfied (Mahmoud et al., 2018).
General classification for service innovation involves:
radical innovation that includes the main innovation such as offering new service and/or starting new business; and
incremental innovation that encompasses improving current service, and changing service style (Johnson et al., 2000).
Relatedly, service innovation can be classified into:
product innovation; and
process innovation (Eisingerich et al., 2009; Jiménez-Zarco et al., 2011; Miles, 2012; Santamaria et al., 2012).
Although another classification for service innovation exists (such as marketing innovation, organization innovation and strategic innovation), the majority of service innovation activities can be classified as either product or process innovation (Miles, 2012; Santamaria et al., 2012), thus researchers can avoid other classifications which may lead to confusion (Lin et al., 2008). Hence, this study adopts product and process classification for firms’ service innovation.
Many researchers agreed that innovation can be considered as one of the determinants for corporate reputation (Caruana, 1997; Helm and Klode, 2011; Hillenbrand and Money, 2007; Easa and Bazzi, 2020), which may lead to financial and non-financial performance, such as customers’ satisfaction (Ganesan and Sridhar, 2016; Preacher et al., 2007) and customers’ loyalty (Srivastava and Rai, 2014; Walsh et al., 2009). Thus, this paper adopts the previous theoretical argument that considers innovation as a main determinant for corporate reputation (Caruana, 1997).
The link between customers satisfaction and their loyalty is considered as one of the marketing theory most important relationships, as customers loyalty influences organizations’ value and financial performance (Wong et al., 2014). Moreover, customers’ satisfaction is an outcome for comparison between customers’ expectation and actual performance, concerning a certain brand (Patterson et al., 1996). Furthermore, satisfaction is also considered as a main antecedent for customers’ loyalty (Popp and Woratschek, 2017). Relatedly, Cant and Du Toit (2012) illustrated that customers’ satisfaction is a main determinant for their loyalty. This paper adopts (Gerpott et al., 2001) theoretical arguments, thus suggesting customers’ satisfaction as a direct factor that determines customers loyalty.
3. Literature review and hypotheses development
This section presents the literature review of the empirical and theoretical studies that investigated the relationships between service innovation, customers performance namely customers’ satisfaction and loyalty, corporate reputation and customers’ socialization. Based on reviewing constructs relationships, the research hypotheses and framework have been developed.
3.1 Service innovation and customers’ satisfaction
Innovation can be defined as processing changing creative ideas into product, that customers are willing to buy, thus enhancing firms’ financial performance (Naveed et al., 2012). In other word, innovative products must satisfy customers’ needs (Nemati et al., 2010). Firms’ must perform continuous innovation to satisfy customers’ changing needs and enhance their level of satisfaction (Nemati et al., 2010). Efficient and effective service innovation adds value for customers, whereas it is considered as a competitive advantage for firms, allowing firms to retain its customers through raising their satisfaction level (Boxer and Rekettye, 2011). Relatedly, firms with greater innovation potential can reach higher level of customers’ satisfaction (Verma and Mercado, 2013). Also, Owano et al. (2014) illustrated that first mover innovative firms can reach higher level of customers’ satisfaction along with higher profit. In the same vein, many studies revealed a significant positive relationship between service innovation and customers’ satisfaction (Diaw and Asare, 2018; Kanwal and Yousaf, 2019; Naveed et al., 2012; Weng et al., 2012). Based on reviewing the previous literature the following hypothesis is developed as follows:
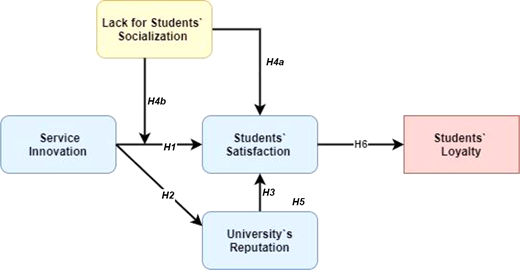
Service innovation in Universities positively influences students satisfaction.
3.2 Service innovation and corporate reputation
Many researchers agreed that service innovation is an antecedent for corporate reputation (such as Cravens et al., 2003; Fombrun, 2007; Helm and Klode, 2011; Hillenbrand and Money, 2007). In the same vein, customers’ adoption for corporate new innovative products is influenced by corporate reputation (Corkindale and Belder, 2009). Also, Manohar and Palanisamy (2018) illustrated that usually innovative organizations possess good reputation. In the contrary, Courtright and Smudde (2009) and Henard and Dacin (2010) demonstrated that reputable firms try to preserve their competitive advantage through adopting continuous innovative activities, thus corporate reputation is considered as an independent variable influencing its innovation. Knowing that the majority of the literature state that corporate innovation is a main predictor for corporate reputation (Cravens et al., 2003; Fombrun, 2007; Helm and Klode, 2011; Manohar, 2018). This study considers service innovation as an independent variable in the relationship with corporate reputation. In other words, this paper considers service innovation as an antecedent for corporate reputation. Hence, the current study second hypothesis is derived as follows:
Service innovation in Universities positively influences universities’ reputation.
3.3 Corporate reputation and customers’ satisfaction
Corporate reputation can be defined as the results for all firm’s past actions history (Yoon et al., 1993). Also, it can be defined from customers’ perspective as the level of customers’ perception for a certain organization (good or bad, trusty, reliable and so on) based on their past experience with this organization (Levitt, 1965). Although researchers agreed about the relationship between corporate reputation and customers’ satisfaction, their views vary related to the causality of this relationship. Fisher (1996) illustrated that it is not easy to understand the relationship path between corporate reputation and customers satisfaction, but finding one of these constructs requires searching for the second. In other words, there is a significant association between customers’ satisfaction and corporate reputation. Relatedly, Davies and Chun (2002) illustrated the existence of the positive association between corporate reputation and customers’ satisfaction.
Many researchers adopted corporate reputation as an antecedent for customers satisfaction (such as Hadi and Indradewa, 2019; Helm, 2007; Su et al., 2016; Walsh et al., 2006). Relatedly, corporate satisfaction can be derived from corporate reputation in service production process (Nguyen and Leblanc, 2001). On the contrary, other studies demonstrated that corporate reputation is an outcome for customers’ satisfaction (Barajas-Portas et al., 2017; Walsh et al., 2009). On this basis, we consider corporate reputation as an antecedent for customers’ satisfaction, hence the third hypothesis is developed as follows:
Universities reputation positively influences their students satisfaction.
3.4 Lack of students’ socialization and satisfaction
Many studies illustrated the existence for social dimension in service economy and literature (Djellal and Gallouj, 2012; Gershuny and Miles, 1983; Harrison, 2010). Social dimension importance is increasing with passing time. Thus recently services are becoming more social (Gallouj et al., 2018), with the increase in service users’ participation in service innovation process (Chesbrough, 2011). Furthermore, the recent COVID-19 pandemic is playing a catalyst role in product/service innovative changes. Knowing that the whole world is adopting social distance strategy. In addition to applying lockdown strategies by many countries to prevent COVID-19 from spreading. Thus innovating firms’ must concentrate on new methods to adopt affordance-effective fit and to develop novel product/service through restructuring innovation challenge (Mention et al., 2020).
Many researchers suggest that frequent student–faculty and peer interactions are two primary influences on student learning and development (Astin, 1993; Cruce et al., 2006; Easa, 2019; Furman and Gavin, 1989; Kuh and Hu, 2001; Pascarella and Terenzini, 2005). Kuh and Hu’s (2001) extensive analysis of student–faculty interactions found that interactions substantially increased student satisfaction with college experience. In the same context, Kotzé and du Plessis (2003) proposed that institutional socialization with students is positively related to overall satisfaction with the teaching services provided. In addition to examining the direct relationship between lack of students’ socialization and students satisfaction, this paper also adopted the researchers preview which considers COVID-19 as a catalyst for innovation and change. Whereby, the lack of socialization is considered as one of the COVID-19 main consequences, which is considered as a main challenge facing firms’, especially higher education services (Mention et al., 2020). Hence the following two hypotheses are developed:
Lack of students’ socialization negatively influences level of satisfaction.
Lack of students’ socialization moderates the relationship between service innovation and students’ satisfaction.
3.5 Mediating role of corporate reputation
Few research addresses the mediation role for corporate reputation on the relationship between service innovation and customers satisfaction (Ganesan and Sridhar, 2016; Kanwal and Yousaf, 2019). To analyze the mediation effect of university reputation (mediator), the authors follows the following criteria: first, illustrate the existence of significant direct path between the predictor (service innovation) and the criterion variable (students’ satisfaction). Whereby, previously discussed literature revealed a significant relationship between service innovation and students satisfaction (Diaw and Asare, 2018; Kanwal and Yousaf, 2019; Naveed et al., 2012; Weng et al., 2012). Second, the authors demonstrate the indirect path between the predictor and criterion variables, through elaborating the significance for the following two relationships:
between the predictor (service innovation) and the mediator (university reputation); and
between the mediator and the criterion (students’ satisfaction).
Whereby, previous literature revealed a significant relationship between service innovation and university reputation (such as Fombrun, 2007; Helm and Klode, 2011; Hillenbrand and Money, 2007; Manohar, 2018) and between university reputation and students’ satisfaction (such as Hadi and Indradewa, 2019; Helm, 2007; Su et al., 2016; Walsh et al., 2006). Furthermore, Ganesan and Sridhar (2016) and Kanwal and Yousaf (2019) findings agreed about the mediation role for corporate reputation on the relationship between service innovation and customers satisfaction. Based on reviewing and analyzing the previous literature, this paper developed the fourth hypothesis as follows:
Universities’ reputation mediates the relationship between service innovation and students’ satisfaction.
3.6 Customers’ satisfaction and loyalty
Researchers agreed that customers’ satisfaction is a main determinant for their loyalty (Alves and Raposo, 2010; Hidayat et al., 2016). In the same vein, customers’ loyalty is considered as an initial consequence for their satisfaction (Helgesen and Nesset, 2011). Also, literature review revealed a positive significant relationship between customers’ satisfaction and their loyalty (Athiyaman, 1997; El-Adly and Eid, 2016). Moreover, the increased competition between higher education institutions, encouraged many researchers to emphasize on studying students’ loyalty (Carvalho and de Oliveira Mota, 2010; Peralt-Rillo and Ribes-Giner, 2013). In which a significant positive relationship exists between students’ satisfaction and their loyalty. Based on reviewing the previous literature, this paper developed the fifth hypothesis as follows:
Universities students’ satisfaction positively influences their overall loyalty level.
Based on the previous literature review, a study framework is developed, which demonstrates the relationship between the study variables, as presented in Figure 1.
4. Research methodology
This study adopts a quantitative research approach, through asking narrow questions to collect quantifiable data from Lebanese universities students, used for further analysis, depending on suitable statistical methods (Creswell, 2008).
4.1 Population and sample
There are 38 Lebanese higher education institutions, providing their services for 180,850 students (Yaacoub and Badre, 2012). The current study population consists of all Lebanese universities students, whereas the study sample includes 201 students, elected depending on snowballing sample technique. Knowing that based on “10 times rule” the sample size is considered sufficient to analyze the study data using smart PLS-SEM. Whereby, lack of socialization has the highest number of indicators (12 indicators) and it has 2 pointing arrow, hence the minimum sample size is equal to 140 students {(12 + 2) × 10 = 140} (Hair et al., 2014). The current study sample is made of 77 males, which represents 38.3%, moreover, females consists 71.7% of the sample counting 124 respondents. The majority of the respondents is between 21 and 23 years of age (44.8%). Furthermore, 64.2% of the respondents are Bachelor's Degree Students, whereas post graduate students represent 35.8% of the study sample.
4.2 Measures of research variables
Service innovation is measured by eight measurement items, through product innovation (five items; such as, my university introduced changes performed in the classic services presented in the sector to students) and process innovation (three items; such as, my university business practices are continuously optimized for better service delivery) (Nasution and Mavondo, 2008). Although students satisfaction is measured by six measurement items (such as I am satisfied with quality of academic services) (Annamdevula and Bellamkonda, 2016). Furthermore, universities’ reputation is measured by four measurement items (such as, my university has good reputation) adopted from Petrick (2002) and Sweeney and Soutar (2001) studies. Moreover, students’ loyalty is measured by four measurement items (such as I will refer this university to my friends/family) (Annamdevula and Bellamkonda, 2016). Finally, lack of socialization is measured by twelve measurement items (such as due to COVID-19 pandemic, students did not participate in any study group(s) outside of class) through adjusting socialization measure adopted by Padgett et al. (2010) study. All measurements are based on a five-point Likert scale ranging from 1 = strongly disagree to 5= strongly agree.
5. Data analysis
The data analysis for this study is categorized into three categories: descriptive statistics through which the characteristics of the study data set is illustrated, measurement model evaluation that links the latent variables to their indicators and, finally, structural model evaluation to examine the relationship between this paper latent variables.
5.1 Descriptive statistics
This paper calculated the means and standard deviation for the study variables, in which university reputation has the highest mean (4.24), along with standard deviation equal to 0.692, whereas lack of students’ socialization has the lowest mean (3.225), with standard deviation equal to 0.721. Moreover, this paper conducts skewness normality tests to examine whether the study data set is modeled for normal distribution. Whereby:
Skewness assesses the extent to which a variable’s distribution is symmetrical. If the distribution of responses for a variable stretches toward the right or left tail of the distribution, then the distribution is referred to as skewed (Hair et al., 2017, p. 61).
A general guideline for skewness states that when its numerical value exceeds +1 or lower than –1, this is an indication of a substantially skewed distribution (Hair et al., 2017). Table 1 presents a summary for the study variables mean, standard deviation and Skewness test. In which, all the study data are normally distributed, as all the variables Skewness values are within the accepted threshold.
Variables means, standard deviation and skewness test
| Mean | Std. deviation | Skewness | ||
|---|---|---|---|---|
| Statistic | Std. error | |||
| Service innovation | 3.79 | 0.692 | −0.602 | 0.172 |
| University reputation | 4.24 | 0.585 | −0.248 | 0.172 |
| Students satisfaction | 3.76 | 0.772 | −0.803 | 0.172 |
| Students loyalty | 4.08 | 0.733 | −0.978 | 0.172 |
| Lack of socialization | 3.225 | 0.7216419 | −0.390 | 0.172 |
5.2 Evaluation of the measurement model
This study checked the content validity to ensure that the measurement items used clearly reflect the measured variables, thus checking the procedures used to establish the measurement items (Straub, 1989). Moreover, this study satisfies construct validly, whereby all its measurement items were based on well-known research studies (Kerlinger, 1964). Moreover, partial least square structure equation modeling is adopted, depending on Smart PLS-3 software, which enable hypothesis testing concerning existed theories and concepts (confirmatory research), in addition to using it for developing new theory (expiratory research) (Sarstedt et al., 2014). Moreover, to use Smart PLS-3 software this paper classified student satisfaction as formative variable, whereas the rest variables are reflective variables.
5.2.1 Reflective measurement model evaluation.
This paper tests the internal consistency (Cronbach α and composite reliability), convergent validity (outer loading of the measurement items, and average extracted variable) and discriminant validity (Fornell and Larker criteria, cross-loading and Heterotrait–Monotrait correlation), to fulfill precise evaluation for the measurement model reflective variables.
5.2.1.1 Internal consistency (reliability).
The level to which all the measurement items accurately measure the same construct, is known as internal consistency (Revelle, 1979). Whereas, this paper relies on Cronbach α and composite reliability to assess internal consistency. First, the values for Cronbach α for the reflective variables are as follow: service innovation (0.902), university reputation (0.867), lack of socialization (0.864) and students loyalty (0.867). All the Cronbach α values are higher than 0.7, thus revealing an adequate internal consistency (Nunnally, 1978). Second, this paper also examines the reliability for a group of measurement items through testing the composite reliability. Moreover, Peterson and Kim (2013) recommended the use for composite reliability in structural equation modeling. In which the composite reliability for the current study reflective variables are as follows: Service innovation (0.921), university reputation (0.909), lack of socialization (0.886) and students’ loyalty (0.910). Hence, the composite reliability is satisfied, as all the values are higher than 0.7, knowing that the minimum accepted composite reliability value is 0.7 (Hair et al., 2014).
5.2.1.2 Convergent and discriminant validly.
Convergent validity indicates that a certain construct’s items measures are positively associated with each other’s (Campbell and Fiske, 1959). Thus, this study performs a factor analysis in which it determines the outer loading of the measurement items, in addition to calculating the average variance extracted (AVE). The outer loading for the service innovation of higher education institutes items ranges between 0.601 and 0.841, with AVE = 0.596. The outer loading for university reputation items ranges between 0.796 and 0.884, with AVE = 0.715. The outer loading for the lack of socialization items ranges between 0.372 and 0.880, with AVE= 0.407. Students’ loyalty outer loading items ranges between 0.773and 0.880, with AVE = 0.716. Knowing that Hair et al. (2014) illustrated that measurement item with factor loading value > 0.7, must be retained. Moreover, any item with factor loading greater than 0.4, can also be retained if its AVE is >0.5 (Fornell and Larcker, 1981). Hence all the measurement items for university reputation and student loyalty are retained, as their outer loading is higher than 0.7 (Hair et al., 2014). In addition to retaining all service innovation items measures as they are greater than 0.6 and its AVE (0.596) is higher than 0.5 (Fornell and Larcker, 1981). Furthermore, only six measurement items for lack of socialization out of twelve are retained.
We checked the discriminant validity for the reflective constructs, to examine whether each construct is strongly linked to its specified measurement items. To confirm construct discriminant validity, this study adopted Fornell and Larcker criterion, whereby the latent variable AVE square root should be greater than the correlation between the latent variable and all the other latent variables (Fornell and Larcker, 1981). Knowing that the results satisfy the previous criteria, revealing that all reflective variables square root AVE are higher than their correlation coefficient with other latent variables, showing discriminant validity as reflected in Table 2.
Latent variable correlation compared to square root of their AVE
| Service innovation | Lack of socialization | Student loyalty | University reputation | AVE | Square root AVE | |
|---|---|---|---|---|---|---|
| Service innovation | 1.000 | −0.194 | 0.681 | 0.531 | 0.596 | 0.772 |
| Lack of socialization | −0.194 | 1.000 | −0.188 | −0.155 | 0.407 | 0.637 |
| Student loyalty | 0.681 | −0.188 | 1.000 | 0.691 | 0.716 | 0.846 |
| University reputation | 0.531 | −0.155 | 0.691 | 1.000 | 0.715 | 0.845 |
Note: AVE, average variance extracted
Furthermore, the cross-loading test revealed that the loading for all the indicators on their related construct is higher than their loading on any other construct (Gefen and Straub, 2005), hence fulfilling discriminant validity based on cross-loading. Moreover, to estimate the correlation between constructs Heterotrait–monotrait ratio is determined, revealing discriminant validity, whereby all the correlation coefficients were lower than 0.9 (Henseler, 2017), as presented in Table 3.
5.2.2 Evaluation for formative measurement model.
To ensure precise evaluation of formative variable (student satisfaction) measurement model, the collinearity among the indicators are examined, in which the variance inflation factors (VIF) for all students satisfaction measurement items are <5, revealing no serious collinearity problem as presented in Table 4 (Hair et al., 2017). Furthermore, Hair et al. (2014) rule of thumb is applied through checking the level of significant for indicators outer weight, through bootstrapping repot, showing a significant p-value for all student satisfaction indicators, which is also presented in Table 4. Moreover, all the outer loading values for the formative variable measurement items are > 0.5, satisfying convergent validity (Hair et al., 2014). Hence, all students satisfaction measurement items are retained.
Outer VIF values, outer weight significance and outer loading
| VIF | t-statistics (|O/STDEV|) | p-values | Outer loading | |
|---|---|---|---|---|
| SS1 | 3.013 | 36.119 | 0.000 | 0.857 |
| SS2 | 4.101 | 56.932 | 0.000 | 0.897 |
| SS3 | 3.340 | 37.286 | 0.000 | 0.875 |
| SS4 | 3.087 | 38.750 | 0.000 | 0.870 |
| SS5 | 3.174 | 34.380 | 0.000 | 0.866 |
| SS6 | 2.944 | 37.645 | 0.000 | 0.855 |
Notes: VIF; variance inflation factor; SS; students satisfaction measurement item
5.3 Structural model evaluation
The authors assist the current study model, relying on the structural model evaluation, which encompass the following procedures:
collinearity assessment; and
path coefficients, coefficient of determination (R square), size effect (f square) and blindfolding predictive relevance (Q square).
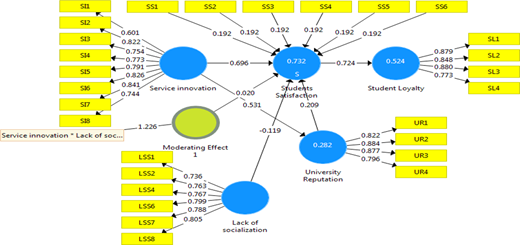
Figure 2 presents the study model which is developed based on Smart PLS-3 software.
5.3.1 Collinearity assessment.
To examine the correlation among indicators, this study calculated variance inflated factors (VIF). Whereby, any VIF value equal or greater than 5, reveals a serious collinearity problem (Hair et al., 2011). VIF values between the study indicators are presented in Table 5, in which all the VIF values are less than 5, thus no serious collinearity problem exists between the study indicators.
5.3.2 Path coefficients, coefficient of determination (ΔR2), size effect (F2) and blindfolding predictive relevance (Q square).
Path coefficient can be referred to as the coefficient linking constructs in the structural model, hence it is used to test hypotheses and the relationship strength. Whereby, any coefficient value close to +1 reveals a robust positive relationship. On the other hand, coefficient value close to −1 represents a strong negative relationship. Furthermore, any path coefficient value close to 0 is considered insignificant (Garson, 2016). Table 6 presents the path coefficients between the current study variables, along with the t-values for each path, which is compared with t-critical (2.58 at significance level 1%). Knowing that to accept any hypothesis t-values for the path should be higher than t-critical, and the p-value must be significant (Garson, 2016).
Path coefficient results, coefficient of determination (ΔR2), predictive relevance (Q2) and size effect (F2)
| Original sample (O) | Sample mean (M) | Standard deviation (STDEV) | t-statistics (|O/STDEV|) | F² | |
|---|---|---|---|---|---|
| Service innovation → students satisfaction | 0.696*** | 0.693 | 0.048 | 14.574 > 3.32 | 1.262 |
| Service innovation → university reputation | 0.531*** | 0.533 | 0.044 | 12.158 > 3.32 | 0.393 |
| Lack of students socialization → students satisfaction | −0.119** | −0.125 | 0.045 | 2.636 > 2.58 | 0.050 |
| Students satisfaction → student loyalty | 0.724*** | 0.725 | 0.037 | 19.455 > 3.32 | 1.101 |
| University reputation → students satisfaction | 0.209*** | 0.206 | 0.048 | 4.368 > 3.32 | 0.117 |
| Student loyalty | Students satisfaction | University reputation | |||
| ΔR² | 0.552 | 0.726 | 0.278 | ||
| Q² | 0.3648 | 0.513 | 0.189 | ||
Notes: ΔR² = adjusted R square; Q² = predictive relevance; F² = size effect. **p < 0.01; ***p < 0.001
5.3.2.1 Testing direct relationships of H1, H2, H3 and H4a.
Based on the path coefficient value a significant positive relationship between service innovation and students satisfaction exists, whereby service innovation exerts a large size effect on students satisfaction (path coefficient = 0.696; p < 0.001; t statistics 14.574> t-critical 3.32; F2 = 1.262 > 0.35). Hence, H1 is supported. The results also revealed a significant positive path between service innovation and university reputation, in addition to the large size effect for service innovation on university reputation. Whereby 27.8% of the change in university reputation is due to service innovation. Also, high predictive power model exists with Q2 = 0.189 > 0 (Geisser, 1974) (path coefficient = 0.531; p < 0.001; t-statistics 12.1582 > t-critical 3.32; F2 = 0.393 > 0.35; ΔR2 = 0.278). Thus, H2 is supported.
A significant positive path coefficient exists between university reputation and students satisfaction, whereby a small size effect for university reputation on students satisfaction is detected (path coefficient = 0.209; p < 0.001; t-statistics 4.368> t-critical 3.32; 0.02≤ F2 = 0.117 < 0.15). Thus, H3 is supported. Also, the results revealed a significant negative path between lack of students’ socialization and students satisfaction, along with a small size effect for lack of socialization on students satisfaction (path coefficient = 0.119; p < 0.01; t-statistics 2.636 > t-critical 2.58; 0.02< F2 = 0.050 < 0.15). Hence H4a is supported.
In general, the results revealed a substantial effect for service innovation, university reputation and lack of students’ socialization on students satisfaction, whereby 72.6% of the change in students’ satisfaction is due to the change in these independent variables (Chin, 1998). Moreover, Q2 = 0.3648 > 0 revealed a model high predictive power (Geisser, 1974).
5.3.2.2 Testing the moderating effect of lack of students’ socialization (H4b).
This study examines the moderation effect of lack of students’ socialization on the relationship between service innovation and student s’ satisfaction, using Path coefficient and confidence intervals bias corrected as presented in Table 7.
Path coefficient and confidence intervals bias corrected (moderator)
| Original sample (O) | Sample mean (M) | Standard deviation | t-values | p-values | Confidence intervals bias corrected (2.5–97.5%) | |
|---|---|---|---|---|---|---|
| Moderating effect → student satisfaction | 0.020 | 0.025 | 0.042 | 0.471 | 0.638 | (−0.058, 0.105) it includes zero, thus no moderation |
In which the t-test results revealed an insignificant moderation effect (t = 0.471, p > 0.05). Furthermore, the confidence interval bias corrected is between –0.058 and 0.105, whereby zero is included in the previous interval, showing an insignificant moderation effect for lack of students’ socialization on the relationship between service innovation and students satisfaction. Hence H4b is rejected.
5.3.2.3 Testing the mediating role of university reputation (H5).
Examining the relationship between service innovation and students satisfaction revealed a total significant effect of service innovation on students satisfaction, whereby t-test for the total effect is presented in Table 8 (t-statistics =26.328; p < 0.001). Moreover, Table 8 reveals a significant indirect effect of higher education service innovation on student satisfaction through university reputation (t-statistics =3.983; p < 0.001). Knowing that a direct significant relationship also exists between service innovation and students’ satisfaction, as H1 was previously supported. Hence university’ s reputation partially mediates the relationship between service innovation and students’ satisfaction, thus H5 is supported.
Total effect and indirect effect of service innovation on students satisfaction
| Total effect | Indirect effect | ||||
|---|---|---|---|---|---|
| Standard Deviation (STDEV) | t-statistics | p-values | Standard deviation (STDEV) | t-statistics | |
| University service innovation → students satisfaction | 0.031 | 26.328*** | 0.000 | 0.028 | 3.983*** |
Note: ***p < 0.001
5.3.2.4 Testing direct relationship of H6.
The path coefficient value revealed a significant positive relationship between students satisfaction and students loyalty, whereby students satisfaction exerts large size effect on student loyalty, (path coefficient = 0.724; p = 0.000, t-statistics 19.455> t-critical 3.32, F2 = 1.101 > 0.35). Moreover, 52.2% of the change in students’ loyalty is due to the change their satisfaction. Also Q2 = 0.364 > 0 revealed a significant model predictive power (Geisser, 1974). Hence H6 is supported.
6. Discussion
This paper examined the direct and indirect relationship between service innovation and students’ satisfaction through university reputation. Whereby, a significant positive relationship exists between service innovation and students’ satisfaction, thus supporting H1. Hence, continuous improvement in service innovation, allows universities to overcome problems facing their students in a satisfactory manner. This finding goes in line with the results of many studies (such as Diaw and Asare, 2018; Kanwal and Yousaf, 2019; Naveed et al., 2012; Weng et al., 2012). Furthermore, this study reveals a significant positive relationship between service innovation and corporate reputation in Lebanese universities, whereby H2 is supported. Thus, indicating that universities reputation is considered as one of the positive outcomes for investing in new service innovation that agrees with the findings for Manohar et al. (2019) and Sridhar and Mehta (2018). Moreover, an evidence for significant positive relationship exists between university reputation and students’ satisfaction, through supporting H3. Thus, the findings confirm with many previous studies, which adopted corporate reputation as an antecedent for customers satisfaction (such as Davies and Chun, 2002; García-Madariaga and Rodríguez-Rivera, 2017). Supporting the direct and indirect role of service innovation on students’ satisfaction, indicated that students’ perceived value concerning their universities services match their expectation. Thus appealing to the assumptions of expectation disconfirmation theory (Bhattacherjee and Premkumar, 2004).
A significant direct path exists between the predictor (service innovation) and the criterion (students satisfaction) through supporting H1. Moreover, the indirect path between previous variables exists through supporting H2 and H3. Hence, university reputation partially mediated the relationship between service innovation and students’ satisfaction, whereby H4 is supported. This finding goes in parallel with the results of Ganesan and Sridhar (2016) and Kurniawan et al. (2019). Moreover, this result contributes to service innovation literature, through supporting the mediating role of university reputation on the relationship between service innovation and students’ satisfaction (Ganesan and Sridhar, 2016; Kanwal and Yousaf, 2019). Also this paper confirms the researchers’ agreement concerning the positive relationship between customers’ satisfaction and their loyalty (Athiyaman, 1997; El-Adly and Eid, 2016). Whereby, H5 is supported. Hence, this study demonstrates the existence of indirect relationship between university service innovation and student loyalty through university reputation and student satisfaction.
Furthermore, this study addresses the influence of the lack of students’ socialization as one of COVID-19 pandemic consequences on their satisfaction level. Whereby, a significant negative relationship exists between students’ lack of socialization and their level of satisfaction. Thus supporting H6a. These findings go in parallel with the previous studies results that confirm the positive relationship between students interactions and socialization and their satisfaction level (Kotzé and du Plessis, 2003; Kuh and Hu, 2001).
Although COVID-19 pandemic may encourage innovative firms to adopt new methods for developing new product/service (Mention et al., 2020), no evidence concerning significant moderating effect of lack of student socialization on the relationship between service innovation and students’ satisfaction, whereby H6b is rejected. Rejecting the moderation effect may refer to the following reasons: First, Lebanese university adopting continues improvement to enhance the quality of higher education sector. Second, most students at university are still young (Morris and Venkatesh, 2000) and high educational level (Riddell and Song, 2017) on their adoption level toward new technology. Third, recent focusing on reconstructing Lebanese higher education system as the most important issue in Lebanese Ministry of higher education agenda (Kaissi et al., 2009).
7. Theoretical and practical implications
This study contributes to service innovation literature, through demonstrating innovativeness as an important signal for customers’ satisfaction and loyalty. Thus, confirming signaling theory assumption concerning the necessity of sending organizational signals to help customers’ in new product/service evaluation. Furthermore, this is the first paper that examines the moderating role of the lack of socialization on students satisfaction.
Our study provides also some practical implications to help universities in enhancing students’ satisfaction and loyalty. whereby, these implications are summarized as follow: first, universities managers must focus on adopting continues innovation strategies that enablethe university to enhance its customers’ satisfaction and loyalty. Second, university managers, instructors and administrators must be aware about the importance of socialization in enhancing students’ satisfaction level, thus a great concern must be given to the interaction between students themselves, and between them and their instructors and university administrators. Third, the current shift toward online study due to COVID-19 spreading, may shed some light on instructor’s significant critical role in promoting learning environment, which allow students interaction and minimize online study limitations. Fourth, universities managers must keep in mind that successful management of university reputation is considered as a key for enhancing students satisfaction and loyally. Thus managers must invest sufficient amount of resources in building and sustaining successful university’s reputation.
8. Limitations and future research
This paper has some limitations, which may affect its results generalization. First, choosing university students as a unit of analysis, hence concentrating on young respondent with high level of education. Whereby university students have higher degree of adoption of new technology. Knowing that the adoption level of new technology differs with respect to elder (Morris and Venkatesh, 2000) and customers with lower level of education (Riddell and Song, 2017). Future research applied on different service sectors is recommended, such as banking sector. Second, the current study is cross-sectional, hence future longitudinal study may better reflect the influence of university service innovation on the study variables. Whereby, the significance of the lack of socialization influence on satisfaction may change over time depending on the development for COVID-19 virus, and the availability of vaccine in the near future. Finally, this study relies on snowballing sampling method, as non-probability sampling technique, which add another limitation for the results generalization.

