


This paper examines the earnings effects of educational mismatch in the New Zealand labour market over a decade. Using longitudinal data from 2013, 2018, and 2023, it applies a fixed-effects model to analyse how overeducation and undereducation affect real hourly wages. The study finds that overeducated workers face persistent wage penalties, while undereducated workers earn premiums over the observed period. It further reveals that graduates suffer larger wage penalties from overeducation than non-graduates. By illustrating wage trajectories over a decade, the research highlights the long-term nature of these earnings disadvantages and underscores the need for policies that better align educational qualifications with occupational demands.
This study employs a fixed effects panel regression model using longitudinal data from the 2013, 2018, and 2023 New Zealand Censuses and the Administrative Population Census (APC), accessed via Stats NZ’s Integrated Data Infrastructure. The analysis utilises a balanced panel of 510,983 individuals. Educational mismatch is measured using the realised matches method, classifying workers as overeducated, undereducated, or well-matched based on occupational education benchmarks. The model controls for human capital variables, demographic factors, and occupational characteristics to estimate the impact of mismatch on real hourly log wages, while accounting for unobserved time-invariant heterogeneity. Dynamic analysis using transition matrices and trajectory classifications is conducted to examine mobility and stability across mismatch categories over the period. Occupation fixed effect, random effect with the Hausman test, experience sensitivity and Quantile regression are used as robustness checks.
The analysis reveals that overeducated workers in New Zealand experience a significant and persistent wage penalty of approximately 5%, while undereducated workers earn a wage premium of 2–4% compared to their well-matched counterparts. This earnings disadvantage is notably more severe for graduates, who face a 6.7% wage penalty for overeducation, compared to 3.2% for non-graduates. Crucially, wage trajectory analysis from 2013 to 2023 confirms that these penalties and premiums remain stable over time, indicating that educational mismatch is a long-term, rather than transitory, issue in the New Zealand labour market.
The findings have significant implications for policymakers and educators in New Zealand. They underscore the need for enhanced career guidance and robust employer-education partnerships to better align graduate skills with labour market demands. University enrolment and funding should be strategically reviewed to address skill shortages and reduce overeducation. Furthermore, promoting lifelong learning and work-integrated learning can help workers adapt their skills. For individuals, the persistent wage penalty for overeducated graduates highlights a potential risk to the return on investment in higher education, suggesting a need for careful career planning informed by labour market trends.
The study’s results call for concrete actions. Policymakers should strengthen career guidance services, using real-time labour market data to inform students about in-demand fields and potential mismatch risks. Tertiary institutions must adapt curricula and intake numbers to align with economic needs, prioritizing sectors with skill shortages. Employers can contribute by expanding internship and work-integrated learning programs to ensure a smoother school-to-work transition. For workers, the findings highlight the long-term financial risk of overeducation, emphasizing the importance of strategic upskilling and lifelong learning to maintain alignment between their qualifications and their job roles.
The persistent wage penalties for overeducation carry profound social implications. They can devalue higher education, potentially deterring investment in human capital and undermining social mobility. This mismatch may exacerbate income inequality, as graduates face reduced returns on their significant educational investments. At a societal level, widespread overeducation leads to inefficient use of skills, lowering overall productivity and hindering economic growth. Furthermore, it can fuel worker dissatisfaction and psychological distress, negatively impacting well-being. These effects collectively threaten the social contract that education leads to better life outcomes, demanding urgent policy intervention to realign educational pathways with labour market needs.
This study provides original value by being the first to analyse the earnings impact of educational mismatch in New Zealand across census waves using a decade of longitudinal data (2013–2023). Its application of a fixed effects model to a large, balanced panel offers robust evidence by controlling for unobserved individual heterogeneity. The study differentiates cross-sectional sorting from within-person wage changes connected to the mismatch level by examining within-individual differences over time. The research uniquely constructs and compares wage trajectories over time, demonstrating the persistent nature of mismatch penalties. Furthermore, it delivers novel insights by separately analysing graduates and non-graduates, revealing that the wage penalty for overeducation is significantly more severe for tertiary-educated individuals, a critical finding for national policy.
1. Introduction
Ensuring a proper match between the skills gained through education and those demanded in the labour market is essential to maximising the return on human capital investment (OECD, 2019; Reis, 2017). However, such alignment is often not realised in real-world labour markets (Lasso-Dela-Vega et al., 2023; Levels et al., 2014; Mateos-Romero and Salinas-Jiménez, 2018; McGuinness, 2006; Sun and Kim, 2021; Tang and Wang, 2021; Wu and Wang, 2018; Zheng et al., 2021). This mismatch is commonly referred to as an educational or qualification mismatch, a term used by the International Labour Organisation (ILOSTAT, 2021) to describe situations where the skills acquired through education differ from those required in the workplace.
Educational mismatch occurs in two distinct ways: horizontal mismatch (field of study) and vertical mismatch (Cortadas-Guasch, 2024). Employees confront horizontal mismatch when there is a difference between their field of education and their current occupation. Meanwhile, when there is a vertical mismatch, a discrepancy exists between the level of education and the job requirement. An employee whose level of education exceeds the job requirement is referred to as an overeducated individual, whereas one whose education level falls below the job requirement is considered an undereducated individual. This study focuses on the vertical mismatch in New Zealand.
Educational mismatch disrupts the return on investment in human capital, generating issues at multiple levels. Individually, educational mismatch leads to lower job satisfaction and reduced employee productivity. At the firm level, less satisfied and less productive employees harm production and increase labour turnover. At the macro level, lower production and high mobility decrease Gross Domestic Product (GDP).
Beyond economic implications, educational mismatch disrupts progress toward Sustainable Development Goal 8 (SDG 8), which focuses on decent work and economic growth. Educational mismatch limits individuals’ access to jobs that reflect their education level.
Three labour market theories suggest different views on the determinants of earnings. The first is the Human Capital Theory, which suggests that earnings depend on three employee characteristics: training, education and experience (Becker, 1964; Mincer, 1958; Schultz, 1961). Second, the Job competition model explains that the primary determinant of earnings is the characteristics of the occupation (Arrow, 1973; Spence, 1973). Human capital theory focuses on the supply side of the labour market, while job competition theory focuses on the demand side. However, consistent with prior research, this study supports the view that the assignment model is used to explain the wage gap and educational mismatch. According to the assignment model, occupational (demand-side) and employee characteristics (supply-side) determine earnings (Sattinger, 1993; Thurow, 1975).
Previous studies on educational mismatch have estimated its impact on employee earnings (Bauer, 2002; Duncan and Hoffman, 1981; Hartog, 2000). However, the most common finding is that overeducated employees earn less than educationally matched workers, whereas undereducated workers earn more than educationally matched workers (Hartog, 2000; Reis, 2017; Sun and Kim, 2021).
Although there is a wide range of international studies on the impact of educational mismatch on employee income, empirical support for New Zealand is limited. New Zealand is a country characterised by a complex labour market, an increasing participation rate in tertiary education, a diverse immigrant workforce, and geographical variations in employment opportunities. The next important common factor in the labour market of any economy, including New Zealand, is technological advancement. Hence, the educational mismatch is an important issue that requires close attention from policymakers in this dynamic labour market.
Although the wage penalties and premiums for overeducation and undereducation are well established in the literature, most studies rely on cross-sectional analysis. In contrast, this paper analysed ten-year longitudinal data for New Zealand individuals, using the fixed effects model to address unobserved heterogeneity. The contribution of this study lies in analysing wage differentials repeatedly for the same individuals across three census waves. Cross-sectional estimates may conflate mismatch effects with individual ability or other time-invariant characteristics. By using the fixed effect model, this study isolates within-individual income changes associated with changes in mismatch status. Hence, this study methodologically contributes by examining within-individual wage differentials rather than sorting individuals using data from the Census New Zealand and the Administrative Population Census (APC) accessed through Stats NZ’s Integrated Data Infrastructure (IDI).
In addition, the first study presents wage trajectories for educationally mismatched and matched employees over time in New Zealand. It further models five-year transition and ten-year mismatch trajectories to understand mobility and stability of the mismatch status across waves. This research contributes to educational, occupational, institutional, and other labour market policies in New Zealand, highlighting ways to minimise wage disparities among equally educated employees.
The remainder of the paper is structured as follows. Section two presents the literature review. Section three explains the data and methodology. Section four provides the results and analysis, and Section five discusses conclusions and implications.
2. Literature review and hypothesis
This section aims to provide a comprehensive theoretical and empirical framework and to present the key research hypothesis.
2.1 Theoretical review
This research draws on three major labour market theories: human capital theory, the job competition model and the assignment model.
Human capital theory suggests that individual earnings are determined by human capital characteristics such as education, on-the-job training and experience (Becker, 1964; Mincer, 1958; Schultz, 1961). However, human capital theory focuses on the supply-side factors of the labour market. Previous studies have argued that individual earnings are also determined by job characteristics (Carroll and Tani, 2013; Lasso-Dela-Vega et al., 2023; Reis, 2017; Rumberger, 1981).
According to Thurow (1975), the primary determinant of earnings is the occupational characteristics. The theory suggests that additional job-relevant cognitive skills cannot be acquired before entering the labour market and through on-the-job training. Verdugo and Verdugo (1989) have noted that the job competition model offers a rational explanation for overeducation, while some scholars have rejected it, concluding that earnings are not only determined by job characteristics (Bauer, 2002; Lasso-Dela-Vega et al., 2023; Reis, 2017).
The assignment model states that earnings are determined by both occupation (labour demand) and employee characteristics (labour supply) (Sattinger, 1993; Thurow, 1975). Indeed, this theory supports the definition of educational mismatch. Employees’ characteristics determine the level of schooling, and job characteristics determine the required schooling. The assignment model is widely supported in recent literature, with empirical studies confirming the combined role of employee educational characteristics and job requirements in determining earnings (Lasso-Dela-Vega et al., 2023; Mateos Romero et al., 2017; Reis, 2017). This study aims to contribute to labour market theories through econometric analysis.
2.2 Empirical review
Overeducation is common in developed countries due to increased educational investment and enrolment (Duncan and Hoffman, 1981; Mateos-Romero and Salinas-Jiménez, 2018; Sam, 2019; Sun and Kim, 2021; Verhaest and Omey, 2010). The most common finding in the educational mismatch literature is that overeducated employees earn less relative to matched employees, while undereducated employees earn more. (Arranz and García-Serrano, 2025; Iriondo and Pérez-Amaral, 2016; Mateos Romero et al., 2017; Mavromaras et al., 2013; Sun and Kim, 2021) However, there is no consensus on whether the mismatch is temporary or persistent, and the literature shows mixed findings regarding its consistency. Most existing evidence is based on cross-sectional or short-term data, limiting the ability to assess persistence over time.
There is a substantial skill gap among workers with the same educational qualifications, which accounts for the wage disparity for overeducation. Groot and van den Brink (2000) argue that if an employee’s education exceeds the level required for their work, they are overeducated. Overeducated employees would hence not be subject to a wage penalty. This argument suggests that they would be paid less because of their inferior skills. However, overeducation does not necessarily imply lower skills; rather, it may reflect differences in skill utilisation, job allocation, or labour market conditions. Therefore, some scholars consider individual heterogeneity among workers owing to their talents and intrinsic capacities (Chevalier, 2003; Mateos Romero et al., 2017; Sun and Kim, 2021). In contrast, others assume that there is no heterogeneity across individuals. According to Mateos Romero et al. (2017), higher skill levels tend to increase the return on years of education.
Currently, labour market activities and occupations are rapidly changing. As a result, job requirements may deviate from formal educational levels due to rapid technological development, automation, and digitalisation. When individuals apply their educational knowledge in the workplace, labour market requirements may not align with skills demanded by AI-driven job transformation and emerging technologies. These structural and technological changes may increase the mismatch and skill requirements in the labour market.
Recent studies have expanded the concept of educational mismatch beyond traditional measures. Concerns have been raised regarding measurement accuracy and misclassifications in realised matches approaches, as they may conflate mismatches with labour-market inefficiencies or structural issues (Wen and Maani, 2022). In addition, credential inflation may contribute to a higher level of overeducation, as the increasing enrolment in higher education reduces the value of educational qualifications (Araki, 2020; Kariya, 2011). Job quality and skill utilisation have also been identified as important factors influencing mismatch outcomes (Allen, 2001; Araki, 2020; Groot and van den Brink, 2000; Levels et al., 2014; OECD, 2019; Poot and Stillman, 2016). Finally, recent studies highlight that mismatch is a dynamic process, with individuals moving in and out of mismatch states over time (Bauer, 2002; Maani and Wen, 2021; Zheng et al., 2021). These developments underscore the need for longitudinal analyses of educational mismatch.
Previous studies used three methods to measure educational mismatch: the job analysis method, the realised matches method and the self-assessment method. Each method has limitations, but the realised matches method is widely used for large data sets. The self-assessment method is used in research by asking individuals about their educational requirements for the job; however, the level of mismatch may be subject to respondent bias (Chevalier, 2003; Mateos Romero et al., 2017; Verhaest and Omey, 2010). The job analysis method measures required education using occupational classification information from the International Standard Classification of Occupations (ISCO). However, the data is typically updated infrequently in ISCO, and the mismatch calculation may be outdated due to classification changes, and may not reflect updates in the job market (Chevalier, 2003; Hartog, 2000; Reis, 2017; Rumberger, 1981; Sam, 2019; Sun and Kim, 2021; Verhaest and Omey, 2010). The third approach is the realised matches method, in which the mean or modal educational level of individuals employed in each occupation serves as the benchmark (Bauer, 2002; Lasso-Dela-Vega et al., 2023; Mendes de Oliveira et al., 2000; Nieto and Ramos, 2016; Verdugo and Verdugo, 1989; Verhaest and Omey, 2010).
The New Zealand labour market is characterised by a high tertiary participation, a diverse immigrant workforce, geographical variations in employment opportunities, and technological advancements (Brownie et al., 2025; OECD, 2021). These complexities emphasise the need for policies that address wage disparities stemming from educational mismatch. Evidence from New Zealand is consistent with international findings, highlighting that returns to required education exceed those associated with overeducation and undereducation, highlighting the wage implications of mismatch (Wen and Maani, 2022; Yeo and Maani, 2017). Although immigrants may appear overeducated, this partly reflects the country’s skilled migration policy, and once skill differences are accounted for, immigrants are not necessarily more mismatched than native workers (Poot and Stillman, 2016).
Overeducation is particularly common among graduates, although it may be temporary for some workers (Sam, 2019; Carroll and Tani, 2013). Empirical findings also suggest that overeducated graduates experience wage penalties compared with well-matched workers (Sun and Kim, 2021; Wu and Wang, 2018).
The incidence and impact of educational mismatch vary across demographic and occupational groups. In European and US studies, overeducation is often found to be higher among female workers, although some evidence reports the opposite pattern, suggesting that gender effects are context-specific (Lasso-Dela-Vega et al., 2023; Reis, 2017) In addition, wage penalties associated with overeducation appear largely unaffected by gender (Aina and Pastore, 2020; Sun and Kim, 2021). Occupational differences are also important, with mismatches more prevalent among clerical, professional, and managerial roles than in lower-skilled occupations (Duncan and Hoffman, 1981). At the macro level, mismatch is widespread across OECD economies, with New Zealand exhibiting relatively high levels of qualification mismatch (Mateos-Romero and Salinas-Jiménez, 2018; OECD, 2019).
Previous scholars have mainly focused on cross-sectional data to examine the labour market outcomes of educational mismatch, showing a significant impact on wages (Lasso-Dela-Vega et al., 2023; Liu et al., 2021; Sam, 2019). However, cross-sectional studies cannot account for unobserved individual heterogeneity. Although some panel studies using fixed-effects models address this limitation and confirm the presence of wage penalties (Bauer, 2002; Maani and Wen, 2021; Zheng et al., 2021) they often treat a mismatch as static. This highlights the need to analyse educational mismatch as a dynamic process over time.
To address this, the present study utilises time-varying data from 2013 to 2018 to construct detailed wage-trajectory lines for workers under three mismatch categories. By observing how earnings change over time within these categories, the analysis aims to offer a more nuanced understanding of the long-term implications of the educational mismatch.
Moreover, the study distinguishes the importance of heterogeneity among workers, particularly between those with tertiary qualifications (graduates) and those without (non-graduates). Therefore, this research undertakes a subgroup analysis to assess the effects of mismatch within each group.
2.3 Hypothesis
Based on the aim of this study, there are three main categories of hypotheses. First, the main impact of educational mismatch on wage (main effects). Second, the overtime effect of educational mismatch over a decade (overtime wage-trajectory effect), and finally, the mismatch effect between graduates and non-graduates (group effects).
Overeducated workers earn significantly less than educationally matched workers.
Undereducated workers significantly earn more than educationally matched workers.
The effect of educational mismatch on earnings for graduates deviates from that of others.
The log wage penalty for overeducation is greater for graduates than non-graduates over 3 decades (2013–2023).
Overeducated employees experience a persistent wage penalty compared to matched workers across the ten years (2013–2023).
The wage premium associated with undereducation remains relatively constant over time.
3. Data and methodology
3.1 Data and variables
This study used de-identified microdata from Stats NZ’s Integrated Data Infrastructure (IDI). The sources of the microdata are NZ Census 2013, 2018, 2023 and the APC [1]. Census data is available every five years, and this study used individual-level data from the most recent three Censuses conducted in 2013, 2018, and 2023 [2].
The study utilised a balanced panel dataset comprising 1,532,949 observations, representing 510,983 individuals across three waves: 2013, 2018, and 2023. Each individual appears at all three time points, enabling consistent longitudinal analysis of educational mismatch and earnings. The study considered all employees, excluding self-employed individuals, from the working population aged 15 to 65.
3.1.1 Dependent variable: log hourly real wage
In this research, the dependent variable is the natural logarithm of the real wage, derived from annual wage and salary data available in the APC. This study computed the hourly wage rate by dividing an individual’s weekly earnings of wages and salaries by their total number of hours worked per week.
The nominal hourly wages were converted to real hourly wages using a price index with 2017 as the base year (CPI = 1002.71). Additionally, to mitigate the influence of extreme values, the top and bottom 1% of the wage distribution were excluded from the sample.
The dependent variable is specified in logarithm form, which is standard in wage analysis. This transformation also facilitates the interpretation of the coefficient in percentage terms. This approach is consistent with the widely used Mincer wage equation, which models log wages as a function of education, experience, and other relevant covariates.
3.1.2 Key independent variables: measurement of educational mismatch
This research applies the realised matches method to measure educational mismatch, as it is well-suited to large administrative datasets and reflects the distribution of educational credentials across occupations over time. The dataset does not include self-assessed measures of mismatch, making this approach appropriate.
To ensure robustness, both mode and mean-based measures are used. The mode method is relatively strict and does not account for variation in educational levels, whereas the mean method considers individuals as matched if their education falls within one standard deviation of the occupational average.
The required years of schooling were derived separately for each census year (2013, 2018, and 2023) using the 2-digit occupation codes of the Australian and New Zealand Standard Classification of Occupations (ANZSCO). Then, the actual years of education are compared with the occupation-specific benchmark. The limitation of this method is that the realised-matches method used to classify mismatches is prone to misclassification, as occupational averages may reflect structural labour shortages rather than true mismatches. However, the use of a large population-level dataset may reduce random misclassification. In addition, the analysis includes occupation fixed effects as a robustness check to help reduce potential bias arising from occupational wage differences.
The other control variables fall into several categories: human capital, demographic, and occupational characteristics.
3.1.3 Human capital variables
The years of education are derived using ISCED levels in the Census data. This research followed the New Zealand guidelines for the PIAAC (Programme for the International Assessment of Adult Competencies) public-use dataset to compute years of schooling. This method ensures the validity of the analysis because it aligns with the standardised OECD guidelines that support the international comparison.
The years of experience are derived using the following equation.
The possible labour market experience is derived by subtracting years of schooling and the starting age of schooling (formal schooling in New Zealand usually begins at age six) from the age. Following the standard labour economic practices (Mincer, 1974) this paper includes the linear and squared terms of experience as control variables.
Although training is the next most important determinant of earnings, there are no data on training in the Census or the APC.
3.1.4 Demographic variables
This research incorporated year-specific dummy variables for gender (female 2018, female 2023), immigrant status (immigrants 2018, immigrants 2023) and disability (disabled 2018, disabled 2023). This approach helps to understand the group-based wage changes relative to the baseline and avoid multicollinearity, ensuring the model aligns with the panel data structure.
New Zealand is considered a multicultural economy; thus, immigrant status may be a significant determinant of wage rates. If the employee was born in New Zealand, they are considered natives, and the others are considered immigrants. Based on the census data, the disability level is also one of the control variables for the wage rate in this study’s model.
3.1.5 Occupational characteristics
According to the Job Competition Model, occupational characteristics play a significant role in determining wage levels. Employment status is represented as a dummy variable distinguishing between full-time and part-time work. The sector of ownership comprises five categories: producer enterprises, financial intermediaries, general government, private non-profit organisations serving households, and the rest of the world. Although job tenure, firm size and skill-use measures are important variables, they are not available in the APC or Census datasets from Stats NZ.
3.1.6 Graduates and non-graduates
This research uses a subgroup regression model for graduates and non-graduates to identify and compare the earnings impact of educational mismatch for the two groups. The marginal effects and wage trajectories across different mismatch groups of graduates and non-graduates helped to determine the overtime wage impact of educational mismatch for these two groups.
If the highest qualification was at ISCED Level 7 or above on the NZ Qualifications Framework (NZQF), the study classified individuals as graduates. Employees were considered non-graduates if their ISCED level was 6 or lower. Non-graduates include secondary school leavers and those holding certificates and diplomas.
3.2 Methodology
3.2.1 Econometric models
This study employed a fixed-effects (FE) panel regression model to estimate the impact of educational mismatch on earnings over a decade. The longitudinal nature of the data supports the use of the FE model, as it controls for unobserved time-invariant characteristics such as worker motivation, family background, and ability.
The year dummy variable is used to control some macroeconomic factors common to all observations, such as structural changes and other crises in New Zealand’s labour market. Equation (1) represents the FE model of the study.
Where,
= real hourly wage of individual i in year t
= mismatch category (matched, overeducation, undereducation)
= control variables
= individual fixed effect
= year dummies
= error term
Using fixed-effects regression models, the marginal effects of educational mismatch on wages were estimated to capture differential wage outcomes across mismatch categories. Given the longitudinal focus of the study, marginsplot visualisations were employed to illustrate the evolution of wage trajectories over time. These plots present predicted real hourly wages across three mismatch categories for each survey year (2013, 2018, and 2023). To provide a comprehensive view, four sets of trajectory lines were generated: two representing the full sample, using both the mode-based and mean-based mismatch measurement methods, and two additional sets stratified by education level, distinguishing between graduates and non-graduates. The main limitation of this analysis is that the years-of-schooling variable is treated as exogenous. However, this study incorporates the FE model to control time-invariant unobserved heterogeneity across individuals. FE model controls for time-invariant individual characteristics and reduces bias arising from unobserved heterogeneity. Nevertheless, other factors may influence both education and the mismatch level over time. Hence, the results are interpreted as associations rather than strict causal effects.
3.2.2 Dynamic analysis of mismatch
To examine mobility and stability across mismatch categories over the observed decade (2013–2023), we conduct a dynamic analysis using transition matrices and trajectory classifications.
First, we construct five-year transition matrices for matched, overeducated and undereducated employees for the periods 2013–2018 and 2018–2023. These matrices calculate the transition probabilities between mismatch states across consecutive waves.
Second, we classify individuals into ten-year mismatch trajectories based on changes in mismatch status across the three census waves. Individuals who remain overeducated or undereducated across all waves are classified as persistent overeducated and persistent undereducated, respectively. Individuals who move from mismatched in 2013 to matched in 2023 are classified as upward mobility, while those who move from matched in 2013 to mismatched in 2023 are classified as downward mobility. All remaining patterns involving multiple state changes are categorised as fluctuating trajectories.
3.2.3 Robustness checks
The analysis includes occupation fixed effects to address structural wage differences across occupations. In addition, random-effects estimation with the Hausman test, experience sensitivity, and quantile regression are included to strengthen the analysis.
4. Results and analysis
The main objective of this chapter is to analyse the earnings impact of overeducation in New Zealand over a decade across three census waves.
Table 1 provides descriptive statistics of the variables. Approximately 50% of the sample are female employees, while the remaining 50% are male. The average year of experience is 22.8, and the mean years of schooling of the sample is 14 years. Approximately 70% of the observations are native workers, while 30% are immigrants. New Zealand is considered a multicultural economy; thus, immigrant status may be a significant determinant of wage rates. Based on the census data, the observations were divided into two categories considering their disability level.
Descriptive summary statistics
| Variable | Observations | Mean | Standard deviation |
|---|---|---|---|
| Dependent variable | |||
| Real wage | 1,532,949 | 31.1 | 16.0 |
| Ln wage | 1,532,949 | 3.3 | 0.6 |
| Independent variables | |||
| Human capital variables | |||
| Years of schooling | 1,532,949 | 14.0 | 2.3 |
| Experience | 1,532,949 | 22.8 | 11.4 |
| Experience squared | 1,532,949 | 651.1 | 523.3 |
| Demographic variables | |||
| Male | 1,532,949 | 0.5 | 0.5 |
| Female | 1,532,949 | 0.5 | 0.5 |
| Native | 1,532,748 | 0.7 | 0.4 |
| Immigrant | 1,532,748 | 0.3 | 0.4 |
| Not Disable | 1,444,962 | 1.0 | 0.2 |
| Disable | 1,444,962 | 0.9 | 0.2 |
| Occupational characteristics | |||
| Full-time work | 1,532,586 | 0.9 | 0.3 |
| Part-time work | 1,532,586 | 0.1 | 0.3 |
| Producer Enterprise | 1,532,949 | 0.7 | 0.4 |
| Financial intermediaries | 1,532,949 | 0.1 | 0.2 |
| General government | 1,532,949 | 0.2 | 0.4 |
| Private non-profit organisations serving households | 1,532,949 | 0.0 | 0.2 |
| Rest of the world | 1,532,949 | 0.0 | 0.0 |
4.1 Educational mismatch
Table 2 presents the rate of educational mismatch among individuals in 2013, 2018, and 2023. First, the table presents the mismatch according to two approaches of the realised matches method (mode and mean). Then, the table illustrates educational mismatch across different educational attainment levels (graduates and non-graduates).
Educational mismatch
| Category | Mismatch type | 2013 | 2018 | 2023 |
|---|---|---|---|---|
| All (mode) | Matched | 33.8 | 34.1 | 32.7 |
| Overeducated | 26.1 | 27.9 | 28.0 | |
| Undereducated | 40.1 | 38.0 | 39.3 | |
| All (Mean) | Matched | 68.1 | 63.9 | 64.1 |
| Overeducated | 16.2 | 17.0 | 16.0 | |
| Undereducated | 15.7 | 19.1 | 19.9 | |
| Graduates | Matched | 45.4 | 46.0 | 46.9 |
| Overeducated | 54.6 | 54.0 | 53.1 | |
| Undereducated | – | – | – | |
| Non-graduates | Matched | 29.0 | 28.2 | 25.1 |
| Overeducated | 14.1 | 14.7 | 14.5 | |
| Undereducated | 56.9 | 57.1 | 60.5 |
According to the model method, the rate of educationally matched employees remained relatively stable, varying between 32.7% in 2023 to 34.1% in 2018. The rate of overeducation rose slightly from 26.1% in 2013 to 28.0% in 2023. By comparison, the proportion of undereducated employees shows a subtle decline from 40.1% in 2013 to 38% in 2018, then increases again to 39.3% in 2023. On the other hand, according to the mean-based approach, the share of matched individuals is considerably higher, though it decreased from 68.1% in 2013 to 63.9% in 2018, then rose modestly to 64.1% in 2023. The prevalence of overeducation remained relatively stable according to the mean method, at around 16–17%, whereas undereducation rose from 15.7% in 2013 to 19.9% in 2023.
The mismatch by educational level shows a different scenario. Over 50% of the graduates are overeducated across all three years: 54.6% in 2013 and 53.1% in 2023, while only 45–47% classified as matched graduates. There are no undereducators among graduates. Non-graduates exhibit sustained high levels of undereducation, rising from 56.9% in 2013 to 60.5% in 2023, while the share of well-matched individuals drops to 25.1%. These values suggest that most graduates are employed in jobs below their educational qualifications, whereas most non-graduates are employed in roles that require higher levels of education.
4.2 Occupational mobility
Table 3 explains the percentage change of the 2-digit occupation of employees across observed census waves.
Occupational mobility between census waves (2-digit occupation)
| Transition period | % Changed occupation |
|---|---|
| 2013–2018 | 52.6 |
| 2018–2023 | 54.1 |
According to Table 3, approximately half of workers change their 2-digit occupation between census waves. Occupational mobility increases slightly from 52.6% in 2013–2018 to 54.1% in 2018–2023, indicating a relatively dynamic labour market. This suggests that mismatch-related wage penalties are unlikely to arise solely from remaining in the same job. Instead, wage differences associated with educational mismatch persist despite substantial occupational mobility across waves.
4.3 Five-year mismatch transitions
Table 4 presents the five-year mismatch transition across census waves. The distribution shows a high degree of stability within mismatch categories over time.
Five-year educational mismatch transition
| Educational Mismatch | Matched | Overeducated | Undereducated |
|---|---|---|---|
| Wave 1 (Year 2013) | Wave 2 (Year 2018) | ||
| Matched | 77.5% | 12.5% | 10.0% |
| Overeducated | 11.5% | 80.6% | 7.9% |
| Undereducated | 12.3% | 6.6% | 81.1% |
| Wave 2 (Year 2018) | Wave 3 (Year 2023) | ||
| Matched | 77.1% | 10.3% | 12.6% |
| Overeducated | 10.5% | 80.6% | 8.9% |
| Undereducated | 9.1% | 5.2% | 85.7% |
In both periods, approximately 77% of matched workers remain matched, around 80% of overeducated workers remain overeducated, and between 81 and 86% of undereducated workers remain undereducated. These patterns indicate that mismatch status is relatively stable amid overproduction, and that the premiums associated with undereducation are not merely short-term outcomes. Instead, the stability of mismatch categories supports the presence of sustained wage differences over the observed decade.
In summary, the transition analysis implies that the status of mismatch remains relatively stable across waves, while the fixed-effects regression results show that mismatch is associated with systematic wage differences. Taken together, these findings suggest that the observed wage penalties for overeducation and premiums for undereducation are not merely short-term fluctuations but reflect sustained wage differentials over the observed period.
4.4 Ten-year mismatch trajectories
Table 5 illustrates the stability and mobility of employees across mismatch categorisations between 2013 and 2023. The table helps assess whether educational mismatch is primarily temporary or sustained over the observed decade.
Ten-year educational mismatch persistence and mobility (2013–2023)
| Mismatch trajectory category | Percentage (%) |
|---|---|
| Persistent matched | 21.8% |
| Persistent overeducated | 17.9% |
| Persistent Undereducated | 29.3% |
| Upward mobility (Mismatched to Matched) | 9.3% |
| Downward mobility (Matched to Mismatched) | 10.4% |
| Fluctuating Patterns | 12.0% |
A substantial proportion of workers remain in the same mismatch category throughout the period. The largest single group is persistent undereducation (29.3%), followed by persistent overeducation (17.9%). When combined with persistent matched workers, approximately 69% of individuals remain in the same status across all three waves, while about 31% move from their initial mismatch category. Only a relatively small share of employees (12%) exhibit a fluctuating pattern across waves.
4.5 Fixed effect model, predicted wage and wage trajectories
Table 6 presents the fixed-effects (FE) regression results. Both the mode and mean approaches show a significant negative relationship between overeducation and wages, with overeducated workers experiencing a wage penalty of around 5% relative to matched workers. Although modest, this penalty may accumulate over time and become economically meaningful.
FE Regression analysis
| Variables | All | Graduates | Non graduates | |
|---|---|---|---|---|
| Mode | Mean | |||
| overeducated | −0.0534*** | −0.0535*** | −0.0675*** | −0.0320*** |
| 0.00211 | 0.00200 | 0.00294 | 0.00327 | |
| undereducated | 0.0228*** | 0.0381*** | – | 0.0241*** |
| 0.00188 | 0.00200 | 0.00209 | ||
| year 2018 | 1.6689 | 1.6531*** | 1.5879*** | 1.7775*** |
| 0.02913 | 0.02912 | 0.07459 | 0.03464 | |
| year 2023 | 3.1961*** | 0.0041*** | 3.0614*** | 3.4046*** |
| 0.05827 | 0.00177 | 0.14916 | 0.06930 | |
| years of schooling | −0.2348 | 0.2344*** | −0.2036*** | −0.2655*** |
| 0.00601 | 0.00601 | 0.01556 | 0.00713 | |
| female_2018 | −0.0285*** | −0.0286*** | −0.0413*** | −0.0169*** |
| 0.00170 | 0.00170 | 0.00306 | 0.00207 | |
| female_2023 | 0.0026 | 0.0041** | −0.0313*** | 0.0246*** |
| 0.00177 | 0.00177 | 0.00316 | 0.00218 | |
| experience | −0.2539*** 0.00586 | −0.2510*** 0.00586 | −0.2276*** 0.01497 | −0.2801*** |
| 0.00698 | ||||
| experienceˆ2 | −0.0008*** 0.00000 | −0.0008*** 0.00000 | −0.0011*** 0.00001 | −0.0007*** |
| 0.00006 | ||||
| immigrant_2018 | 0.0458*** 0.00203 | 0.0467*** 0.00204 | 0.0401*** 0.00320 | 0.0529*** |
| 0.00276 | ||||
| immigrant_2023 | 0.0561*** 0.00210 | 0.0574*** 0.00210 | 0.0458*** 0.00329 | 0.0680 |
| 0.00287 | ||||
| disable_2018 | −0.0093** | −0.0089* | −0.0139 | −0.0080 |
| 0.00457 | 0.00457 | 0.00951 | 0.00517 | |
| disable_2023 | 0.0026 | 0.0027 | 0.0025 | 0.0008 |
| 0.00394 | 0.00395 | 0.00830 | 0.00450 | |
| Part-time employment | 0.0808*** | 0.0804*** | 0.0415*** | 0.1067*** |
| 0.00255 | 0.00255 | 0.00450 | 0.00331 | |
| Financial intermediaries | 0.1657*** | 0.1655*** | 0.1417*** | 0.1713*** |
| 0.00479 | 0.00479 | 0.00728 | 0.00634 | |
| General government | 0.0497*** | 0.0481*** | 0.0482*** | 0.0515*** |
| 0.00244 | 0.00244 | 0.00355 | 0.00342 | |
| Private non-profit | −0.0388*** | −0.0396*** | −0.0326*** | −0.0418*** |
| 0.00384 | 0.00384 | 0.00580 | 0.00531 | |
| Rest of the world | 0.0726* | 0.0758* | 0.0921** | 0.0563 |
| 0.03918 | 0.03878 | 0.04505 | 0.05812 | |
| Constant | 3.1997*** | 3.2221*** | 3.2249*** | 3.2334*** |
| 0.01626 | 0.15928 | 0.06427 | 0.19824 | |
| Observations | 1,444,791 | 1,444,791 | 481,149 | 963,639 |
Note(s): Standard errors in parentheses ***p < 0.01, **p < 0.05, *p < 0.1
Undereducated workers receive a wage premium of 2% (mode) and 4% (mean), suggesting that experience and job-specific skills may compensate for lower formal education. The FE model controls for unobserved time-invariant individual characteristics, providing more reliable estimates based on within-individual variation.
When disaggregated, the wage penalty for overeducation is higher among graduates (7%) than non-graduates (3%). No undereducated cases are observed among graduates, while non-graduates receive a small premium. These findings are consistent with prior studies. Year effects indicate an increase in real wages over time.
Additional controls show that education increases wages, gender wage gaps persist but narrow over time, and immigrants earn higher wages, particularly in later years, possibly reflecting labour shortages.
Table 7 reports predicted wages across mismatch categories for 2013–2023. Wages increase over time for all groups; however, overeducated workers consistently earn less than matched workers, with a stable wage gap of around 6%.
Margin table
| Category | Mismatch type | Margin (ln wage) | ||
|---|---|---|---|---|
| 2013 | 2018 | 2023 | ||
| All (mode) | Matched | 2.9531** (0.00175) | 3.3714*** (0.00123) | 3.6438*** (0.00175) |
| Overeducated | 2.8951*** (0.00194) | 3.3135*** (0.00155) | 3.5858*** (0.00206) | |
| Undereducated | 2.9726*** (0.00182) | 3.3909*** (0.00125) | 3.6633*** (0.00169) | |
| All (Mean) | Matched | 2.9489*** (0.00147) | 3.3653*** (0.00077) | 3.6365*** (0.00144) |
| Overeducated | 2.8898*** (0.00212) | 3.3062*** (0.00181) | 3.5774*** (0.00229) | |
| Undereducated | 2.9893*** (0.00226) | 3.4057*** (0.00177) | 3.6769*** (0.00212) | |
| Graduates | Matched | 3.0878*** (0.00321) | 3.5484*** (0.00195) | 3.8930*** (0.00265) |
| Overeducated | 3.0183*** (0.00290) | 3.4789*** (0.00175) | 3.8235*** (0.00275) | |
| Non-graduates | Matched | 2.8781*** (0.00219) | 3.2793*** (0.00167) | 3.5246*** (0.00239) |
| Overeducated | 2.8395*** (0.00287) | 3.2407*** (0.00251) | 3.4860*** (0.00305 | |
| Undereducated | 2.8978*** (0.00187) | 3.2990*** (0.00102) | 3.5442*** (0.00185) | |
Note(s): Standard errors in parentheses ***p < 0.01, **p < 0.05, *p < 0.1
Undereducated workers earn slightly more than matched workers, with a smaller premium (2–4%). The persistence of these gaps over time suggests that mismatch effects are long-term. These findings support the assignment theory, indicating that wages are influenced by job characteristics rather than education alone.
Overeducation is more prevalent among graduates, with no undereducated cases observed. The wage penalty for overeducated graduates (around 7%) is higher than for non-graduates (around 4%), indicating inefficiencies in returns to higher education. This highlights the importance of aligning graduate skills with labour market demand.
Figures 1–4 illustrate the wage trajectory lines across 2013, 2018, and 2023. These lines show the wage patterns predicted for matched, overeducated, and undereducated employees. The wage trajectories for all categories present an upward trend from 2013 to 2023. The wage trajectory line for overeducated employees lies below that of matched workers, with a consistent gap. This gap reveals that the educational mismatch is a long-term issue.
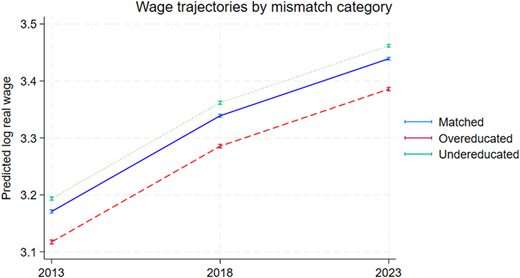
Wage trajectory by mismatch category for all (mode method). Source: Administrative Population Census (APC) data via IDI, authors’ calculations
Wage trajectory by mismatch category for all (mode method). Source: Administrative Population Census (APC) data via IDI, authors’ calculations
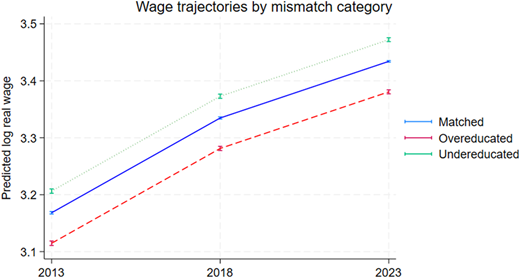
Wage trajectory by mismatch category for all (mean method). Source: Census (2013, 2018, 2023) and Administrative Population Census (APC) data via IDI, authors’ calculations
Wage trajectory by mismatch category for all (mean method). Source: Census (2013, 2018, 2023) and Administrative Population Census (APC) data via IDI, authors’ calculations
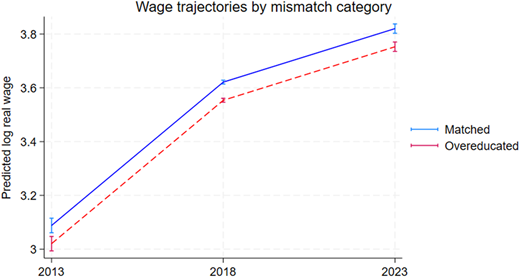
Wage trajectory by mismatch category for graduates (mode method). Source: Census (2013, 2018, 2023) and Administrative Population Census (APC) data via IDI, authors’ calculations
Wage trajectory by mismatch category for graduates (mode method). Source: Census (2013, 2018, 2023) and Administrative Population Census (APC) data via IDI, authors’ calculations
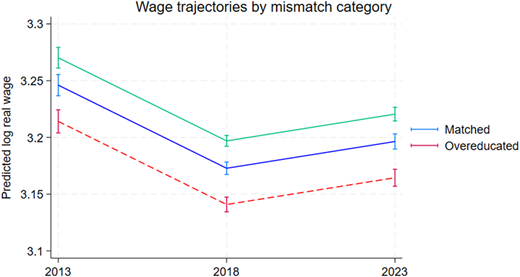
Wage trajectory by mismatch category for non-graduates. Source: Census (2013, 2018, 2023) and Administrative Population Census (APC) data via IDI, authors’ calculations
Wage trajectory by mismatch category for non-graduates. Source: Census (2013, 2018, 2023) and Administrative Population Census (APC) data via IDI, authors’ calculations
Undereducated workers maintain the highest predicted log wage over time. Therefore, overeducated employees fail to benefit from their education due to the mismatch. The finding of this trajectory line supports the assignment theory.
Undereducated workers have the highest wage rate, which is above that of matched workers. This wage premium may reflect unmeasured skills beyond educational qualifications. The wage premium for undereducated workers also remains stable from 2013 to 2023.
Wage trajectory plots show an upward trend for all groups over time. However, overeducated workers consistently earn less than matched workers, while undereducated workers earn the highest wages. The stability of these patterns confirms that mismatch effects persist over time and do not self-correct. This supports the assignment theory and highlights the long-term nature of the mismatch.
Quantile regression results presented in Table 8 further confirm the findings of the fixed effect model. Overeducation is associated with a consistent wage penalty across the wage distribution, while undereducation yields a wage premium, with slightly stronger effects at higher quantiles. This indicates that mismatch effects vary across income levels. The consistency of results across estimation methods, including fixed-effects and quantile models, together with the inclusion of occupation fixed effects, confirms the robustness of the findings.
Quantile regression estimates of wage effects
| Variables | Q25 | Q50 | Q75 |
|---|---|---|---|
| Overeducated | −0.1368*** 0.00240 | −0.1415*** 0.00202 | −0.1436*** 0.00243 |
| Undereducated | 0.1242*** 0.00236 | 0.1423*** 0.00198 | 0.1670*** 0.11239 |
| Controls | Yes | Yes | Yes |
| Year FE | Yes | Yes | Yes |
| Observations | 360,822 |
Note(s): Standard errors in parentheses ***p < 0.01, **p < 0.05, *p < 0.1
According to Table 9, robustness checks confirm the stability of the results. The Hausman test supports the use of the fixed-effects model over random effects. In addition, the inclusion of occupation fixed effects and alternative model specifications, including variations in experience controls, yields consistent results.
Robustness of wage effects of educational mismatch
| Variables | (1) Drop Exp | (2) + Occupation FE | (3) Random effects |
|---|---|---|---|
| Overeducated | 0.0580*** (0.00212) | −0.0282*** (0.00226) | −0.0057*** (0.002111) |
| Undereducated | 0.0195*** (0.00189) | −0.0057*** (0.00211) | 0.1017*** (0.00123) |
| Experience | – | Yes | Yes |
| Experience2 | – | Yes | Yes |
| Occupation FE | No | Yes | No |
| Controls | Yes | Yes | Yes |
| Year FE | Yes | Yes | Yes |
| Individual FE | Yes | Yes | Yes |
| Observations | 1,532,949 | 1,532,949 | 1,532,949 |
| Hausman χ2 | 45.32*** |
Note(s): Standard errors in parentheses ***p < 0.01, **p < 0.05, *p < 0.1
Because the fixed-effects model yields a negative coefficient on overeducation, the regression results support H1 (overeducated workers earn significantly less than educationally matched workers). Hence, there is consistency between this paper’s results and prior literature, confirming that educational mismatch creates labour market issues. The second hypothesis explains the earnings for undereducation. (H2: Undereducated workers earn significantly more than educationally matched workers. Undereducated employees may possess higher job-specific skills and experience than other employees. Hypothesis 3 is about the disparity of earnings between graduates and non-graduates (H3: The effect of educational mismatch on earnings for graduates deviates from that of others). According to the analysis, the wage penalty for overeducated graduates is greater than that for non-graduates, supporting hypotheses 3 and 4 (the log wage penalty for overeducation is greater for graduates than for non-graduates over 3 decades). When considering the overtime effect using wage trajectory lines, the study confirms hypotheses 5 and 6. (H5: Overeducated employees experience a persistent wage penalty compared to matched workers across the ten years (2013–2023), H6: The wage premium associated with undereducation remains relatively constant over time).
Finally, the educational mismatch does not correct itself over time and has implications for labour market efficiency and the return on human capital investment. Therefore, educational mismatch is a persistent problem that requires policymakers’ attention. These policies should be targeted at aligning jobs with education, while reducing wage disparities and improving labour productivity.
5. Conclusion and implications
This paper analysed the impact of educational mismatch on employee earnings for a decade. The educational mismatch is measured using two methods within the realised matched approach. In addition to analysing the educational mismatch, the study separately considers graduates and non-graduates for policy purposes. The group-based model for graduates and non-graduates suggests that most graduates are often employed in jobs below their level of education, while most non-graduates are in roles that require a higher level of education.
In line with existing studies, overeducated employees in New Zealand earn a wage penalty relative to matched workers, and undereducated employees earn a wage premium (Chevalier, 2003; Lasso-Dela-Vega et al., 2023; Liu et al., 2021; Mateos-Romero and Salinas-Jiménez, 2018; Mateos Romero et al., 2017; Sun and Kim, 2021; Zheng et al., 2021). Although the estimated wage penalty for overeducation is approximately 5%, which may appear modest, the cumulative effect over the decade may be economically meaningful, as persistent wage differences can influence long-term earnings progression. Like other developed nations, New Zealand also invests more in higher education, expecting future benefits. With education expansion, there may be a misalignment between the demand for and the supply of employees across several job types. However, it is difficult to conclude that there is an excess supply of educated employees, given the higher rate of undereducation among non-graduates. This suggests that the educational qualifications and other skills expected by an employer may not align in several conditions. Nonetheless, the education level of non-graduates is below the occupational requirements; they may have strong skills and experience for their job role.
According to the margin tables and wage trajectories, the wage rate for each mismatch category shows an upward trend from 2013 to 2023. The wage trajectory for overeducated employees lies below that of the educationally matched employees, while that of undereducated employees is above that of the matched. The parallel gap between the trajectories justifies that the educational mismatch is a long-term issue in the New Zealand Economy. The wage trajectories for graduate employees exhibit a similar pattern, underscoring the importance of policies that align educational qualifications with occupational requirements.
The study supports the assignment theory, concluding that both individual characteristics and occupational characteristics determine the wage rate.
The findings of this study aim to provide insights into the formulation of labour market and educational policies in several ways. The educational mismatch is a common and persistent issue in New Zealand, highlighting the misalignment of the demand and supply of labour. New Zealand has expanded enrolment in tertiary education; thus, more graduates and postgraduates enter the labour market. This creates a misalignment because the labour market cannot absorb all the degree holders into graduate jobs. Even though tertiary education creates a knowledgeable and skilled workforce, some sectors and jobs of the labour market do not require degree-level qualifications. This creates overeducation in the economy. Based on that, the penalty of overeducation in this study may be due to the allocative inefficiency of education, while the premium for undereducation may be due to skills and experience rather than education. Therefore, the policy on mitigating overeducation should not only focus on tertiary education but also on encouraging skills aligned to the labour market requirements.
The policies need to strengthen school and university career guidance using the updated labour market data. For instance, Careers.govt.nz is a good platform for discussing mismatch trends and providing insights into related career guidance. It is significant to promote employer-education partnerships to inform career guidance and curriculum among relevant stakeholders. Second, regularly reviewing university enrolments and funding allocation helps to mitigate the mismatch. Tertiary education providers may adjust their programme offerings by reviewing skill shortages (high enrolments and funding for skill-shortage sectors).
Furthermore, greater emphasis should be placed on internships and work-integrated learning to mitigate the mismatch. Next, encourage lifelong learning among adult employees by expanding flexible learning. The government should promote organisations to provide tailored support to their workers in skill matching. Research and development expenditure in education can be enhanced by encouraging Stats NZ to regularly collect administrative data on the persistent mismatch.
The main limitation of this analysis is that it treats the years-of-schooling variable as exogenous. However, this study incorporates the FE model to control time-invariant unobserved heterogeneity. In the Mincer Specification, unobservable individual effects are collected in the disturbance term, and there is likely to be a correlation between years of schooling and the disturbance term. Additionally, the census provides data periodically; thus, the study used data for 2013, 2018 and 2023. The APC contains annual data from 2013 to 2023 on income, education and other occupational characteristics. However, the occupational classification, which is essential for measuring educational mismatch, is available only from the Census for 2013, 2018, and 2023. Hence, the unavailability of annual occupational data constrains the wage trajectory only for the above three years within the decade. Next, although it is important to apply a subjective method that considers employees’ self-perceived mismatch, the data is unavailable in Stats NZ. The PIAAC survey data on IDI stats NZ is rich in subjective information on mismatch. Nonetheless, those data are insufficient to analyse the persistent effects across repeated observations.
This research offers valuable insights into how vertical educational mismatch impacts persistent earnings. First, future research could investigate how mismatches in the field of study lead to wage disparities over time. Second, analysing the relationship between technological advancement and educational mismatch would yield valuable insights into labour market policies. Second, continuous technological advancements are rapidly influencing individuals, economies, and societies. If someone is unable to adapt, their education may be misaligned with their job. Therefore, examining the link between technological change and educational mismatch can inform labour market policy. Third, exploring the mismatch trajectories for immigrants would also significantly contribute to the academic literature and international labour and migration policy frameworks. Ultimately, a comparative study of wage disparities arising from educational mismatches across occupational sectors would benefit individuals by informing decisions about educational investments and labour market improvements.
Disclaimer
Access to the data used in this study was provided by Stats NZ under conditions designed to give effect to the security and confidentiality provisions of the Data and Statistics Act 2022. The results presented in this study are the work of the author, not Stats NZ or individual data suppliers.
These results are not official statistics. They have been created for research purposes from the [Integrated Data Infrastructure (IDI) and/or Longitudinal Business Database (LBD)] which [is/are] carefully managed by Stats NZ. For more information about the [IDI and/or LBD] please visit https://www.stats.govt.nz/integrated-data/.
Notes
Access to the data used in this study was provided by Stats NZ under conditions designed to give effect to the security and confidentiality provisions of the Data and Statistics Act 2022. The results presented in this study are the work of the author, not Stats NZ or individual data suppliers.
Census | Stats NZ provides more information on Census NZ.

