


Probability-impact matrices are widely embedded in project governance systems and used to prioritise risks, allocate mitigation resources and trigger management escalation. This study examines whether commonly used qualitative risk matrices preserve relative risk prioritisation when compared to quantitative assessments of the same risks.
The study analyses 1,144 paired qualitative and quantitative risk assessments from 91 mining capital projects across 43 organisations. Paired nonparametric tests, distributional comparisons, Wasserstein distance metrics and colour-band reclassification analysis are used to evaluate differences in probability ratings, impact ratings and composite risk scores.
Qualitative and quantitative probability ratings align at the ordinal level. In contrast, qualitative impact ratings and composite risk scores are systematically higher than their quantitative counterparts. Quantitative reassessment altered escalation colour bands in 73.3% of risks, with 59.4% moving to lower bands and 37.2% shifting by two or more categories, indicating material changes in prioritisation. These findings suggest that qualitative matrices do not reliably preserve escalation stability under alternative elicitation formats.
When escalation outcomes depend on representational format, risk-informed governance becomes structurally unstable. Hybrid configurations that separate qualitative communication from quantitative decision support can enhance decision quality and improve the robustness of prioritisation and contingency allocation.
The study introduces escalation stability as a practical criterion for evaluating risk assessment tools and provides large-sample empirical evidence that elicitation format materially influences risk prioritisation in capital projects.
Introduction
Risk registers and risk matrices have become central tools for identifying risks, assessing their severity, and prioritising mitigation actions (Aven, 2016). They are widely applied across sectors such as engineering (Meyer and Reniers, 2022), construction (Qazi et al., 2021), healthcare (Shirley, 2020), oil and gas (AlNoaimi and Mazzuchi, 2021), and information technology (Brewer and Dittman, 2022).
Their continued popularity is reinforced by project management textbooks (Hickson and Owen, 2022; Hillson, 2024; Madauss, 2025; Meredith et al., 2017) and formalised through standards and guidance such as ISO 31000 (ISO, 2019), PRINCE2 (PeopleCert International Limited, 2023), and the PMBOK® Guide (PMI, 2025). The appeal of risk matrices lies primarily in their simplicity and communicative power: complex and uncertain risk information can be condensed into intuitive, colour-coded grids that support discussion and reporting to a wide range of stakeholders. The assumed potential of risk matrices to improve decision making underpins much of the discussion surrounding their use (Willumsen et al., 2019).
However, despite their widespread adoption and apparent practicality, the extent to which risk matrices reliably represent underlying risk and support sound decision-making remains contested. This tension between ubiquity and validity motivates a growing body of critical research.
This study shifts the focus from whether risk matrices are theoretically sound to how widely used risk elicitation practices shape project decisions regarding prioritisation, escalation, and allocation of limited mitigation resources, and whether these practices produce assessments of probability and impact that correspond to quantitatively expressed project risk. In this study, decision quality refers not to the accuracy of any single estimate, but to the stability and coherence of risk prioritisation under alternative but legitimate elicitation formats. A risk assessment method exhibits high decision quality if it preserves relative exposure ordering and escalation outcomes when the same risks are expressed using different, but internally consistent, representations of uncertainty.
Positioning and contribution
Probability-impact matrices are deeply embedded in the governance infrastructure of project-based organisations. They shape escalation decisions, influence contingency allocation, and determine which risks receive executive attention. Despite their ubiquity in standards and textbooks, their continued use rests more on assumptions of simplicity and communicative clarity than on empirical evidence of decision robustness (Raz and Michael, 2001).
Most critiques have focused on mathematical deficiencies or axiomatic inconsistencies (Cox, 2009). While important, such critiques have had limited influence on practice. Governance boards continue to rely on matrices because they provide an apparently structured basis for prioritising scarce managerial attention in complex capital environments (APM, 2010; ISO, 2019; PMI, 2025).
This study shifts the debate from formal validity to decision quality in real governance contexts. Rather than asking whether matrices satisfy axioms, it examines whether qualitative and quantitative elicitation methods produce materially different prioritisation outcomes for the same risks within the same projects. The question is not which method is more accurate, but whether commonly used qualitative matrices preserve relative risk ordering when compared with numerically expressed assessments.
Drawing on 1,144 paired assessments across 91 mining capital projects and 43 organisations, the study shows that qualitative impact ratings and composite scores are systematically inflated relative to quantitative reassessment. While probability ratings align at the ordinal level, impact inflation distorts composite scores that inform escalation thresholds and mitigation prioritisation.
The contribution to managing projects in business is threefold:
Escalation stability as a governance criterion
The study introduces escalation stability as a governance-oriented criterion for evaluating the decision quality of risk assessment tools. Escalation stability concerns whether risk prioritisation and escalation outcomes remain stable when the underlying risks are expressed using alternative but internally consistent representations of uncertainty. Drawing on concepts of decision robustness and prioritisation consistency, the theoretical foundations of escalation stability are developed in the literature review and examined empirically through the comparison of 1,144 paired qualitative and quantitative risk assessments. The findings show that commonly used qualitative matrices do not consistently preserve escalation outcomes under alternative elicitation formats.
Decision-quality diagnostics for risk artefacts
By integrating paired nonparametric tests, distributional comparisons, and Wasserstein distance metrics, the study provides a replicable framework for testing whether risk artefacts preserve exposure ordering under format variation.
Separation of communication and decision logic
The findings suggest that qualitative matrices may serve effectively as communication devices but are insufficient as decision engines. Hybrid configurations that separate communicative simplicity from analytical rigour enhance governance robustness.
Ensuring that risk prioritisation tools preserve decision coherence is a governance imperative for capital intensive organisations. Even modest distortions in impact estimation can influence portfolio-level capital allocation where escalation triggers investment decisions (Archer and Ghasemzadeh, 1999; Baccarini and Archer, 2001).
Literature review
Structure of risk matrices
Project risks are commonly expressed in terms of the probability of occurrence and the impact on project objectives such as cost, schedule, safety, or reputation. Risk matrices are typically used alongside risk registers, where individual risks are articulated using a structured metalanguage that specifies the cause, event, and potential effect on objectives (Hillson and Simon, 2020). Assessed risks are rated on discrete ordinal scales, most commonly 1–5 for both probability and impact, and mapped to a matrix (Figure 1).
 A table titled Risk Matrix Example showing an example 5 × 5 risk matrix. Columns represent impact ratings: 1 (Very Low), 2 (Minor), 3 (Moderate), 4 (High), and 5 (Major). Schedule impact thresholds are: less than 5 percent (Very Low), 5 to 10 percent (Minor), 10 to 15 percent (Moderate), 15 to 25 percent (High), and greater than 25 percent (Major). Cost impact thresholds are: less than 1 percent (Very Low), 1 to 5 percent (Minor), 5 to 10 percent (Moderate), 10 to 20 percent (High), and greater than 20 percent (Major). Rows represent probability ratings: 5 (Very Likely, greater than 80 percent), 4 (Likely, 60 to 80 percent), 3 (Possible, 35 to 60 percent), 2 (Unlikely, 10 to 35 percent), and 1 (Rare, less than 10 percent). Matrix cells contain the product of the probability and impact ratings, producing risk scores from 1 to 25. Scores 1 to 6 are classified as Low (green), scores 8 and 12 as Moderate (yellow), and scores 15 to 25 as High (red). Overall risk severity increases from the lower-left corner to the upper-right corner.
Risk matrix example
A table titled Risk Matrix Example showing an example 5 × 5 risk matrix. Columns represent impact ratings: 1 (Very Low), 2 (Minor), 3 (Moderate), 4 (High), and 5 (Major). Schedule impact thresholds are: less than 5 percent (Very Low), 5 to 10 percent (Minor), 10 to 15 percent (Moderate), 15 to 25 percent (High), and greater than 25 percent (Major). Cost impact thresholds are: less than 1 percent (Very Low), 1 to 5 percent (Minor), 5 to 10 percent (Moderate), 10 to 20 percent (High), and greater than 20 percent (Major). Rows represent probability ratings: 5 (Very Likely, greater than 80 percent), 4 (Likely, 60 to 80 percent), 3 (Possible, 35 to 60 percent), 2 (Unlikely, 10 to 35 percent), and 1 (Rare, less than 10 percent). Matrix cells contain the product of the probability and impact ratings, producing risk scores from 1 to 25. Scores 1 to 6 are classified as Low (green), scores 8 and 12 as Moderate (yellow), and scores 15 to 25 as High (red). Overall risk severity increases from the lower-left corner to the upper-right corner.Risk matrix example
Probability scales may be purely qualitative (e.g. rare to very likely) or linked to predefined probability ranges, while impact scales are defined using fixed values or percentages of key project metrics such as cost or duration (Baccarini and Archer, 2001; Hillson and Simon, 2020; PMI, 2024). Despite their ordinal nature, these ratings are frequently combined using a loss function, most commonly multiplication (e.g. ), to produce a numerical risk score (Cox, 2008; Williams, 1993). The loss function may incorporate non-linear adjustments or yield categorical outputs such as High, Moderate, or Low.
The resulting risk scores are frequently associated with decision categories, often represented through colour bands (e.g. green, yellow, red), and are intended to guide the prioritisation of mitigation actions in line with organisational risk thresholds.
In practice, risk matrices inform three core project management decisions: (1) which risks receive management attention, (2) which risks justify mitigation expenditure or contingency, and (3) which risks are escalated to governance forums.
Decision robustness, prioritisation consistency, and escalation stability
Two strands of the decision-science literature bear directly on the question of whether risk matrices support sound governance. The first concerns decision robustness: the property that a recommended course of action remains appropriate under plausible variations in inputs, models, or representations (Ben-Haim, 2019; Rosenhead, 2001). The second concerns prioritisation consistency: the requirement that tools used to rank alternatives preserve the ordering of those alternatives under reasonable reformulations of the same information (Cox, 2008; Hubbard and Evans, 2010). Cox's axioms operationalise consistency at the level of individual cell assignments, while robustness analysis operationalises it at the level of downstream decisions.
Escalation stability sits at the intersection of these two ideas. Where robustness analysis asks whether a decision survives input variation, and consistency asks whether a ranking survives reformulation, escalation stability asks whether the governance action triggered by a risk artefact, the escalation band and the managerial response it implies, survives a change in elicitation format. In project-based organisations, where colour bands are formally linked to prescribed actions (APM, 2010; ISO, 2019; PMI, 2025), escalation stability is the property that most directly determines whether risk-informed governance is reproducible across legitimate methods of representing the same risks.
Criticism of risk matrices
Theoretical and axiomatic critiques
The first line of critique concerns the formal logic of risk matrices. Cox and Popken (2007, p. 444) argue that, under certain joint distributions of probability and consequence, “the information provided by the risk matrix is worse than useless,” meaning that it may perform worse than random assignment when guiding risk-based decisions. Cox (2009) identifies four fundamental deficiencies, i.e. poor resolution, errors in comparative risk rankings, suboptimal resource allocation, and ambiguity in both inputs and outputs, and proposes three axioms: weak consistency, betweenness, and consistent colouring, that many commonly used matrices violate. Thomas et al. (2014) and Wall (2011) extend these arguments, showing that scoring rules based on the multiplication of ordinal ratings cannot preserve the relative ordering of risks when the underlying probability and consequence distributions are continuous. Despite their analytical force, these critiques have had limited influence on practice, a disjunction that later sections of this review seek to explain (Besner and Hobbs, 2012).
Behavioural and cognitive critiques
A second line of critique concerns how people elicit, combine, and interpret ratings within matrix formats. Verbal probability phrases are interpreted inconsistently across individuals and contexts (Budescu and Wallsten, 1995; Wallsten et al., 1986), and numerical and verbal judgements diverge systematically in both calibration and coherence (Erev and Cohen, 1990; Wallsten et al., 1993). Classic work on calibration (Lichtenstein et al., 1977) and on prospect-theoretic distortion of probability and value judgements (Kahneman and Tversky, 1979) provides the cognitive basis for expecting qualitative and quantitative assessments of the same risk to diverge. More recently, Proto et al. (2023) show that colour-coded cells in risk matrices systematically influence risk perception and decision-making, and that these effects are strongest for numerically sophisticated users, undermining the common assumption that visual simplification is cognitively neutral. Krisper (2021) catalogues 24 distinct problems across elicitation, aggregation, and interpretation phases, many of which are cognitive rather than mathematical in origin. Together, these studies indicate that matrix-based assessments are not neutral measurements, but judgements shaped by the representational format in which they are elicited.
Design improvements and alternative methods
A third line of work proposes modifications or alternatives intended to address the above weaknesses. Ward and Chapman (2011) advocate a broader uncertainty-management perspective using influence diagrams and causal mapping. Qazi et al. (2020) extend this line by proposing structured methods for prioritising interdependent uncertainties, which conventional matrices treat as isolated. Levine (2012) proposes a logarithmically scaled, letter-coded matrix designed to satisfy Cox's axioms. Duijm (2015) argues for continuous probability-impact diagrams to address inconsistencies in discrete matrices, and Hubbard and Evans (2010) advocate replacing ordinal scoring with explicit probabilistic methods. More recent work focuses on representational design and cognitive alignment: Sutherland et al. (2022) show that matrix layout, labelling, and scale geometry influence judgement, and propose geometrically increasing scales with embedded probability-impact ranges; Acebes et al. (2024) introduce Monte Carlo-based approaches to differentiate risks by cost and schedule effects, and Qazi et al. (2021) demonstrate a hybrid matrix-simulation approach in sustainable construction, illustrating the broader move toward combining qualitative representation with quantitative decision support. Although these contributions address important limitations, most retain qualitative or semi-quantitative elicitation structures. The extent to which such assessments correspond to numerically expressed risk therefore remains unresolved.
Organisational and symbolic uses of risk artefacts
A fourth line of inquiry shifts the question from whether matrices are valid to why they persist.
Zhang (2011) distinguishes two schools of project risk analysis: a factual school concerned with the accuracy of risk representation, and a behavioural school concerned with how risk artefacts function in organisational practice. The first three strands reviewed above sit largely within the factual school; a fourth, behavioural strand asks why matrices persist despite their documented weaknesses.
Raz and Michael (2001) find that tool adoption in project risk management is driven less by demonstrated decision benefit than by perceived legitimacy and ease of communication. Deliberate ignorance in project risk management is a well-described phenomenon where risks known to practitioners are deliberately excluded from formal registers, suggesting that risk artefacts serve organisational functions beyond analytical exposure assessment (Kutsch and Hall, 2010; Willumsen et al., 2024). Green and Dikmen (2022) develop this line most explicitly, conceptualising project risk management as a narrative practice through which managerial rationality is performed and legitimised: risk registers and matrices function as governance artefacts that render uncertainty visible, auditable, and accountable, independently of their analytical accuracy. From this perspective, the persistence of matrices, despite decades of axiomatic and behavioural critique, is not a puzzle but a predictable consequence of their role in organisational accountability structures. This reframing has direct implications for the current study. If matrices function as governance instruments rather than neutral measurement tools, their evaluation must include how their outputs behave as inputs to governance decisions, that is, whether they preserve prioritisation and escalation outcomes under alternative but legitimate elicitation formats. This is the question of escalation stability, developed above from the literature on decision robustness and prioritisation consistency, and the question this study addresses empirically.
Research questions
The four strands reviewed above identify distinct but complementary weaknesses: matrices are formally inconsistent (theoretical critique), cognitively unstable (behavioural critique), only partially remedied by existing redesigns (design critique), and valued partly because they perform organisational and symbolic work rather than because they measure exposure accurately (organisational critique). What is missing across these strands is large-sample empirical evidence of how matrices behave when treated as governance instruments: that is, evidence on whether the prioritisation and escalation outcomes they produce remain stable when the same risks are re-expressed using alternative, internally consistent representations of uncertainty. If matrices are narrative and governance artefacts as much as analytical tools (Green and Dikmen, 2022), then escalation stability, rather than axiomatic validity alone, is the criterion by which their fitness for purpose should be judged.
Against this backdrop, this study examines two research questions:
Do commonly used qualitative risk matrices preserve risk prioritisation and escalation outcomes when the same risks are re-expressed using quantitative elicitation?
What are the implications of any observed divergence for project risk governance and decision making?
Data and methods
Research approach and hypotheses
A comparative empirical design was used to evaluate whether qualitative risk matrices preserve prioritisation outcomes when compared with quantitative assessments of the same risks. Consistent with the diagnostic orientation of the research question, the study does not test behavioural or perceptual theories of risk judgement. Instead, it evaluates whether qualitative and quantitative elicitation methods produce equivalent assessments of probability, impact, and composite risk score. Following concerns raised in the literature regarding the theoretical, behavioural, and design effects of risk matrices, equivalence is assessed using three complementary criteria: central tendency, distributional similarity, and distance-based measures of divergence.
The analysis is organised around the three quantities that determine governance outcomes in risk matrices: probability, impact, and composite risk score. Comparisons are performed at two levels. First, qualitative and quantitative assessments are compared at the rating level using the original 1–5 scales (and the derived 1–25 risk score). Second, the analysis is repeated using probabilistic allocation of qualitative ratings into 5-percentage-point bins to examine whether apparent agreement at the ordinal level persists when discretisation effects are reduced.
For each of the three governance-relevant quantities, probability, impact, and risk score, the following null hypotheses are tested:
(Rating-level equivalence): Qualitative and quantitative assessments of the same risks are equivalent at the 1–5 (and 1–25) rating level for (H1a) probability, (H1b) impact, and (H1c) risk score, on three complementary measures: equal medians (Wilcoxon), identical distributions (KS), and practical equivalence (Wasserstein-1).
(Binned-resolution equivalence): When qualitative ratings are probabilistically allocated into 5-percentage-point bins and compared with similarly binned quantitative values, the resulting marginal distributions are equivalent for (H2a) probability, (H2b) impact, and (H2c) risk score, on two measures: identical distributions (chi-square) and practical equivalence (Wasserstein-1).
The primary governance interest is the composite risk score, with probability and impact analysed separately to identify the source of any divergence.
The full research design is summarised in Figure 2.
 The diagram illustrates the research design involving data sources, datasets, and analysis methods. It starts with data sources including risk registers from mining organizations and published national guidelines. Dataset 1 focuses on risk matrix formats, probability and impact scales, coloring and scoring methods, and decision frameworks. Dataset 2a contains 1,144 risks with qualitative and quantitative probability and impact. Dataset 2b also contains 1,144 risks with qualitative and quantitative probability and impact allocated to interval bins. The analysis includes comparing to Cox's axioms, probability and impact terms and ranges, and decision frameworks. Hypotheses and tests for median, distribution, and distance are applied to probability rating, impact rating, and risk score.
Research design
The diagram illustrates the research design involving data sources, datasets, and analysis methods. It starts with data sources including risk registers from mining organizations and published national guidelines. Dataset 1 focuses on risk matrix formats, probability and impact scales, coloring and scoring methods, and decision frameworks. Dataset 2a contains 1,144 risks with qualitative and quantitative probability and impact. Dataset 2b also contains 1,144 risks with qualitative and quantitative probability and impact allocated to interval bins. The analysis includes comparing to Cox's axioms, probability and impact terms and ranges, and decision frameworks. Hypotheses and tests for median, distribution, and distance are applied to probability rating, impact rating, and risk score.Research design
Data eligibility criteria
Risk registers were collected from mining capital projects in the feasibility study phase. Mining projects were selected because they are typically capital-intensive and characterised by high exposure to cost, schedule, and operational uncertainty, where unmitigated risks can materially affect business outcomes. The mining sector also exhibits relatively mature and formalised risk management practices, making it a suitable empirical setting for comparing qualitative and quantitative risk assessment approaches. The sample comprised mine infrastructure development projects, including new mine developments, mine expansions, and mineral processing facilities. Registers were excluded if they predated 2022 or related to non-infrastructure initiatives.
Data collection and confidentiality
Risk data were collected during facilitated workshops conducted between 2022 and 2025 as part of project risk consulting engagements, using a two-stage elicitation protocol.
In the first stage, project teams identified risks and assigned qualitative probability and impact ratings using their own organisation's framework, scales, and mapping rules, without external facilitation. Between one and four weeks later, an external consultancy facilitated a quantitative reassessment with the same project teams, conducted without reference to the original qualitative ratings, in which teams provided numerical estimates of probability and impact agreed by consensus.
Two design features warrant explicit comment. First, consultancy involvement was asymmetric: the qualitative assessments were produced by project teams using their own organisational frameworks without external influence, and the consultancy's role was confined to facilitating the quantitative reassessment. Any methodological influence is therefore on the quantitative side only. Second, the deliberate withholding of original qualitative ratings during the quantitative session was intended to minimise within-team anchoring. While complete elimination of anchoring effects cannot be guaranteed (the same teams retaining tacit memory of their earlier judgements) the protocol was designed to minimise this risk. To the extent that residual anchoring persists, it would most plausibly bias the quantitative assessment, narrowing observed divergence; the systematic divergence reported in the Results, particularly on impact ratings and composite scores, is therefore likely to be a conservative estimate of true format-driven divergence.
Additional publicly available risk registers and guidelines were sourced from mining-sector standards bodies and listed companies.
All records were anonymised prior to analysis; no company, project, location, or individual identifiers were retained. As the study evaluates risk assessment methods rather than individual behaviour, institutional ethical clearance was not required.
Datasets
Risk matrices were collected from 43 organisations operating in the mining sector. The sample included 28 mine owners (16 operating across multiple continents), 11 engineering, procurement, and construction management (EPCM) or engineering, procurement, and construction (EPC) organisations (8 of which are multinational), and four national standards-generating bodies for mining from Canada (Ministry of Energy Mines and Petroleum Resources Canada, 2018) and Australia (Association of Mining and Exploration Companies (AMEC), 2022; Department for Energy and Mining (DEM), 2018; Resources Victoria, 2025). Three datasets were compiled from these sources.
Dataset 1 (DS1): Matrix formats, probability and impact scales, colouring schemes, and scoring rules were extracted from the 43 organisational risk registers.
Dataset 2a (DS2a): Dataset 2a comprises 1,144 paired risk assessments from 91 mining projects using 5 × 5 risk matrices. Projects ranged in value from USD 645k to USD 116 million and in duration from 2 to 130 months. Qualitative ratings used 1–5 scales for probability and impact, while quantitative reassessments used discrete probabilities, event frequencies, and cost or schedule impacts expressed as percentages of baseline budget or duration.
For comparability, quantitative values were mapped back to the corresponding 1–5 categories and risk scores using each organisation's predefined mapping rules.
Because qualitative categories often span wide and heterogeneous numerical ranges, this retrofitting introduces discretisation bias. For example, a rating of “3” may represent 1–10% in one register and 20–50% in another; substantial numerical shifts can therefore remain invisible at the ordinal level. These differences complicate direct comparison between qualitative and quantitative assessments.
Dataset 2b (DS2b): To restore resolution, a 5-percentage-point binning strategy, the smallest common granularity observed, was applied. Each qualitative probability range was decomposed into contiguous 5% intervals, and risks were allocated across bins according to the range associated with their rating. Quantitative values were binned on the same grid.
The base case assumed uniform allocation within ranges; robustness checks employed left-skewed, right-skewed, and centred triangular allocations. Probability was mapped for all 1,144 risks, schedule impact for 1,056 risks, and cost impact for 281 risks.
Analysis methods
The analyses used three complementary classes of statistical test, each addressing a different facet of agreement between the qualitative and quantitative assessments: tests of whether the two formats produce the same central value (location tests), tests of whether they produce the same overall distribution shape (distributional tests), and tests of how far apart the two distributions are when both shape and location are considered together (distance metrics). Each is described in turn below; technical details of the statistical tests are provided in Appendix A, supplementary material.
Pairwise analysis of probability and impact ratings, and risk scores
In many of the studied risk registers, qualitative impact ratings did not distinguish between cost and schedule effects. In the few cases where separate ratings were recorded, organisations derived a single risk score using the maximum of the two values. For consistency, the same approach was applied when retrofitting the quantitative assessments, with the maximum of the cost and schedule impacts used to calculate a single risk score for pairwise comparison.
To exploit the paired nature, the qualitative and quantitative assessments for three outcomes were tested on the same set of risks, i.e. Probability (1–5), Impact (1–5), and Risk Score (1–25).
The following tests were performed:
Location (paired) tests. To evaluate whether qualitative and quantitative assessments differed in central tendency, a two-sided Wilcoxon signed-rank test with Pratt correction was applied. Effect size was quantified using the Hodges-Lehmann (HL) pseudo-median estimate with bootstrap confidence intervals (Hodges and Lehmann, 2011).
Distributional equality tests. To assess whether the qualitative and quantitative assessments were drawn from the same underlying distribution, a two-sample Kolmogorov-Smirnov (KS) (Massey, 1951) test (two-sided) was applied, with permutation p-values computed.
Distance metric. Distributional differences were quantified using the Wasserstein-1 distance (W1; also known as the Earth Mover's Distance) (Peyré and Cuturi, 2019) with normalised distance (W1_norm).
Analysis of binned distributions
For the binned distribution comparisons, we test H2a-c: qualitative and quantitative values come from the same distribution.
The binning procedure is not intended to replace the paired comparison of ordinal ratings, but to serve as a diagnostic sensitivity analysis. Its purpose is to examine whether apparent agreement at coarse rating levels persist when qualitative assessments are expressed at higher resolution, consistent with the probability and impact ranges defined in the risk registers. By restoring resolution lost through categorical scoring, the binning analysis tests whether qualitative and quantitative assessments remain distributionally equivalent once discretisation effects are reduced. The following tests were performed:
Chi-square test of homogeneity. To test whether binned qualitative and binned quantitative assessments share the same distribution, a chi-square test of homogeneity was applied to a 2 × K contingency table, where K represents the number of probability or impact bins.
Wasserstein-1 distance (W1). To quantify the magnitude of divergence between qualitative and quantitative assessments, the W1 was computed.
Results
Risk matrices
Across 43 organisations there were 34 uniquely coloured risk matrices (Link to the website). Of these, 29 used 5 5 matrices, one used a 6 5 matrix, three used 6 6 matrices, and one had a 5 7 matrix. Decision frameworks based on the risk score and colour were defined for 22 matrices. None of the organisations provided an explanation for their choice of colour codes or probability and impact ranges.
Most organisations defined risk impact categories (e.g. cost, schedule, health and safety, community etc.) with 37 organisations allocating risks with more than one impact category on the same register, 3 assigned each risk category to its own register, and 3 did not define risk impact categories. The maximum categories assigned to a single register were 22.
Thirteen unique sets of probability rating terms were used across the organisations (Link to the website); of these, 36 assigned numerical probability ranges to the probability terms (Link to the website). The most used set of terms were rare, unlikely, possible, likely, and almost certain with 25 occurrences (Set A in Link to the website). The numerical probability ranges assigned to the Set A terms vary widely with rare between 0% and 20%, unlikely between 0.1% and 40%, possible between 1.0% and 75%, likely between 3.0% and 100%, and almost certain between 10% and 100% (Link to the website).
Thirty-three organisations defined cost impact rating ranges and 23 defined cost and schedule impact rating ranges (Link to the website). These ranges indicate the impact a risk is expected to have on the total cost or total duration of the project. In 23 of the studied risk registers, the impact rating was given as a percentage of the cost or duration and in 10 cases the impact was given as a fixed cost or duration value. In all but three cases, the impact percentages were the same for the cost and schedule impact (Link to the website).
Three different approaches were used to calculate the risk score that mapped to the risk matrices in Link to the website. In 12 matrices direct multiplication of probability and impact was used (e.g. register 2), in 14 matrices risk score was a non-linear function of probability and impact (e.g. register 1), and in 8 matrices non-numeric risk scores were allocated to cells (e.g. register 8).
Analysis of risk ranks and scores
Qualitative and quantitative probability ratings of the DS2a dataset showed small differences in the probability ratings (Figure 3a), but there was a clear shift to lower quantitative impact ratings compared to the qualitative ratings (Figure 3b).
 The bar graph compares qualitative and quantitative probability and impact ratings. The x-axis represents the ratings on a scale from 1 to 5. The y-axis represents the frequency of each rating. There are two sets of vertical bars for each rating value, one for qualitative and one for quantitative. The qualitative bars are blue, and the quantitative bars are yellow. For probability, the highest frequency is at rating 3, with qualitative having a higher frequency than quantitative. For impact, the highest frequency is at rating 1, with quantitative having a higher frequency than qualitative. All values are approximated.
Comparison of qualitative and quantitative probability and impact ratings (N = 1,144)
The bar graph compares qualitative and quantitative probability and impact ratings. The x-axis represents the ratings on a scale from 1 to 5. The y-axis represents the frequency of each rating. There are two sets of vertical bars for each rating value, one for qualitative and one for quantitative. The qualitative bars are blue, and the quantitative bars are yellow. For probability, the highest frequency is at rating 3, with qualitative having a higher frequency than quantitative. For impact, the highest frequency is at rating 1, with quantitative having a higher frequency than qualitative. All values are approximated.Comparison of qualitative and quantitative probability and impact ratings (N = 1,144)
Risk probability showed negligible paired differences and no detectable distributional divergence, with very small distance-based metrics (Table 1, Figure 4a). The Wilcoxon signed-rank test, KS test, Wasserstein-1, and normalised W1 distance all failed to detect statistically meaningful differences at the rating level. H1a was therefore not rejected on any of the three measures: medians were equal, distributions did not differ significantly, and the normalised W1 distance fell below the practical-equivalence threshold of 0.05.
Comparison of qualitative vs quantitative probability ratings, impact ratings, and risk scores (N = 1,144)
| Location and difference statistics | |||
|---|---|---|---|
| Parameter | Risk probability | Risk impact | Risk score |
| Mean difference (Qual – Quant) | −0.01 | 1.11 | 4.62 |
| Median difference | 0 | 1 | 5 |
| Hodges-lehmann estimate | 0 | 1 | 5 |
| 95% Bootstrap CIa | [0, 0] | [1, 1] | [5, 5] |
| Paired test | |||
|---|---|---|---|
| Test | Risk probability | Risk impact | Risk score |
| Wilcoxon signed-rank (Pratt) | W = 267,649 (p = 0.538) | W = 79,274 (p < 0.001) | W = 118,278 (p < 0.001) |
| Distributional test | |||
|---|---|---|---|
| Test | Risk probability | Risk impact | Risk score |
| Kolmogorov-Smirnov | D = 0.05 (p = 0.188) | D = 0.44 (p < 0.001) | D = 0.38 (p < 0.001) |
| KS permutation p-valueb | p = 0.075 | p < 0.001 | p < 0.001 |
| Distance-based tests | |||
|---|---|---|---|
| Metric | Risk probability | Risk impact | Risk score |
| Wasserstein-1 (W1) | 0.08 | 1.11 | 4.62 |
| 95% bootstrap CI (paired)a | [0.05, 0.13] | [1.02, 1.19] | [4.18, 5.04] |
| Normalised W1 | 0.02c | 0.28c | 0.19d |
| 95% CI | [0.01, 0.03] | [0.26, 0.30] | [0.17, 0.21] |
Bootstrap confidence intervals based on 5,000 paired resamples
Permutation p-values computed using 5,000 paired-label permutations
Normalised Wasserstein distances computed using the observed 1–5 scale range
Normalised Wasserstein distances computed using the observed 1–25 scale range
 Three line graphs compare qualitative and quantitative data for probability, maximum impact, and risk score. Panel A shows a line graph comparing probability ratings. The x-axis is labeled Value ranging from 1 to 5, and the y-axis is labeled ECDF ranging from 0.0 to 1.0. Two lines are plotted: one for Qualitative data in blue and one for Quantitative data in orange. Both lines show step-like increases. Panel B shows a line graph comparing maximum impact ratings. The x-axis is labeled Value ranging from 1 to 5, and the y-axis is labeled ECDF ranging from 0.0 to 1.0. Two lines are plotted: one for Qualitative data in blue and one for Quantitative data in orange. The lines show step-like increases with some divergence. Panel C shows a line graph comparing risk scores. The x-axis is labeled Value ranging from 0 to 25, and the y-axis is labeled ECDF ranging from 0.0 to 1.0. Two lines are plotted: one for Qualitative data in blue and one for Quantitative data in orange.
Pairwise comparison of probability ratings, impact ratings, and risk scores
Three line graphs compare qualitative and quantitative data for probability, maximum impact, and risk score. Panel A shows a line graph comparing probability ratings. The x-axis is labeled Value ranging from 1 to 5, and the y-axis is labeled ECDF ranging from 0.0 to 1.0. Two lines are plotted: one for Qualitative data in blue and one for Quantitative data in orange. Both lines show step-like increases. Panel B shows a line graph comparing maximum impact ratings. The x-axis is labeled Value ranging from 1 to 5, and the y-axis is labeled ECDF ranging from 0.0 to 1.0. Two lines are plotted: one for Qualitative data in blue and one for Quantitative data in orange. The lines show step-like increases with some divergence. Panel C shows a line graph comparing risk scores. The x-axis is labeled Value ranging from 0 to 25, and the y-axis is labeled ECDF ranging from 0.0 to 1.0. Two lines are plotted: one for Qualitative data in blue and one for Quantitative data in orange.Pairwise comparison of probability ratings, impact ratings, and risk scores
In contrast, risk impact ratings exhibited substantial and systematic differences between elicitation methods. Paired differences were consistently positive, the Wilcoxon test indicated a strong location shift, and the KS test revealed pronounced distributional divergence.
Distance-based metrics corroborated these findings, with large Wasserstein distances and bootstrap confidence intervals indicating substantial and practically meaningful divergence (Table 1, Figure 4b). H1b was rejected on all three measures: the Wilcoxon test indicated a location shift, the KS test indicated distributional divergence, and the normalised W1 distance exceeded the practical-equivalence threshold.
Risk scores showed the largest divergence across all metrics. Paired differences were substantial and directional, with qualitative scoring producing systematically higher risk scores than quantitative assessments. Both the Wilcoxon and KS tests indicated strong differences, and distance-based metrics confirmed that these differences were practically meaningful (Table 1, Figure 4c). H1c was rejected on all three measures, with the Wilcoxon, KS, and normalised W1 results all indicating substantial and practically meaningful divergence.
Together, these results indicate that probability ratings show alignment at the ordinal rating level, but higher-resolution analysis reveals small but systematic divergence. However, the two elicitation methods (qualitative vs. quantitative) produced substantially different impact rating estimates, overall risk scores, and resultant risk matrix colour allocation.
Analysis of the jump in colour bands for the risk score show that quantitative reassessment lowered the escalation colour band in 59.4% of risks, with only 13.9% moving upward. Notably, 37.2% of risks shifted by two or more colour categories, representing material reclassification that would likely alter escalation, mitigation prioritisation, and governance attention (Table 2). Overall, 73.3% of risks changed colour category when moving from qualitative to quantitative reassessment.
Changes in colour band between qualitative and quantitative risk scores
| Upward colour band adjustment | Downward colour band adjustment | ||||
|---|---|---|---|---|---|
| Number of bands jumped | Count | Percentage | Number of bands jumped | Count | Percentage |
| 4 | 53 | 4.6% | 4 | 4 | 0.3% |
| 3 | 24 | 2.1% | 3 | 52 | 4.5% |
| 2 | 15 | 1.3% | 2 | 278 | 24.3% |
| 1 | 67 | 5.9% | 1 | 345 | 30.2% |
| Total | 159 | 13.9% | Total | 679 | 59.4% |
The limitations of retrofitting to rating scales with broad ranges of values may, however, hide the true shift between qualitative and quantitative assessments, and in the next section an analysis of the binned data (DS2b) is reported.
Comparison of binned probability and impact ratings
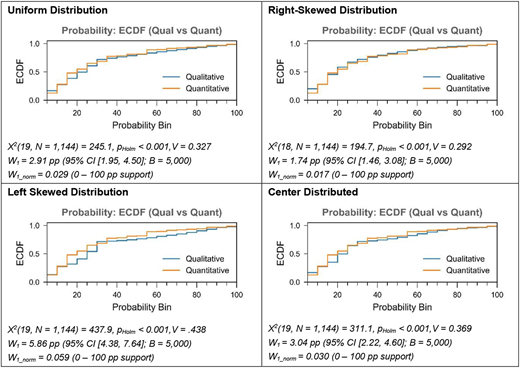
The number of risks per percentage interval under uniform allocation is reported in Link to the website. Robustness was assessed using alternative left-skewed, right-skewed, and centred allocation schemes. Across all allocation schemes, distributional differences between qualitative and quantitative assessments were consistent for probability, schedule impact, and cost impact, as reflected in the overlaid histograms, ECDFs, chi-square tests of homogeneity, and Wasserstein-1 distance metrics.
For probability, divergence was small in magnitude but persistent. Although effect sizes were weaker under the right-skewed allocation, chi-square and Wasserstein-1 results consistently indicate that the binned qualitative distribution does not reproduce the quantitative distribution (Table 3).
For schedule and cost impact, divergence was pronounced across all allocation schemes. Both inferential and distance-based measures show clear and systematic differences between elicitation methods, with substantially larger effect sizes than those observed for probability (Table 4, Table 5).
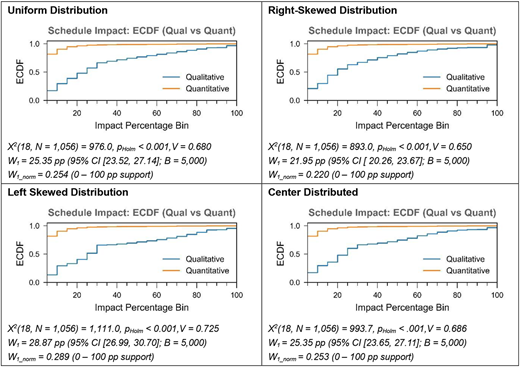
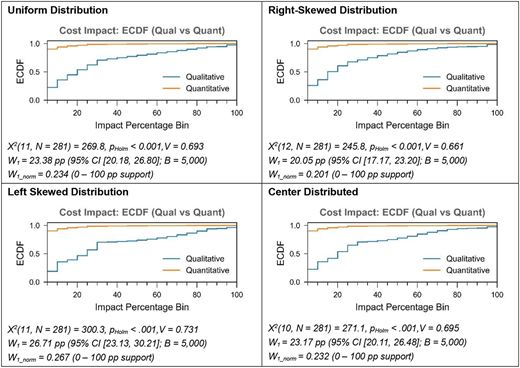
Accordingly, the null hypotheses H2a-H2c were rejected: probabilistic binning does not reconcile qualitative and quantitative assessments.
Results summary
Across 43 mining organisations and 91 projects, substantial variation was observed in matrix design, including probability and impact scales, colour schemes, and scoring rules. Paired analysis of 1,144 risks showed statistical alignment between qualitative and quantitative probability ratings at the ordinal level. In contrast, qualitative impact ratings and composite risk scores were systematically higher than quantitative reassessments, with large and practically meaningful differences in both central tendency and distribution. High-resolution binning and robustness analyses confirmed that these divergences persist under alternative allocation assumptions.
Overall, the findings indicate that impact inflation, rather than probability misestimation, drives distortion in composite risk scores, materially affecting prioritisation and potentially influencing resource allocation decisions.
Discussion
The study set out to examine whether qualitative risk matrices preserve risk prioritisation and escalation outcomes when the same risks are re-expressed using quantitative elicitation (RQ1), and to explore the implications of any observed divergence for project risk governance and decision making (RQ2). The results provide little evidence that qualitative matrices consistently preserve escalation stability. While probability ratings showed broad alignment at the ordinal level, qualitative impact ratings and composite risk scores diverged substantially from their quantitative counterparts, resulting in widespread reclassification of escalation categories. The discussion that follows considers the structural, behavioural, and governance implications of these findings.
Risk matrix configurations
Cox's axioms
Across 43 organisations, 34 distinct matrix configurations were observed, indicating substantial heterogeneity in risk representation and prioritisation. Such variation raises concerns about decision consistency, as violations of Cox's axioms imply that matrix structure alone can alter escalation and resource allocation independently of underlying exposure (Cox, 2009).
Three matrices (4, 31, and 34 in Link to the website) violated the weak consistency axiom, allowing risks in the highest category to be lower in exposure than those in the lowest category. In such cases, escalation may be driven by geometry rather than magnitude.
No matrix violated Cox's formal betweenness axiom; however, under a stricter “no-skip” interpretation, where transitions should not bypass intermediate categories, only 10 matrices complied, indicating that many designs permit abrupt classification jumps that undermine graded escalation.
All matrices violated the consistent colouring axiom: iso-risk curves frequently crossed colour boundaries. As illustrated for Matrix 23 (Figure 5), equal quantitative risk levels were assigned different colours, demonstrating that colour categories do not reliably correspond to underlying exposure. This structural inconsistency directly contributes to distorted prioritisation.
 Panel A: A heat map titled Isometric Lines: Fixed-Width Cells. The heat map compares impact versus probability using fixed-width cells. The x-axis represents impact ranging from 0.0 to 1.0, and the y-axis represents probability ranging from 0.0 to 1.0. The heat map is divided into a 5 by 5 grid with cells numbered from 1 to 25. The color scale ranges from green to red, indicating increasing values. Green cells represent lower values, transitioning through yellow and orange to red cells representing higher values. Notable regions include the green cells in the lower-left corner indicating lower impact and probability, and red cells in the upper-right corner indicating higher impact and probability. Panel B: A heat map titled Isometric Lines: Scaled-Width Cells. The heat map compares impact versus probability using scaled-width cells. The x-axis represents impact ranging from 0.0 to 1.0, and the y-axis represents probability ranging from 0.0 to 1.0.
Isometric risk lines
Panel A: A heat map titled Isometric Lines: Fixed-Width Cells. The heat map compares impact versus probability using fixed-width cells. The x-axis represents impact ranging from 0.0 to 1.0, and the y-axis represents probability ranging from 0.0 to 1.0. The heat map is divided into a 5 by 5 grid with cells numbered from 1 to 25. The color scale ranges from green to red, indicating increasing values. Green cells represent lower values, transitioning through yellow and orange to red cells representing higher values. Notable regions include the green cells in the lower-left corner indicating lower impact and probability, and red cells in the upper-right corner indicating higher impact and probability. Panel B: A heat map titled Isometric Lines: Scaled-Width Cells. The heat map compares impact versus probability using scaled-width cells. The x-axis represents impact ranging from 0.0 to 1.0, and the y-axis represents probability ranging from 0.0 to 1.0.Isometric risk lines
Range compression
All matrices in Link to the website use equal-sized cells, visually implying linear probability and impact scales. However, the underlying scales are non-linear for all impact categories and for all but four probability scales (Link to the website). When cell widths are adjusted to reflect actual numerical ranges, iso-risk lines cluster disproportionately in higher categories, as illustrated for Matrix 23 (Figure 5). Visually linear matrices may therefore overstate high-risk regions, a pattern consistent with the experimental findings of Sutherland et al. (2022) on how matrix design influences risk perception.
Risk decision frameworks
Predefined management actions mapped to risk-score bands (e.g. monitor, mitigate, escalate) appear in 22 of the 34 matrices reviewed. While convenient, collapsing probability and impact into a single composite score obscures their interaction and can equate fundamentally different risks. As Williams (1996, p. 185) notes, ranking risks by multiplying probability and impact is misleading and may mask the underlying drivers of uncertainty and their relevance to project objectives. Score-based rules should therefore be applied cautiously and supplemented, where feasible, by separate consideration of probability, impact, and causal structure.
Rank clustering and central tendency
Across the 5-point probability and impact scales, ratings exhibit pronounced central tendency, with respondents clustering around mid-scale categories, particularly rating 3 (Figure 3). There is no theoretical reason for probability or impact to follow this distribution, and the numerical ranges associated with mid-scale ratings vary widely across organisations (Link to the website). This pattern is consistent with response-style effects documented in the elicitation literature (Wallsten et al., 1993), although the present design cannot rule out alternative explanations such as genuine clustering of project risks around moderate exposure levels.
At the rating level, qualitative and quantitative probability assessments appear statistically aligned (H1a). However, higher-resolution binning reveals small but systematic divergence (H2a). For impact, both rating-level and binned analyses show consistent downward shifts under quantitative reassessment (H1b, H2b). These findings indicate that apparent ordinal agreement masks underlying distributional distortion.
Taken together, the evidence suggests that qualitative matrices do not merely record judgements but shape them. Central tendency and range compression effects embedded in ordinal formats contribute to inflated impact ratings and distorted composite scores, reinforcing concerns about the reliability of score-based prioritisation.
Limitations of quantitative reassessment
The quantitative reassessment is not treated here as ground truth, and its limitations warrant explicit comment. In feasibility-stage mining projects, project-specific frequency data are typically sparse, so numerical estimates rely heavily on judgement calibrated against analogue projects, sector benchmarks, and historical records whose applicability to the project at hand is itself uncertain (Zhang et al., 2025). Counterparty and contextual risks are translated from judgement into numbers rather than measured; group dynamics, facilitation effects, and accountability pressures shape quantitative workshops as well as qualitative ones; point estimates can convey unwarranted precision (Hubbard and Evans, 2010); and both formats in this study treat risks as independent line items, ignoring correlation and cascading effects (Qazi et al., 2020). Optimism bias in cost and duration estimation (Andersen et al., 2016; Flyvbjerg, 2008; Kahneman and Lovallo, 1993) would tend to depress numerical impact estimates, making the divergence reported here a conservative one.
The central argument of the paper does not, however, require the quantitative reassessment to be more accurate than the qualitative one. Two legitimate, internally consistent representations of the same risks placed those risks in materially different escalation categories within weeks. Whichever is closer to underlying exposure, the divergence itself is the governance problem, and the limitations of both formats strengthen rather than weaken the case for the hybrid configuration advanced below.
Causation, interpretation, and decision implications
The paired analyses establish that qualitative and quantitative elicitation formats produce systematically different impact ratings and composite risk scores for the same risks, but the design cannot adjudicate why. Plausible mechanisms include anchoring on verbal categories and risk aversion (Kahneman and Tversky, 1979; Slovic, 2016), social dynamics within facilitated workshops (Sunstein and Hastie, 2015), organisational incentives embedded in colour-coded escalation systems (Cox, 2009; Proto et al., 2023), discretisation effects from coarse ordinal scales, and range-compression effects produced by equal-width cells representing non-linear impact ranges (Sutherland et al., 2022). Mechanisms operating on the quantitative side, including loss-aversion under explicit numerical commitment and rounding to defensible figures, would tend to depress numerical impact estimates without any change in underlying belief. The observed divergence is likely the joint product of several of these factors, and disentangling their relative influence would require controlled experiments varying matrix geometry, scale structure, and elicitation format independently. The candidate mechanisms identified here should therefore be read as hypotheses for future research rather than as established explanations.
The governance implication, however, does not depend on identifying the underlying mechanism. Whatever the cause, qualitative and quantitative formats produce materially different escalation outcomes for the same risks, introducing governance noise independent of actual exposure.
From qualitative matrices to quantitative and hybrid risk frameworks
The findings do not imply that a single quantitative method is universally superior; rather, they indicate that reliance on ordinal scoring alone is insufficient where escalation and resource allocation depend on composite scores.
In capital projects, quantitative methods such as Monte Carlo simulation are already used to model cost and schedule uncertainty. These approaches preserve distributional resolution, enable explicit treatment of tail risk, and support expected-value-based prioritisation. For risks involving interdependencies, structured probabilistic models further enhance coherence by representing interaction effects rather than collapsing exposure into a single score.
A pragmatic path forward is therefore hybrid. Qualitative matrices may remain valuable for communication and early risk identification, but escalation thresholds, contingency setting, and capital allocation should be informed by parallel quantitative analysis. In this configuration, matrices facilitate dialogue while numerical models provide the underlying decision logic.
The issue is not the simplicity of matrices, but their use as analytical substitutes for quantitative exposure assessment and decision making in high-stakes governance contexts.
Managerial implications for project-based organisations
The findings suggest that governance decisions based on risk matrices may be sensitive to elicitation format rather than underlying exposure. Quantitative reassessment altered escalation colour bands in 73.3% of risks, with 59.4% downgraded and 37.2% shifting by two or more categories. This indicates that the prioritisation and escalation outcomes produced by matrix-based systems are not stable across alternative representations of the same risks. For project-based organisations, this raises important questions regarding the robustness of escalation procedures, contingency allocation, and risk-informed decision making.
Escalation stability
In many organisations, colour bands are directly linked to prescribed management actions. If escalation categories change under alternative elicitation methods, decisions become sensitive to representational format rather than underlying exposure. Boards and PMOs should therefore periodically test escalation stability through a lightweight audit on a sample of active risks: (1) select 30 to 50 risks across upper- and mid-band categories from current registers; (2) reassess each numerically using discrete probabilities and percentage impacts on baseline cost or duration, without reference to the original ratings to minimise anchoring; (3) map the numerical values back to the organisation's existing scale and colour bands; and (4) tabulate the proportion, direction, and magnitude of band changes. A material proportion of multi-band shifts, particularly downgrades that vacate the upper band, indicates that matrix geometry and scale design, rather than risk magnitude, may be driving governance outcomes, and warrants recalibration of impact ranges, scale geometry, or colour thresholds.
Risk saturation and prioritisation
The predominance of downward reclassification suggests that qualitative scoring may inflate impact categories and crowd upper colour bands. When escalation categories saturate, governance mechanisms lose discriminating power and “red” risks become less informative. Two-band shifts in 37.2% of cases further imply that mitigation priorities and contingency allocations may vary materially across formats. In portfolio contexts, ordinal composite scores should not be assumed to represent stable exposure ordering; where capital allocation is significant, distribution-based or expected-value analyses provide more defensible prioritisation.
Separate communication from decision logic
Risk matrices remain useful communication tools, but the instability of colour-band classification indicates that they should not serve as sole decision engines. Hybrid configurations, where matrices support stakeholder dialogue while quantitative analysis informs escalation thresholds and contingency sizing, can preserve communicative clarity while enhancing governance robustness.
In a typical capital-project governance process, a hybrid configuration might operate as follows. At the project level, teams continue to identify and rate risks qualitatively using the organisation's existing matrix; this preserves the stakeholder dialogue, accessibility, and reporting cadence that matrices already support. In parallel, the same risks are reassessed numerically, using discrete probabilities and percentage impacts on baseline cost or duration, and aggregated into a project-level quantitative risk profile, typically through Monte Carlo simulation of cost and schedule contingency. Governance forums then receive both views: the qualitative matrix for narrative reporting and stakeholder communication, and the quantitative profile for decisions on escalation, contingency sizing, and capital allocation. Escalation thresholds at the portfolio level are anchored to the quantitative profile (for example, expected exposure, P80 cost contingency, or tail-risk metrics), while colour bands continue to support communication within the project team. This separation preserves the communicative role of the matrix while ensuring that high-stakes governance decisions, those most sensitive to the format-driven distortions documented in this study, rest on representations that retain distributional resolution.
A practical question arises when the qualitative and quantitative views diverge on the same risk. The hybrid configuration does not require teams to adjust qualitative colour bands to match quantitative reassessments, doing so would route the quantitative value back through the matrix's mapping rules and reintroduce the format-driven distortions the configuration is designed to bypass. Instead, the two views are retained as independent inputs, with material disagreements between them serving as a governance signal. Where the quantitative profile places a risk in a substantially different exposure region from its qualitative classification, the disagreement itself warrants review, either of the assessment inputs or of the matrix design.
A second practical question concerns durability. Hybrid approaches are vulnerable to ritualisation: teams may complete the qualitative matrix as the visible governance artefact and treat the parallel quantitative analysis as a compliance exercise that is acknowledged but not used (Raz and Michael, 2001). Two design choices reduce this risk. First, governance forums should explicitly anchor escalation thresholds and contingency decisions on the quantitative profile, with the qualitative matrix occupying a clearly subordinate communication role. Second, divergences between the two views should be reviewed at governance milestones, so that the configuration generates information rather than redundant documentation.
Treat risk assessment design as governance design
Matrix structure is not neutral. Impact scales, colour thresholds, and scoring rules shape escalation patterns and executive attention. Organisations should therefore treat matrix configuration as a governance design choice rather than a compliance artefact, periodically calibrating thresholds against quantitative benchmarks to preserve stability and coherence.
These findings align with longstanding critiques that risk matrices can distort prioritisation (Cox, 2008; Thomas et al., 2014; Wall, 2011). While this study does not test accuracy directly, prior research suggests that numerical representations exhibit greater calibration and coherence than ordinal formats in controlled settings (Budescu and Wallsten, 1995; Duijm, 2015; Lichtenstein et al., 1977; Wallsten et al., 1986), reinforcing the case for quantitative inputs into high-stakes governance decisions.
Limitations and future directions
This study focuses on mining capital projects, where structured feasibility-stage workshops and mature risk practices provide a rigorous empirical setting for comparing qualitative and quantitative assessments. While divergence between formats was consistent and statistically significant, the study does not claim that quantitative values represent a more accurate measure of risk.
The sectoral focus limits generalisability. The mechanisms identified, i.e. range compression, central tendency, and qualitative-to-quantitative impact inflation, arise from the structural properties of matrix design and group elicitation, and would be expected to operate similarly in sectors with comparable risk-management maturity, such as oil and gas, large-scale construction, and infrastructure. In sectors where risk management is less formalised, such as software development, healthcare delivery, or smaller-scale professional services, the relationship is harder to predict. Less formalised settings may exhibit either larger divergence (because elicitation is less disciplined and more susceptible to anchoring on verbal labels) or smaller divergence (because matrices are used less ritualistically and decisions rely on other inputs). Empirical work in such settings is needed to distinguish these possibilities.
A further limitation applies to the field as a whole rather than to this study alone. The true quality of any risk assessment, qualitative or quantitative, can ultimately only be judged against realised project outcomes: did the risks identified materialise, and were their impacts close to those estimated? Such validation requires longitudinal datasets linking feasibility-stage assessments to delivered cost, schedule, safety, and operational performance at the level of individual risks, not just aggregate project outcomes. These datasets are scarce in the published literature and difficult to assemble retrospectively, since mitigated risks cannot easily be distinguished from misestimated ones. Until outcome-based evidence is available, both formats, including the hybrid configuration advocated here, should be evaluated primarily on procedural criteria such as escalation stability, prioritisation consistency, and decision robustness.
Conclusion
This study addressed two research questions. First, it examined whether qualitative risk matrices preserve risk prioritisation and escalation outcomes when the same risks are re-expressed using quantitative elicitation methods. Second, it considered the implications of any observed divergence for project risk governance and decision making. The results indicate that qualitative and quantitative elicitation methods do not consistently produce equivalent outcomes. While probability ratings align at the ordinal level, qualitative impact ratings and composite risk scores are systematically higher than their quantitative counterparts, resulting in substantial reclassification of escalation categories.
The first contribution is empirical. Across 43 mining organisations and 91 capital projects, the paper provides large-sample evidence, based on 1,144 paired qualitative and quantitative assessments of the same risks, that the two elicitation formats diverge systematically. Probability ratings align at the ordinal level, but qualitative impact ratings and composite risk scores are systematically higher than their quantitative counterparts, and quantitative reassessment alters escalation colour bands in 73.3% of cases. To our knowledge, this is the largest paired empirical comparison of qualitative and quantitative risk elicitation in capital projects to date, and it establishes that governance outcomes, not just statistical estimates, are sensitive to elicitation format.
The second contribution is conceptual. The paper introduces escalation stability as a governance-oriented criterion for evaluating risk assessment tools: a risk artefact is escalation-stable if the same underlying exposure produces the same escalation outcome regardless of whether it is elicited qualitatively or quantitatively. Escalation stability extends established notions of decision robustness and prioritisation consistency from the properties of individual estimates to the governance behaviour of the artefacts that translate estimates into action. Together with the comparative analytical framework, paired nonparametric tests, distributional analysis, Wasserstein distance metrics, and high-resolution binning, it offers a replicable template for assessing whether risk assessment tools preserve prioritisation under alternative representations of uncertainty.
The broader implication is that organisations should evaluate risk assessment tools not only on their communicative value but also on their ability to preserve stable prioritisation and escalation outcomes. The argument is not that quantitative methods are universally superior, but that escalation stability should be treated as a governance criterion in its own right. In capital-intensive environments, where escalation triggers material capital-allocation decisions, instability under alternative elicitation formats constitutes a decision-quality risk that organisations should actively design against. Ensuring that risk assessment artefacts preserve ordering coherence and escalation stability should therefore be regarded as a core element of project governance design.
The supplementary material for this article can be found online: Link to the website

